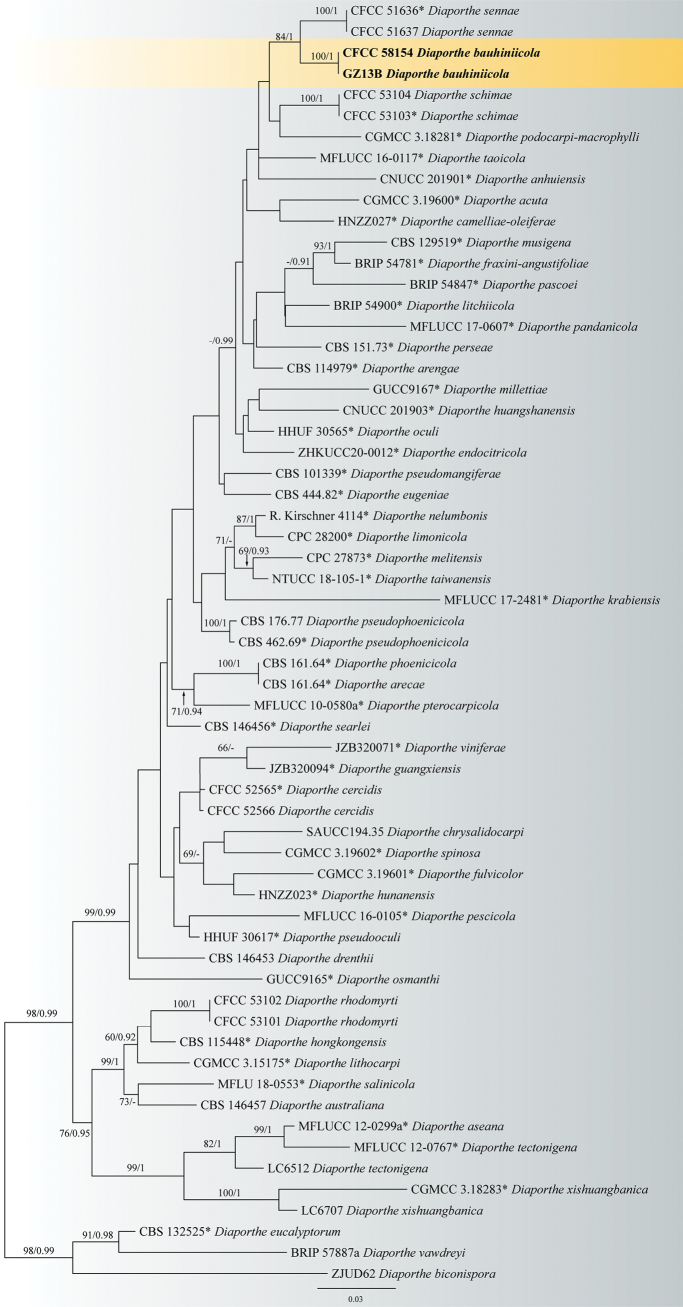
Figure 1.
Phylogram of Diaporthearecae species complex resulting from a maximum likelihood analysis based on a combined matrix of ITS, cal, his3, tef1 and tub2 loci. Numbers above the branches indicate ML bootstrap values (left, ML BS ≥ 50%) and Bayesian posterior probabilities (right, BPP ≥ 0.9). Isolates from the present study are in bold and ex-type strains are marked with *.

