Abstract
Metastasis occurs frequently after resection of pancreatic cancer (PaC). We hypothesized that multi-parametric analysis of pre-metastatic liver biopsies would classify patients according to their metastatic risk, timing, and organ site. Liver biopsies obtained during pancreatectomy from 49 patients with localized PaC and 19 control patients with non-cancerous pancreatic lesions were analyzed combining metabolomic, tissue and single cell transcriptomics, and multiplex imaging approaches. Patients were followed prospectively (median three years) and classified into four recurrence groups; early (<6 months post resection) or late (>6 months post resection) liver metastasis (LiM), extrahepatic metastasis (EHM), and disease-free survivors (NED). Overall, PaC livers exhibited signs of augmented inflammation, compared to controls. Enrichment of neutrophil extracellular traps (NETs), Ki-67 upregulation, and decreased liver creatine significantly distinguished those with future metastasis from NED. Patients with future LiM were characterized by scant T cell lobular infiltration, less steatosis, and higher levels of citrullinated H3, compared to patients that developed EHM metastasis, who had overexpression of interferon target genes (MX1, NR1D1) and an increase of CD11B+ NK cells. Upregulation of sortilin-1 and prominent NETs, together with the lack of T cells and a reduction in CD11B+ NK cells, differentiated patients with early-onset from those with late-onset LiM. Liver profiles of NED closely resembled those of controls. Using the above parameters, a machine learning-based model was developed that successfully predicted the metastatic outcome at the time of surgery with 78% accuracy. Therefore, multi-parametric profiling of liver biopsies at the time of PaC diagnosis may determine metastatic risk and organotropism, and guide clinical stratification for optimal treatment selection.
Introduction
Pancreatic cancer (PaC) is an aggressive malignancy, with rising incidence1 and a high rate of metastatic disease. Less than 25% of cases are amenable to potentially curative resection, and of those, only 21% of patients survive to 5 years1,2. Liver metastasis (LiM) develops in over 40% of patients within the first three years after surgery, and is almost uniformly fatal within months of its occurence2,3. Extrahepatic metastasis (EHM) occurs mainly in the peritoneum and lung, with isolated lung metastases correlating to less aggressive disease2,3. The inability to predict the risk of subsequent LiM or EHM in patients with otherwise undetectable metastatic disease and effectively treat it represent major challenges in the management of PaC. Furthermore, the biologic determinants of organotropism, within the primary tumor and metastatic organs, remain largely undefined. Here, we show that in patients with localized PaC perioperative liver biopsies reveal liver alterations consistent with a pre-metastatic niche prior to overt metastatic colonization. Thus, we extensively characterized the molecular, cellular, and metabolic alterations in PaC pre-metastatic livers and developed a liver biopsy-based model that predicted future sites of distant recurrence: early LiM (within 6 months post-resection), late LiM (more than 6 months post resection), extrahepatic-only metastasis (EHM), or no evidence of disease (NED). This classification schema could identify patients who benefit more from surgery versus neoadjuvant therapy (NAT).
Pre-metastatic livers of PaC patients exhibit inflammation
To determine pre-metastatic niche features in livers of patients with PaC, we analyzed the molecular, cellular, and metabolic profiles of intraoperatively collected liver biopsies from patients with localized, resectable PaC (n=49) and non-PaC controls (n=19) who underwent pancreatectomy without receipt of any NAT (Fig. 1 and Supplementary Table 1). Two pathologists independently evaluated the liver biopsies by histology and p53 immunostaining (Supplementary Fig. S1) to confirm the absence of micrometastases. Bulk liver tissue mRNA sequencing (mRNAseq) identified 79 differentially expressed genes (DEGs) that were significantly altered in PaC livers compared to non-PaC livers, including upregulation of cell migration-inducing and hyaluronan-binding proteins (KIAA1199/CEMIP), matrix metalloproteinase-7 (MMP7), lysyl oxidase like 4 (LOXL4), V-set domain-containing T-cell activation inhibitor 1 (VTCN1/B7-H4), triggering receptor expressed on myeloid cells 2 (TREM2), toll-like receptor 7 (TLR7), and Ki-67 (MKI67) (Fig. 2a; Supplementary Table S2). Gene set enrichment analysis (GSEA; Supplementary Table S3 and Suplementary_Tables_1.xlsx) highlighted interferon response and allograft rejection as significantly enriched gene sets in PaC (Fig. 2b). DEGs upregulated in PaC were prominent in immune-cell gene clustering4, suggesting enhanced monocyte and lymphocyte chemotaxis in PaC pre-metastatic livers5 (Fig. 2c–d).
Figure 1 |. Study schema and classification into recurrence groups.
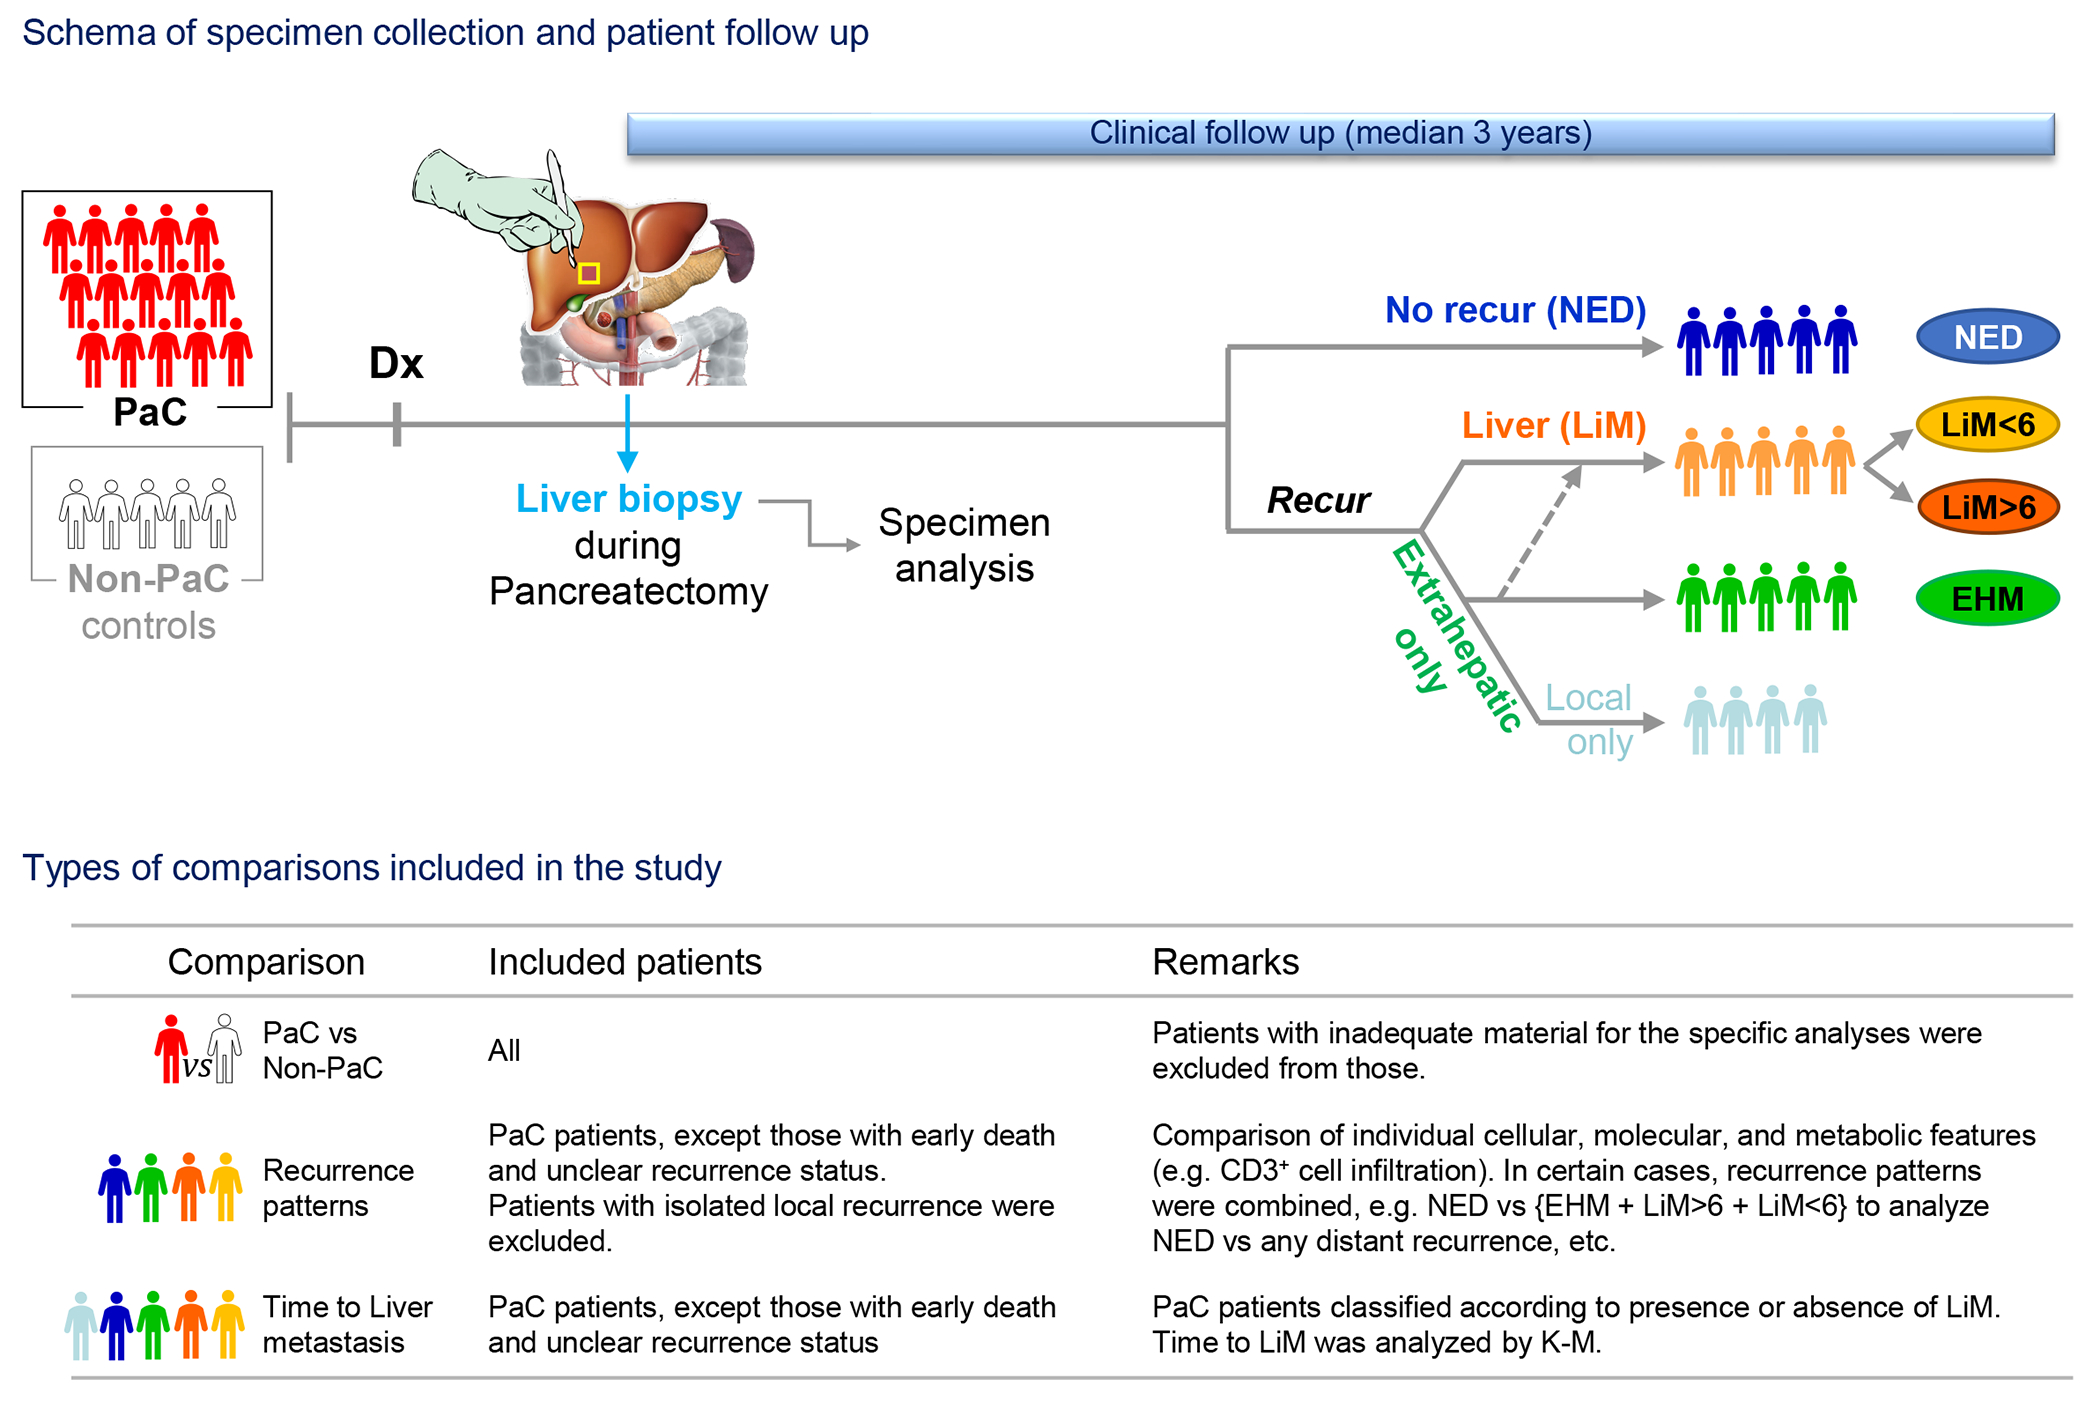
Patients with resectable pancreatic cancer (PaC; n=49) who underwent upfront resection were subjected to intraoperative liver biopsy following diagnosis (Dx). Specimens were analyzed postoperatively and patients were followed thereafter to assess for timing and pattern of recurrence (median follow-up: 36 months). Patients were classified into 4 recurrence groups: early (<6 months post resection) or late (>6 months post resection) liver metastasis (LiM), distant extrahepatic metastasis (EHM), and disease-free survivors (NED). Patients with isolated local recurrence (n=5) were classified separately and excluded from comparisons of individual recurrence groups, as described in the manuscript and summarized in the table above. Patients with benign or pre-malignant (peri-)pancreatic lesions undergoing pancreatectomy were recruited as controls and underwent similar specimen collection and analysis (Non-PaC; n=19). K-M, Kaplan-Meier.
Figure 2 |. Livers of patients with localized PaC exhibit molecular alterations with prognostic significance.
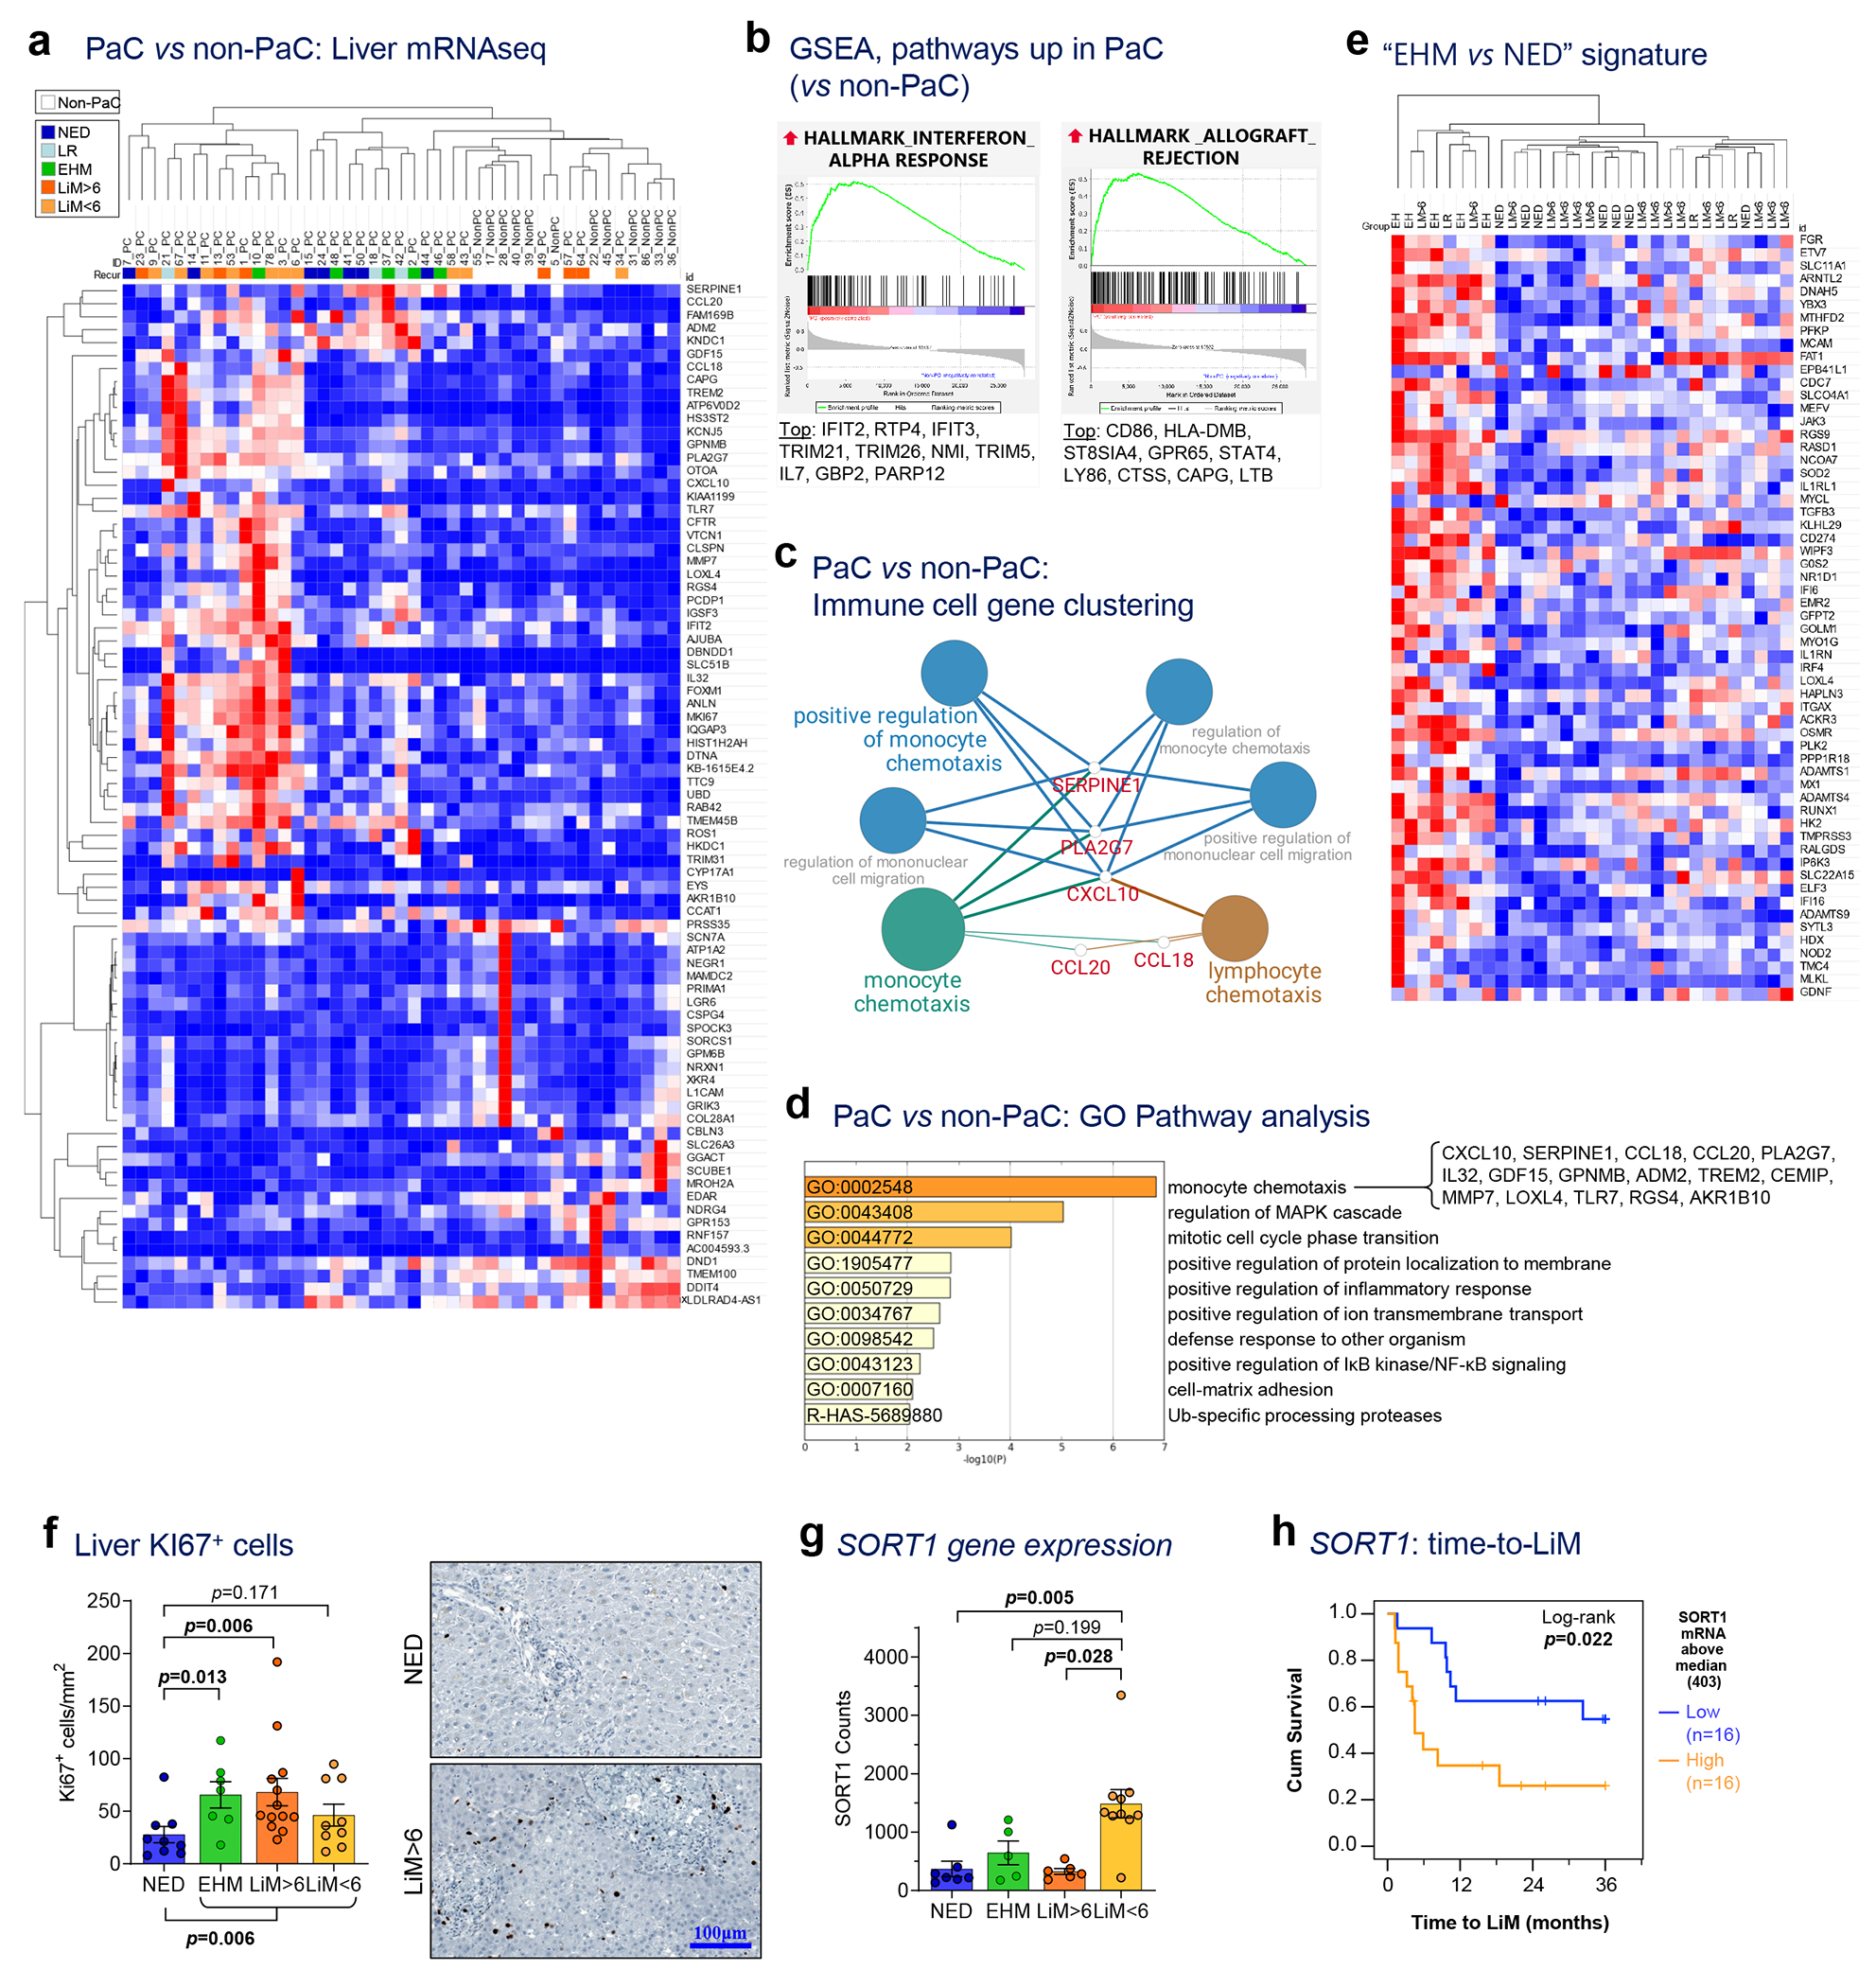
a, mRNA sequencing of liver tissue collected intraoperatively identified 79 genes differentially expressed between pancreatic cancer (PaC; n=31) and non-PaC patients (n=12; Wald test performed using the DESeq2 package with adjustment for multiple comparisons; genes shown were altered >2-fold, with adjusted p<0.1). PaC patients were classified into five mutually-exclusive recurrence groups: No evidence of disease (NED); isolated local recurrence (LR); extrahepatic metastasis (EHM); early liver metastasis (within 6 months, LiM<6); and late LiM (beyond 6 months, LiM>6). b, Enriched gene sets related to immune response in PaC livers by GSEA using the Hallmarks of Cancer reference gene set (MSigDB, H; pathways considered significant if p<0.05, FDR<0.25). The top 10 genes driving each gene set are listed, in descending order. c, Immune cell gene clustering and visualization of genes significantly upregulated in PaC livers by Cytoscape ClueGO. d, Pathway gene expression analysis of significantly upregulated genes by Metascape (cutoff p<0.1, after adjustment for multiple comparisons). e, Unsupervised clustering using the genes differentially expressed between EHM and NED patients and f, Confirmatory Ki-67 immunostaining showing upregulation in recurrence groups (n=38; Mean±SEM; Kruskal-Wallis ANOVA p=0.023, pair-wise testing with correction for multiple comparisons shown if p<0.25). g,h, SORT1 expression in recurrence groups, showing g, upregulation in LiM<6 (n=29; Mean±SEM; Kruskal-Wallis ANOVA p=0.002, pair-wise testing with correction for multiple comparisons shown if p<0.25); h, association with time to LiM (TTLiM) (n=32; log-rank test; p=0.022).
Intriguingly, patients with the most robust upregulation of immune-related genes (Fig. 2a) subsequently developed metastasis, in contrast to PaC patients without recurrence over follow up (NED), who displayed fewer differences in expression of these genes compared to non-PaC patients. In addition, the livers of PaC patients with distant recurrence at any site featured five significantly enriched gene sets, involving inteferon alpha response as well as potential proliferation and regeneration mechanisms (such as E2F signaling, spermatogenesis), compared to NED (Supplementary Table S4 and Suplementary_Tables_1.xlsx).
We hypothesized that, at the time of resection, livers of PaC patients would display features that either promoted or counteracted subsequent metastasis and correlate with metastatic outcome. Thus, we separated PaC patients with distant recurrence into LiM and EHM groups (Extended Data Table 1 and Fig. 1). While there were no significant differences in bulk liver gene expression between LiM and NED groups, comparison of EHM and NED groups identified 59 DEGs (Fig. 2e and Supplementary Table S5), with immune-related genes and pathways being the most highly enriched in the livers of the EHM group (Extended Data Fig. 1a and Supplementary Table S6).
These results suggested that EHM transcriptomic changes may reflect an anti-metastatic phenotype within the liver, as EHM patients seemed to be ‘resistant’ to LiM during follow-up despite developing metastatic disease elsewhere. We used the EHM gene signature (Supplementary Table S5) to perform unsupervised hierarchical clustering of all PaC patients and noted that a cohort of LiM patients clustered with the EHM patients (Fig. 2e), with recurrence at a time frame that was much longer than the median of LiMs (7 months post resection). Of the 23 patients who developed LiM as the first site of recurrence, there was a clear separation between the 10 patients who developed LiM early (<6 months) and the 13 patients who developed LiM later (>6 months) (Extended Data Fig. 1b and Extended Data Table 1). Indeed, as noted above, compared to NED, LiM>6 livers expressed several genes highly enriched in pathways involved in proliferation and liver regeneration (such as E2F targets, MYC targets, PI3K-AKT-MTOR, and G2M signaling) (Supplementary Table S7 and Suplementary_Tables_1.xlsx)6–8. These pathways were also enriched in EHM vs NED, although to a lesser extent compared to LiM>6 (Supplementary Table S6), therefore demonstrating partial overlap among EHM and LiM>6. Immunostaining for Ki-67 confirmed increased numbers of proliferating cells in EHM and LiM>6 livers (Fig. 2f). In contrast, patients with LiM<6 had no significant GSEA differences compared to NED, neither were they enriched for the EHM genes, suggesting lack of activation of ‘resistance gene programs’ in LiM<6 livers. Uniquely, expression of SORT1, which encodes for the lysosomal trafficking protein sortilin-1 and is implicated in hepatic cholesterol catabolism and regulation of cytokine secretion in myeloid cells, neutrophils, and T cells9,10, was significantly upregulated in LiM<6 compared to the other recurrence groups (Fig. 2g). Among PaC patients, high SORT1 expression was associated with shorter time to LiM, reflecting an approximately 3-fold increased risk of early LiM (HR 2.96 [95%CI 1.14-7.84]; p=0.029; Fig. 2h).
In summary, inflammatory and proliferative alterations detected at the molecular level distinguish the PaC pre-metastatic liver. Further, livers of PaC patients that “resist” metastatic colonization (e.g. EHM and LiM>6) are characterized by distinct transcriptional programs involving interferon signaling, monocyte chemotaxis, and proliferation, whereas patients with impending LiM (LiM<6) feature upregulation of SORT1.
Immune determinants of the hepatic pre-metastatic niche
While standard histopathological analyses of inflammation, fibrosis, or steatosis11 did not reveal any major differences between PaC and non-PaC livers (Extended Data Fig. 2), we examined individual immune cell types to evaluate their roles in evolution of the hepatic pre-metastatic niche. We previously showed that PaC-derived exosomes are taken up by hepatic Kupffer cells and contribute to the recruitment of bone marrow-derived cells (BMDCs) to promote LiM12. Thus, we stained liver tissue with the myeloid/BMDC marker CD11B, the macrophage marker CD68, and the myeloid activation marker IBA-1. Consistently, PaC patients had significantly higher numbers of liver-infiltrating CD11B+ cells compared to non-PaC patients (Fig. 3a).
Figure 3 |. Pre-metastatic livers of PaC patients feature changes in infiltrating immune cells.
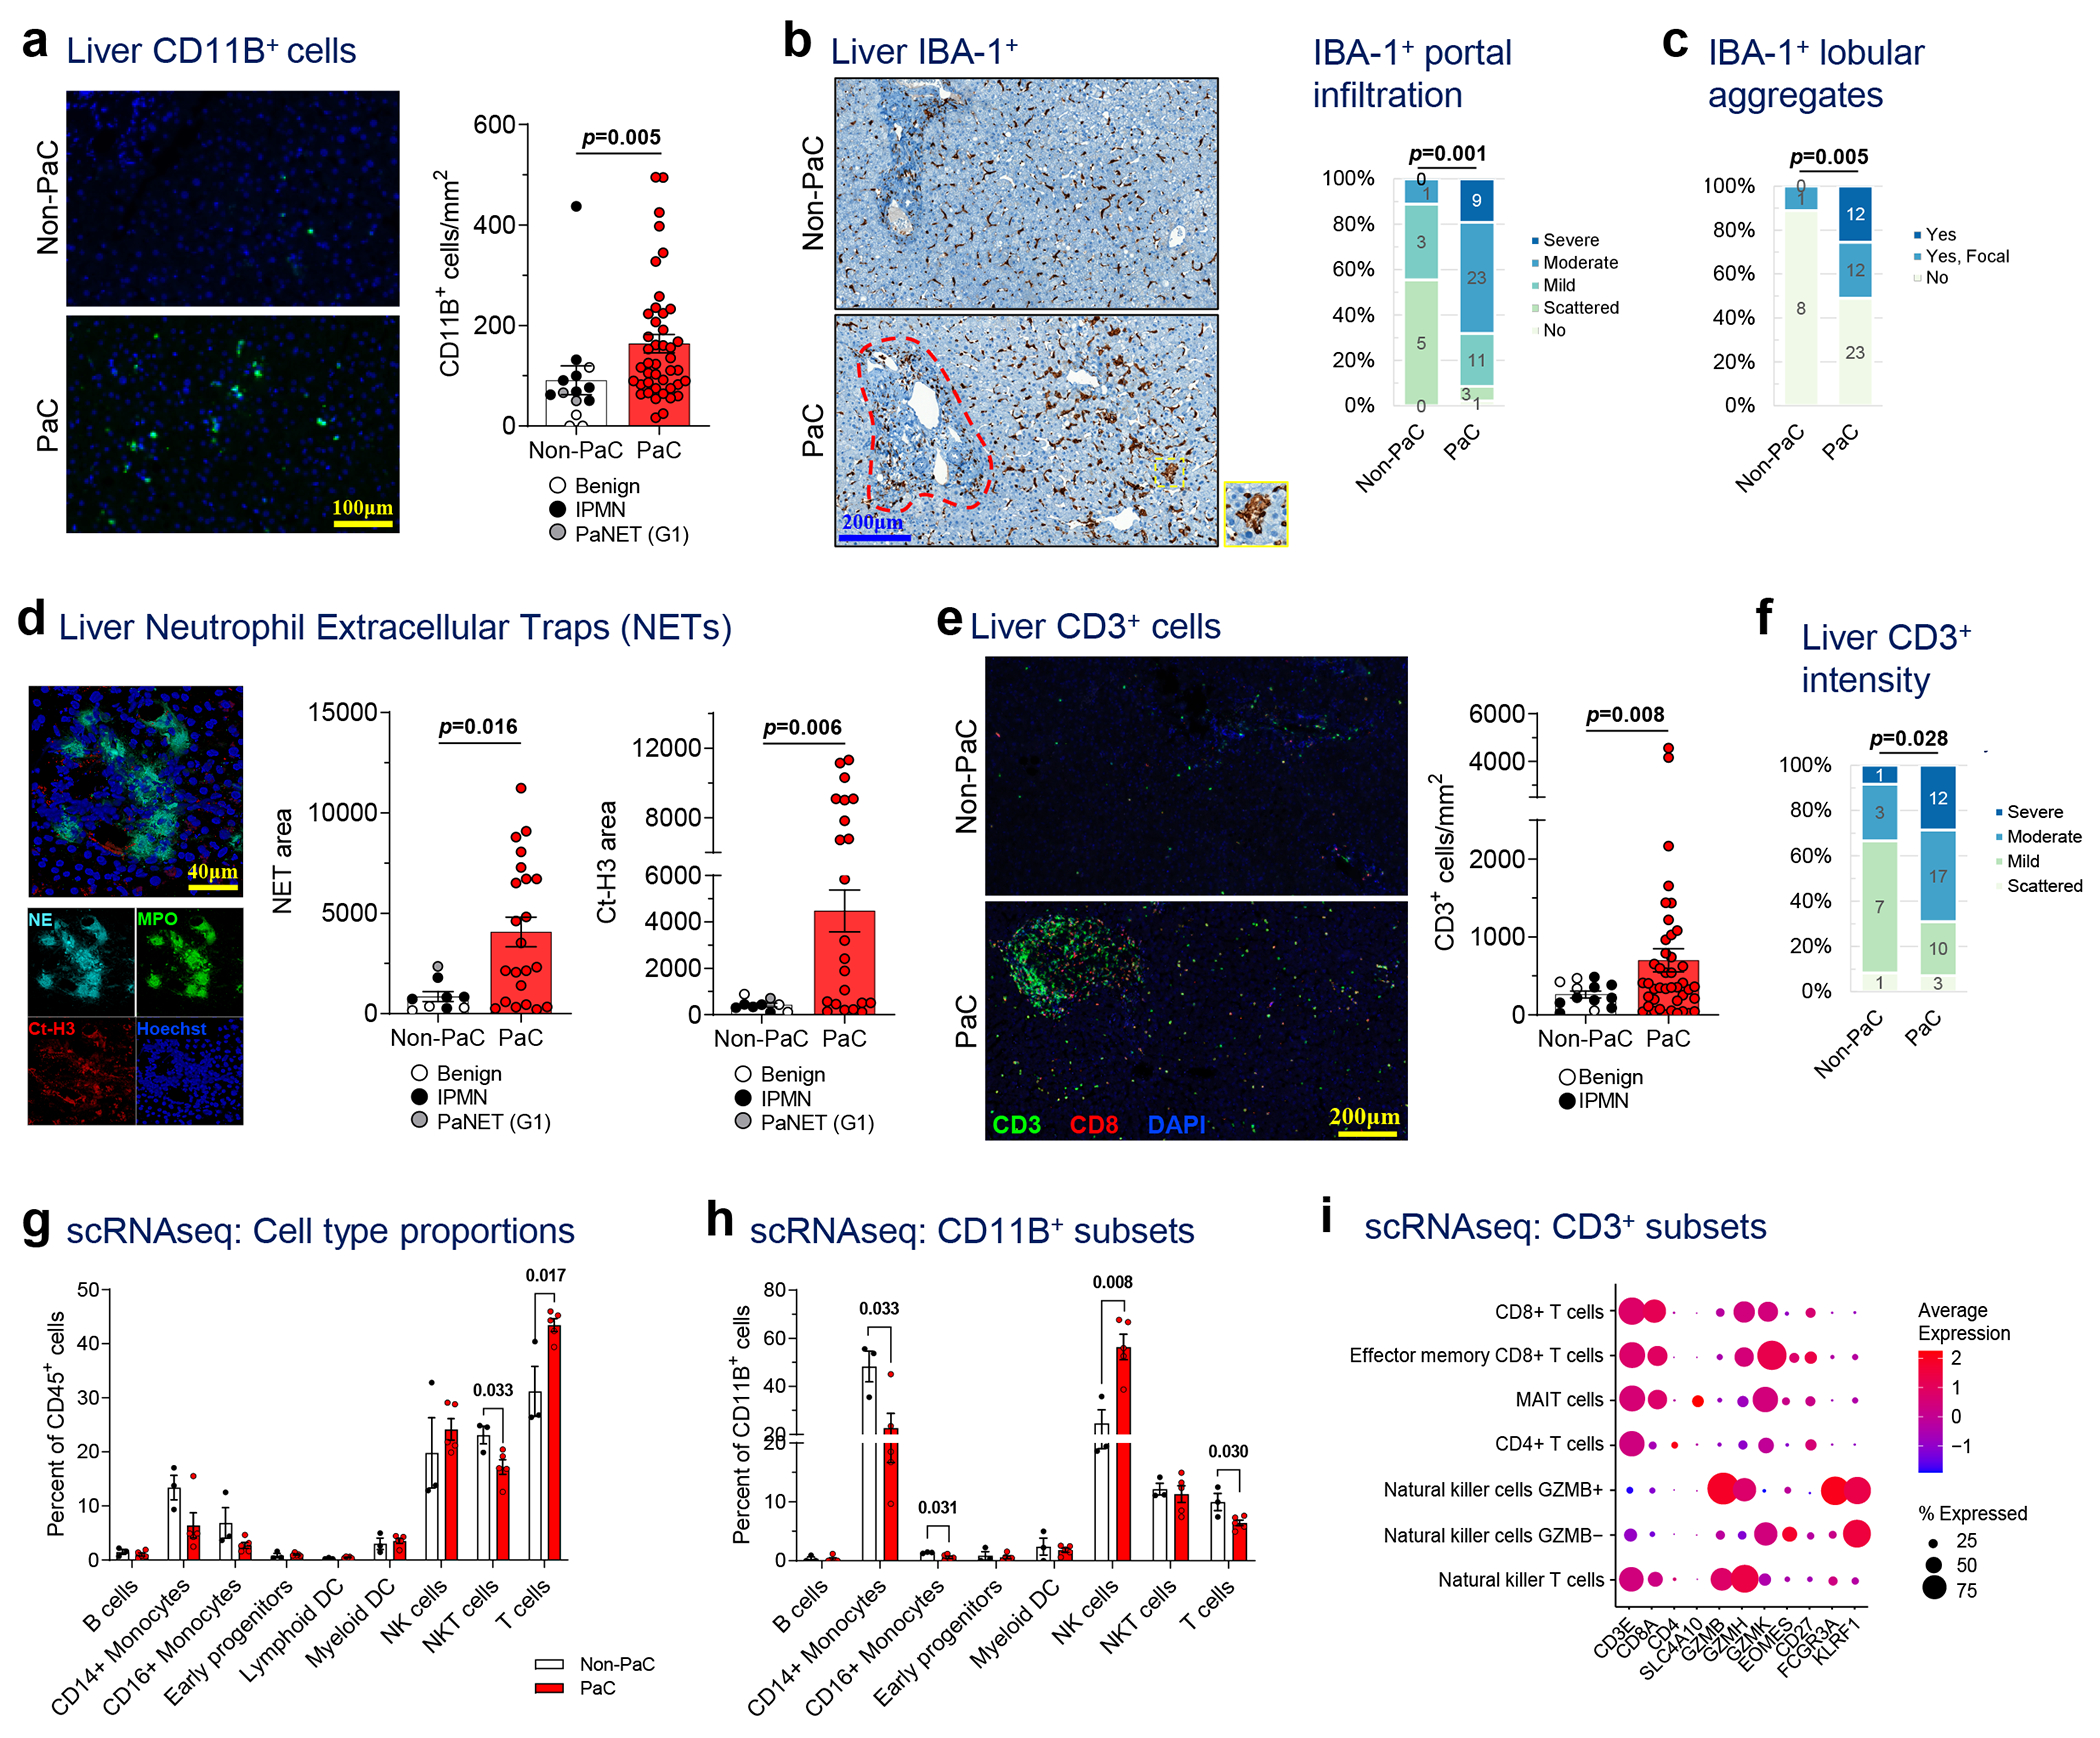
a, Liver biopsies were stained by immunofluorescence (IF) for the myeloid marker CD11B, quantified with ImageJ, and compared between PaC (n=44) and Non-PaC (n=14; Mann-Whitney U-test; p=0.005). b-c, Liver biopsies were stained by immunohistochemistry (IHC) for the macrophage activation marker IBA-1 and compared between PaC (n=47) and Non-PaC (n=9) after manual quantification by a blinded pathologist of b, the extent of IBA-1+ cell infiltration in the portal tracts (red outline; Somers’ d; p=0.001), and c, the presence of IBA-1+ cell aggregates (yellow outline) in the lobular portions of the liver parenchyma (Somers’ d; p=0.005). d, Liver biopsies were stained for neutrophil elastase (NE) and citrullinated H3 (Ct-H3) to identify clusters consistent with neutrophil extracellular traps (NETs). Stained area was quantified with ImageJ and compared between PaC (n=22) and non-PaC (n=9; Mann-Whitney U-test: NE area, p=0.016); CtH3 area, p=0.006). e-f, Liver biopsies were co-stained by IF for CD3 and CD8. e, CD3+ T cells were quantified using ImageJ and compared between PaC (n=42) and Non-PaC (n=13; t-test; p=0.008). f, A blinded pathologist quantified the intensity of CD3+ lymphocyte staining, (Somers’ d; p=0.028). g-i, Single-cell RNAseq was performed on hepatic NPCs (>90% CD45+) from 3 non-PaC and 5 PaC patients and analyzed as shown in Ext. Data Fig. 4–5. g, Comparison of the relative abundance of the major cell clusters between PaC and Non-PaC (multiple t-tests with correction for multiple comparisons, shown if p<0.25). g, The percentage of different cell clusters among CD11B+ cells was calculated and compared between PaC and non-PaC (multiple t-tests with correction for multiple comparisons, shown if p<0.25). h, Subset analysis of CD3+ cells (Ext. Data Figure 4) resulted in four T cell subclusters as well as NKT cells and two NK cell cluster (MAIT, mucosa-associated invariant T cells). i, Subset analysis of CD3+ cells resulted in four T cell subclusters as well as NKT cells and two NK cell clusters (MAIT, mucosa-associated invariant T cells). Mean±SEM are shown in bar graphs.
Although we did not observe differences in the total numbers of CD68+ or IBA-1+ macrophages (Extended Data Fig. 3a,b) between PaC and non-PaC livers, blinded examination by a pathologist observed altered spatial organization with moderate or strong IBA-1+ staining in portal tracts in 68% of PaC patients, compared to only 11% of non-PaC patients (p=0.001, Fig. 3b). Additionally, nearly 40% of PaC patients had either focal or diffuse aggregates of IBA-1+ cells in the liver parenchyma, outside the portal areas, versus only 11% of patients in the non-PaC group exhibiting only focal aggregates (p=0.005, Fig. 3c).
Interestingly, co-staining of these three myeloid markers showed a great degree of overlap of CD68 and IBA-1 but <25% overlap of these markers with CD11B (Extended Data Fig. 3c), suggesting that other cells contribute to the liver-infiltrating CD11B+ cell pool. We thus expanded our analysis to neutrophils, which have been shown to contribute to LiM in animal models13,14. We found prominent clusters of neutrophils, which formed NETs, represented by neutrophil elastase and citrullinated histone H3 positivity (Ct-H3, p=0.016 and p=0.006, respectively; Fig. 3d) in PaC versus non-PaC livers. Furthermore, we examined putative anti-tumor effector cells and observed significantly higher numbers of CD3+ lymphocytes in pre-metastatic livers of PaC compared to non-PaC patients (p=0.008; Fig. 3e) and confirmed by semiquantitative scoring by a blinded pathologist (p=0.028; Fig. 3f). Sub-analysis of CD3+ lymphocyte subsets did not reveal significant differences in CD8+ or CD8− cells between PaC and non-PaC (Extended Data Fig. 3d–f).
Dysfunctional immune effector cells in pre-metastatic livers
To further characterize the immune infiltrates of pre-metastatic livers, we performed single-cell RNA sequencing (scRNAseq) on hepatic immune cells isolated from 3 non-PaC and 5 PaC patients (Supplementary Table S8 and Extended Data Fig. 4). Driver and marker genes for each cluster (Extended Data Fig. 4b,c) were concordant with prior scRNAseq studies15,16. Our analysis demonstrated higher proportions of T cells in PaC livers (p=0.016; Fig. 3g), consistent with the aforementioned immunostaining data (Fig. 3e–f). The NKT cell fraction (which may also include other innate lymphocytes) was significantly decreased in the PaC group (p=0.033). Notably, PaC intrahepatic T cells had altered expression patterns of activation/exhaustion genes, such as upregulation of the costimulatory molecules CD27 and CD97 and the co-inhibitory receptor KLRG1, and downregulation of effector genes, such as IFNG and GNLY (Supplementary Table S9), similar to a previous report on hepatocellular carcinoma-infiltrating T cells15. Further, PaC T cells had upregulated CXCR4, which has been associated with exclusion from tumor entry17, and downregulated XCL1 and XCL2, which are involved in cross-activation of DCs18,19.
ITGAM/CD11B, the immune cell marker most strikingly enriched in PaC livers by immunostaining (Fig. 3a), was predominantly expressed in the myeloid subpopulation as well as in the NK cell cluster, with little overlap with the macrophage marker CD68 (Extended Data Fig. 4d). Conversely, NK cells were significantly enriched within CD11B+ cells in PaC livers (p=0.008; Fig. 3h), whereas CD14+ and CD16+ monocytes were decreased. CD11B+ NK cells in PaC livers had increased expression of genes involved in NK cell cytotoxicity and interaction with non-lymphoid cell types via killer cell lectin-like receptors, such as GZMB, PRF1 and KLRD1, compared to non-PaC livers (Extended Data Fig. 5a–b). However, PaC livers exhibited decreased expression of IFNG and TNF, suggesting an impaired ability to recruit and activate T cells20,21.
To understand the composition of the CD3+ population, we performed subset analysis of scRNAseq exclusively on CD3-expressing cells22 (Fig. 3i and Extended Data Fig. 5c–e). Despite a trend for increase in mucosa-associated invariant T cells (MAIT) among PaC patients (p=0.109), relative abundances of T cell subsets and NKT cells were not significantly altered (Extended Data Fig. 5e). Using the CIBERSORT methodology23, we deconvoluted the bulk liver tissue transcriptomic data in the larger patient cohort and confirmed the increase in activated NK cells in PaC both with the original CIBERSORT cell signatures (Extended Data Fig. 5f) as well as with our T/NKT cell signature (Extended Data Fig. 5g).
We further confirmed the abundance and spatial distribution of hepatic CD3+ cells by analyzing CD4+, CD8+, NKT/γδT (NKG2A, TCRγδ) and regulatory T (Treg; FOXP3+) cells using imaging mass cytometry (Extended Data Fig. 6). While an increase in CD3+ cells was confirmed, the cellular distribution or individual cell types did not reach statistical significance in this sub-cohort, although a trend for increased total CD8+ and CD4+ cells in PaC recapitulated our immunofluorescence data (Fig. 3e,f and Extended Data Fig. 3d–f).
Taken together, these data indicate the presence of a unique immune-cell landscape in the liver pre-metastatic niche.
Hepatic immune cells predict distinct recurrence patterns
Next, we assessed the impact of various immune cell features on PaC recurrence patterns (Fig. 4, Extended Data Fig. 7). Consistent with our gene expression analysis showing augmented inflammation in patients who developed metastases, significant portal inflammation was observed in patients with subsequent distant metastasis, compared to the NED group (p=0.031; Fig. 4a). Both portal and lobular inflammation were most intense in the EHM group, followed by the LiM>6 group (Fig. 4a, Extended Data Fig. 7a). Strikingly, analysis of neutrophils in the metastatic subgroups showed notably increased NETs in LiM<6 compared to the other recurrence groups (p<0.001; Fig. 4b). Despite a lower overall level of other inflammatory readouts, increased NETs may play an immunosuppressive role, as shown in preclinical studies24. No other differences in myeloid cells, compared by CD11B+, IBA1+ and CD68+ cell density, were observed (Extended Data Fig. 7b–e). The hepatic parenchymal distribution of CD3+ lymphocytes was significantly different between patients with and without LiM (p=0.016, Fig. 4c), whereas no significant differences in absolute counts of CD3+ and CD8+ lymphocytes were noted (Extended Data Fig. 7f–h). Notably, the EHM group had mostly widespread lobular infiltration, whereas the LiM<6 group had predominantly scattered to few lobular CD3+ lymphocytes.
Figure 4 |. Alterations in pre-metastatic liver-infiltrating immune cells correlate with patterns and timing of metastasis.
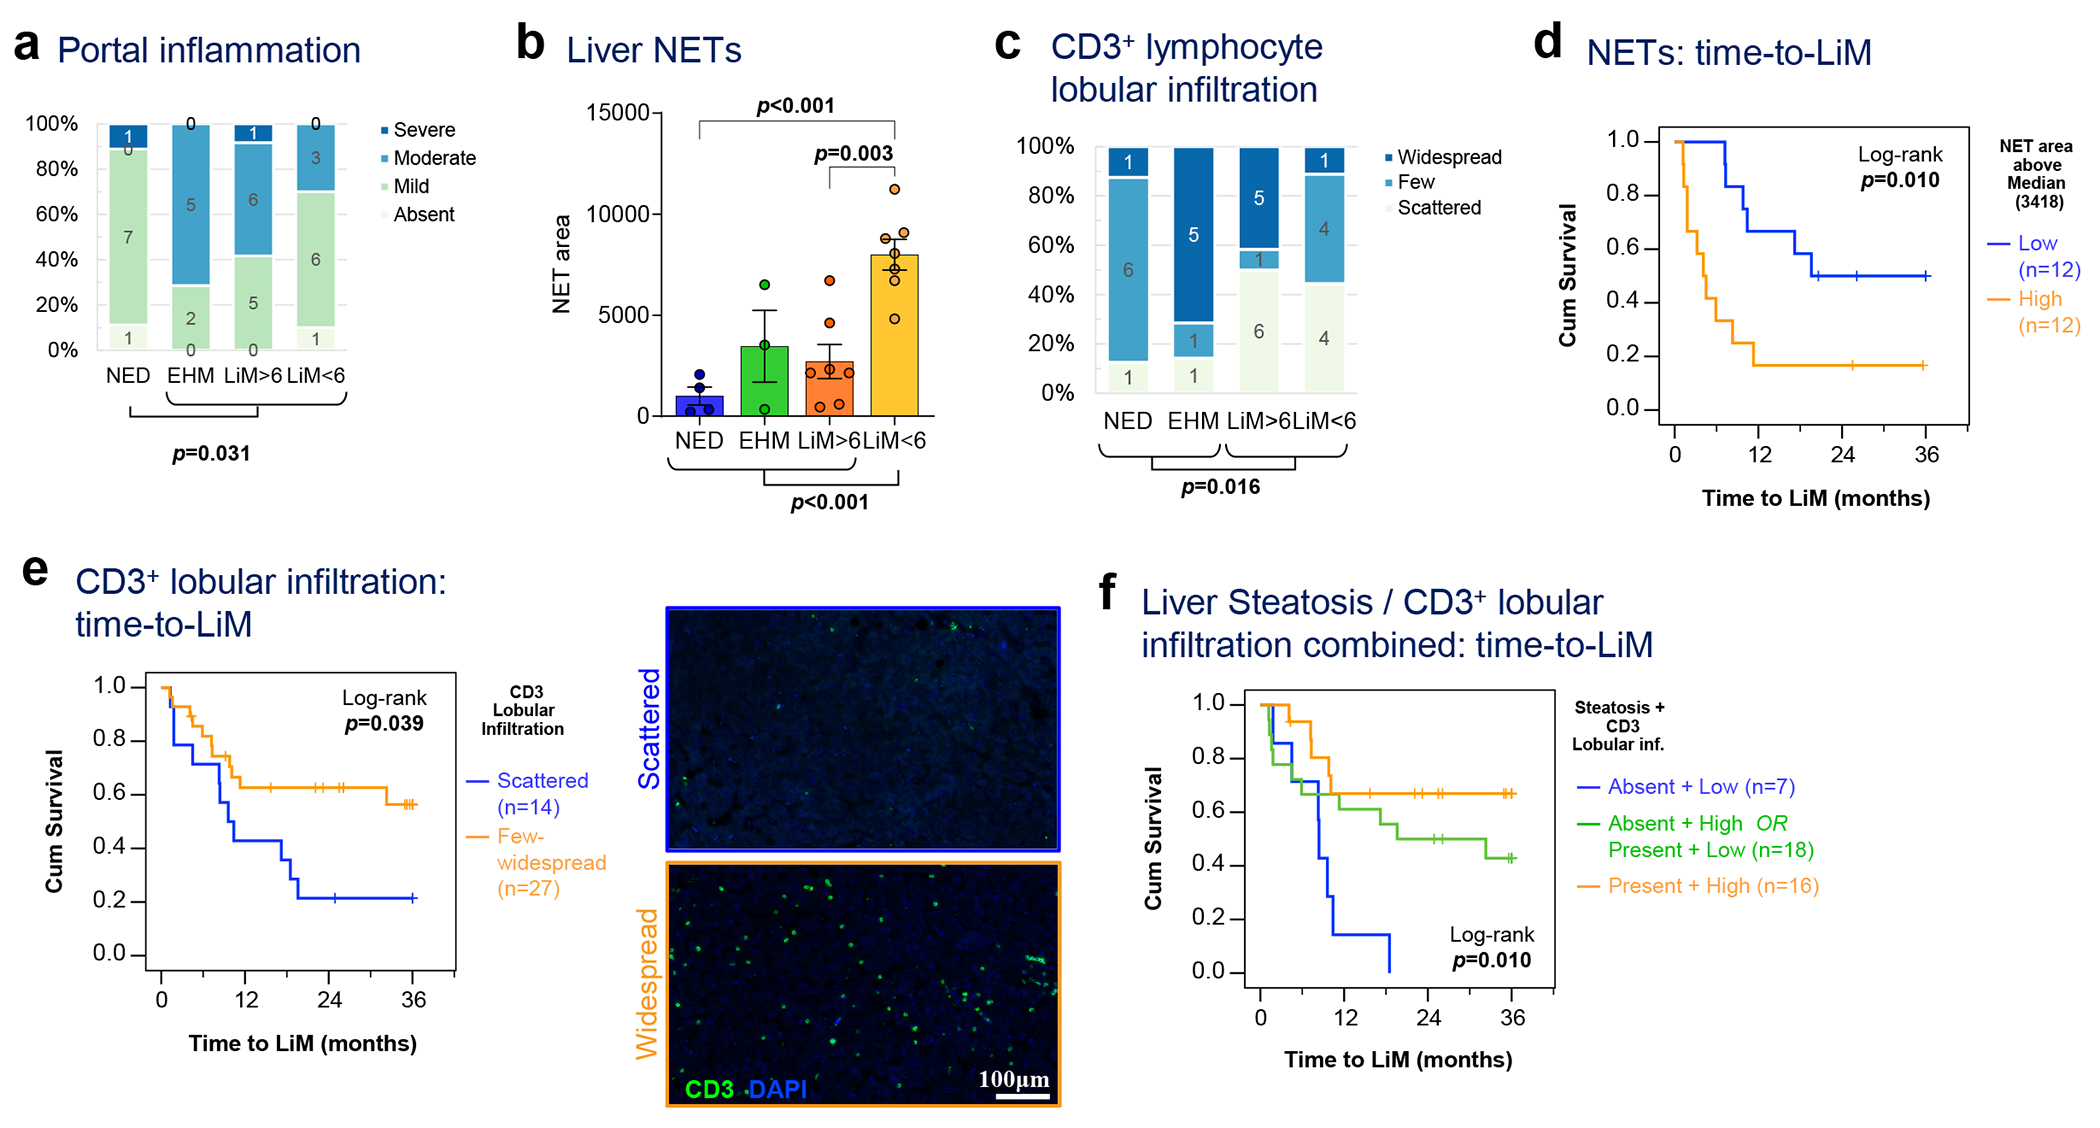
a, Liver biopsies obtained at the time of resection from patients with NED, or distant recurrence (EHM, LiM>6, or LiM<6) were manually scored by a blinded pathologist for portal inflammation (Kruskal-Wallis test). b, NET area quantified as in Fig. 3d was compared among the different recurrence groups (n=21; Mean±SEM; ANOVA p=0.001; multiple t-tests with correction for multiple comparisons shown if p<0.25). c, Liver CD3+ lymphocyte lobular infiltration was manually scored by a blinded pathologist and compared among the different recurrence groups as well as between LiM and no LiM (Kruskal-Wallis test; p=0.016). d, Kaplan-Meier curve of time to LiM for high versus low NET area, as quantified in (b) (n=24; log-rank test; p=0.010). e, Kaplan-Meier curve of time to LiM for scattered versus few/widespread lobular CD3+ lymphocyte lobular infiltration, as scored in (c), with representative examples shown in side panels (log-rank test; p=0.039). f, Steatosis (absence vs presence) and CD3+ lymphocyte lobular infiltration (as in c) were used to classify PaC patients in 3 subgroups, and time to LiM was compared among them (n=42; log-rank test; p=0.010).
These observations suggest that the exact composition of the enhanced immune infiltrate in PaC pre-metastatic livers may be a critical determinant of the metastatic outcome. Notably, our data indicate that high NET burden and low CD3+/CD8+ lymphocyte lobular infiltration could have important prognostic value in estimating the risk of metastasis, and in particular early LiM, which is further corroborated by the association of these immune cell alterations with shorter time to LiM (p=0.025 and p=0.039 [log-rank], respectively; Fig. 4d–e).
Further, we hypothesized that the metabolic status of the liver could influence immune infiltration and serve as another predictor of recurrence patterns. Histologically graded steatosis (Extended Data Fig. 2) was significantly more prominent in patients with recurrence outside the liver, compared to LiM (p=0.034; (Extended Data Fig. 8a). Although presence of steatosis did not significantly correlate with time to LiM (Extended Data Fig. 8b), an important interaction with lobular CD3+ cell infiltration was observed (Fig. 4f). Specifically, patients with steatosis and prominent CD3+ lobular infiltration had a significantly lower incidence of LiM, whereas absence of steatosis and concurrent lack of CD3+ lobular infiltration distinguished a subgroup of patients all of whom developed LiM within 1.5 year (p=0.010; Fig. 4f). In conclusion, hepatic steatosis, together with prominent CD3+ lobular infiltration represents an immunometabolic phenotype potentially counteracting LiM.
Metabolic reprogramming in pre-metastatic livers predicts LiM
To specifically assess metabolic changes within the liver pre-metastatic niche, we performed metabolomic profiling of liver biopsies. Remarkably, PaC livers had significantly decreased creatine and creatinine levels compared to non-PaC livers (p<0.005, Fig. 5a and Extended Data Fig. 8c–d). The observed metabolic changes were likely restricted to the liver as preoperative serum creatinine levels did not differ between the two groups (Extended Data Fig. 8e). We also observed significantly enriched arginine and proline metabolism in PaC compared to non-PaC livers (>8-fold, p<0.05; Fig. 5b and Extended Data Fig. 8c–d). Levels of carbamoyl-phosphate, a precursor of citrulline, were significantly higher in PaC (p=0.013), suggesting a potential diversion of the pathway toward augmented utilization of citrulline (Fig. 5c). In support of this finding, citrullinated H3 (Ct-H3) correlated inversely with hepatic creatine levels (Spearman’s r=−0.6, p=0.031; Fig. 5d).
Figure 5 |. Metabolic features of the pre-metastatic liver correlate with patterns of recurrence in PaC.
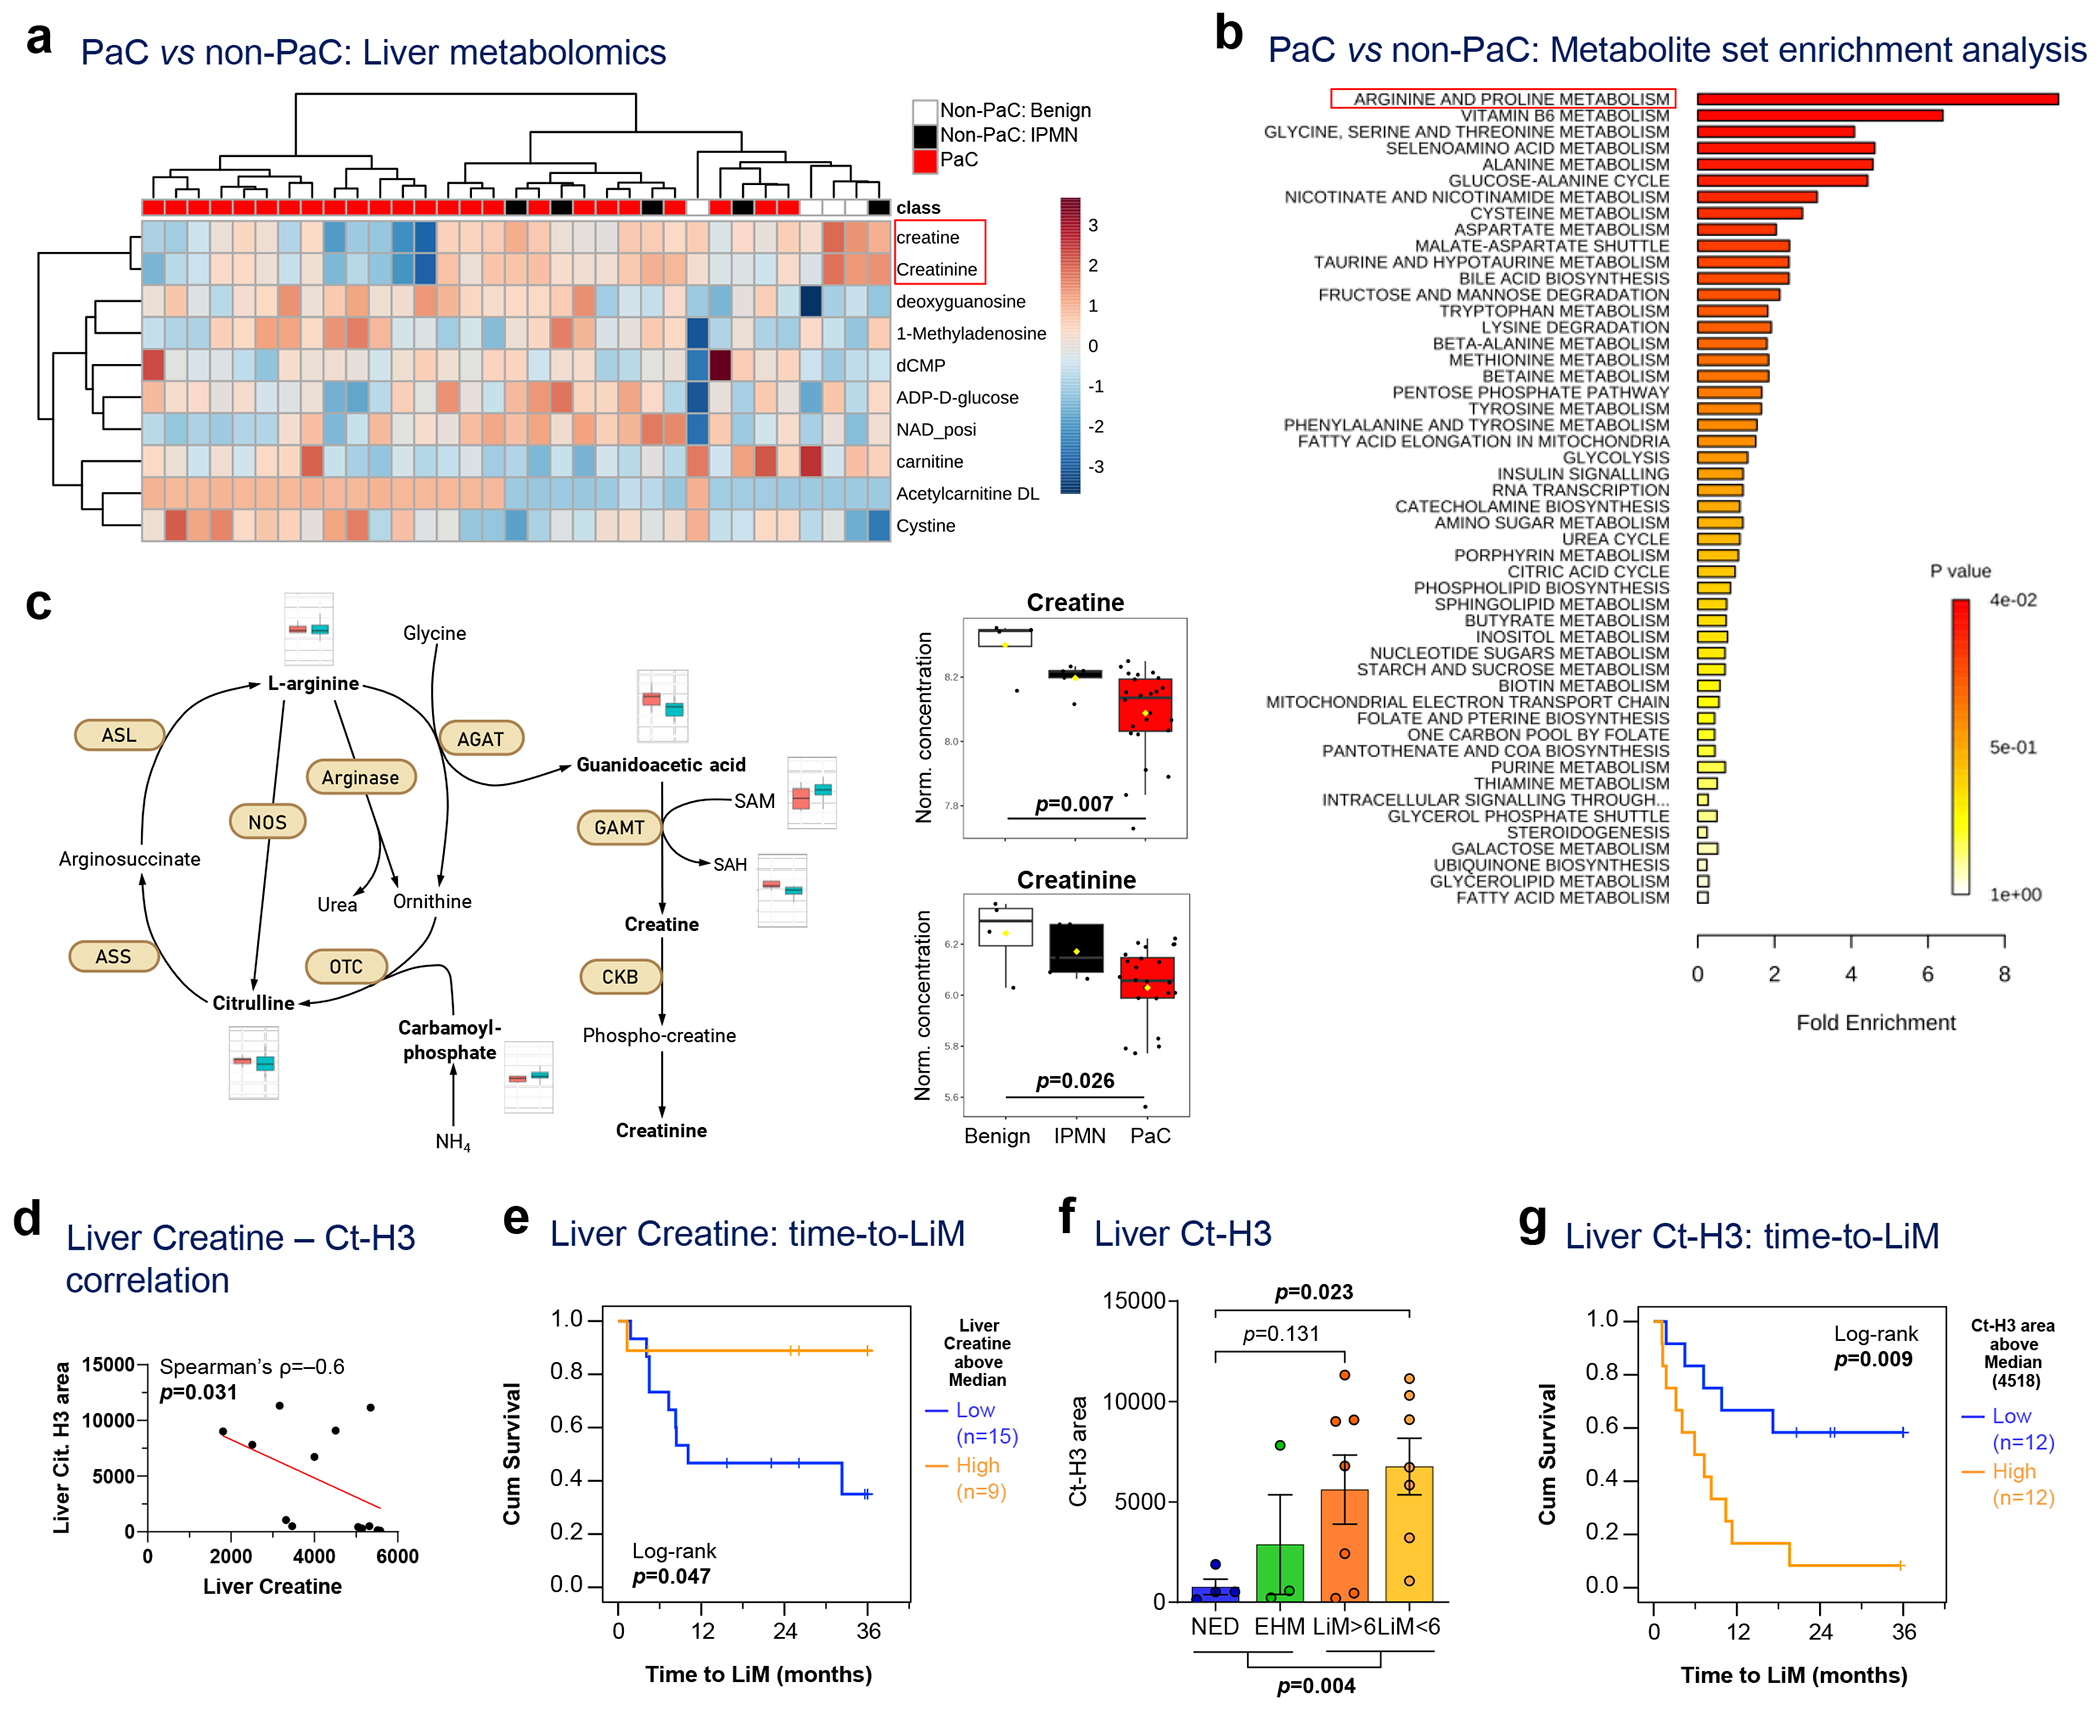
a-c, Metabolomic analysis of liver biopsies in 24 PaC vs 9 Non-PaC patients revealed: a, creatine and creatinine to be most prominently differentially expressed using supervised clustering (p<0.001, FDR<0.15 and p<0.005, FDR<0.2, respectively); and b, enriched arginine and proline metabolism in PaC livers by metabolite set enrichment analysis (MSEA) using Metaboanalyst. c, Schematic showing the metabolism of arginine, citrulline, creatine, and creatinine, with the levels of metabolites compared between PaC (teal bars) and non-PaC (light red bars). The levels of hepatic creatine and creatinine were compared between PaC (n=24) and Non-PaC (n=9 [4 benign, 5 IPMN]; box plots represent Median±IQR, with whiskers at 95th percentiles; ANOVA p=0.007 and p=0.026, respectively). d, Negative correlation between liver creatine measured in metabolomic analysis and citrullinated H3 quantified in Fig.2e (Ct-H3; ρ=−0.6, p=0.031). e, Kaplan-Meier curve of time to LiM for patients with high vs low creatine levels (based on median; n=24; log-rank p=0.047). f-g, Total liver citrullinated H3 f, differed among recurrence groups (n=21; Mean±SEM; ANOVA p=0.023; multiple t-tests with correction for multiple comparisons shown if p<0.25) and g, associated with shorter time to LiM by Kaplan-Meier analysis (n=24; log-rank p=0.009).
According to hierarchical clustering analysis, a panel of 15 metabolites distinguished most of the patients who subsequently developed LiM, from the EHM and NED patients (Extended Data Fig. 8f). Consistently, low hepatic creatine levels were associated with shorter time to LiM (p=0.047; Fig. 5e) and were lowest in patients with LiM>6 (Extended Data Fig. 8g). Further, patients who eventually developed LiM had significantly higher Ct-H3 immunostaining that was not limited to immune cells (p=0.004; Fig. 5f), with high Ct-H3 correlating with earlier LiM (log-rank p=0.009; Fig. 5g). Taken together, arginine metabolism and urea cycle are dysregulated in pre-metastatic livers, and specific metabolites including creatine and Ct-H3 show promise as prognostic indicators in predicting LiM in PaC patients.
Machine-learning predictive modeling for metastatic patterns
We hypothesized that combining pre-metastatic liver-specific signatures could more accurately inform the risk for LiM in PaC. We employed the aforementioned individually significant histopathological (Fig. 3–4) and metabolomic variables (Fig. 5), as well as SORT1 and the defining genes of the EHM transcriptomic signature (Fig. 2) , and used a machine learning-based approach (MLA) to create a predictive model for metastatic outcome. BMI and biliary obstruction were included as variables since these could influence or confound cellular and molecular features of the liver but did not contribute to the final models (Supplementary Table S10). We generated four separate models that predicted the different metastatic outcomes in a binary fashion: LiM, early LiM (LiM<6), EHM, and NED (Fig. 6a). The four models performed well, with areas under the receiver operating characteristics curves (AUCs) of 0.83-0.89. The early LiM model, which included three features (SORT1, NR1D1 and NET area), had the best performance, with 90% sensitivity, 87% specificity, and an AUC of 0.87.
Figure 6 |. Features of the PMN can be used for prediction of future metastasis.
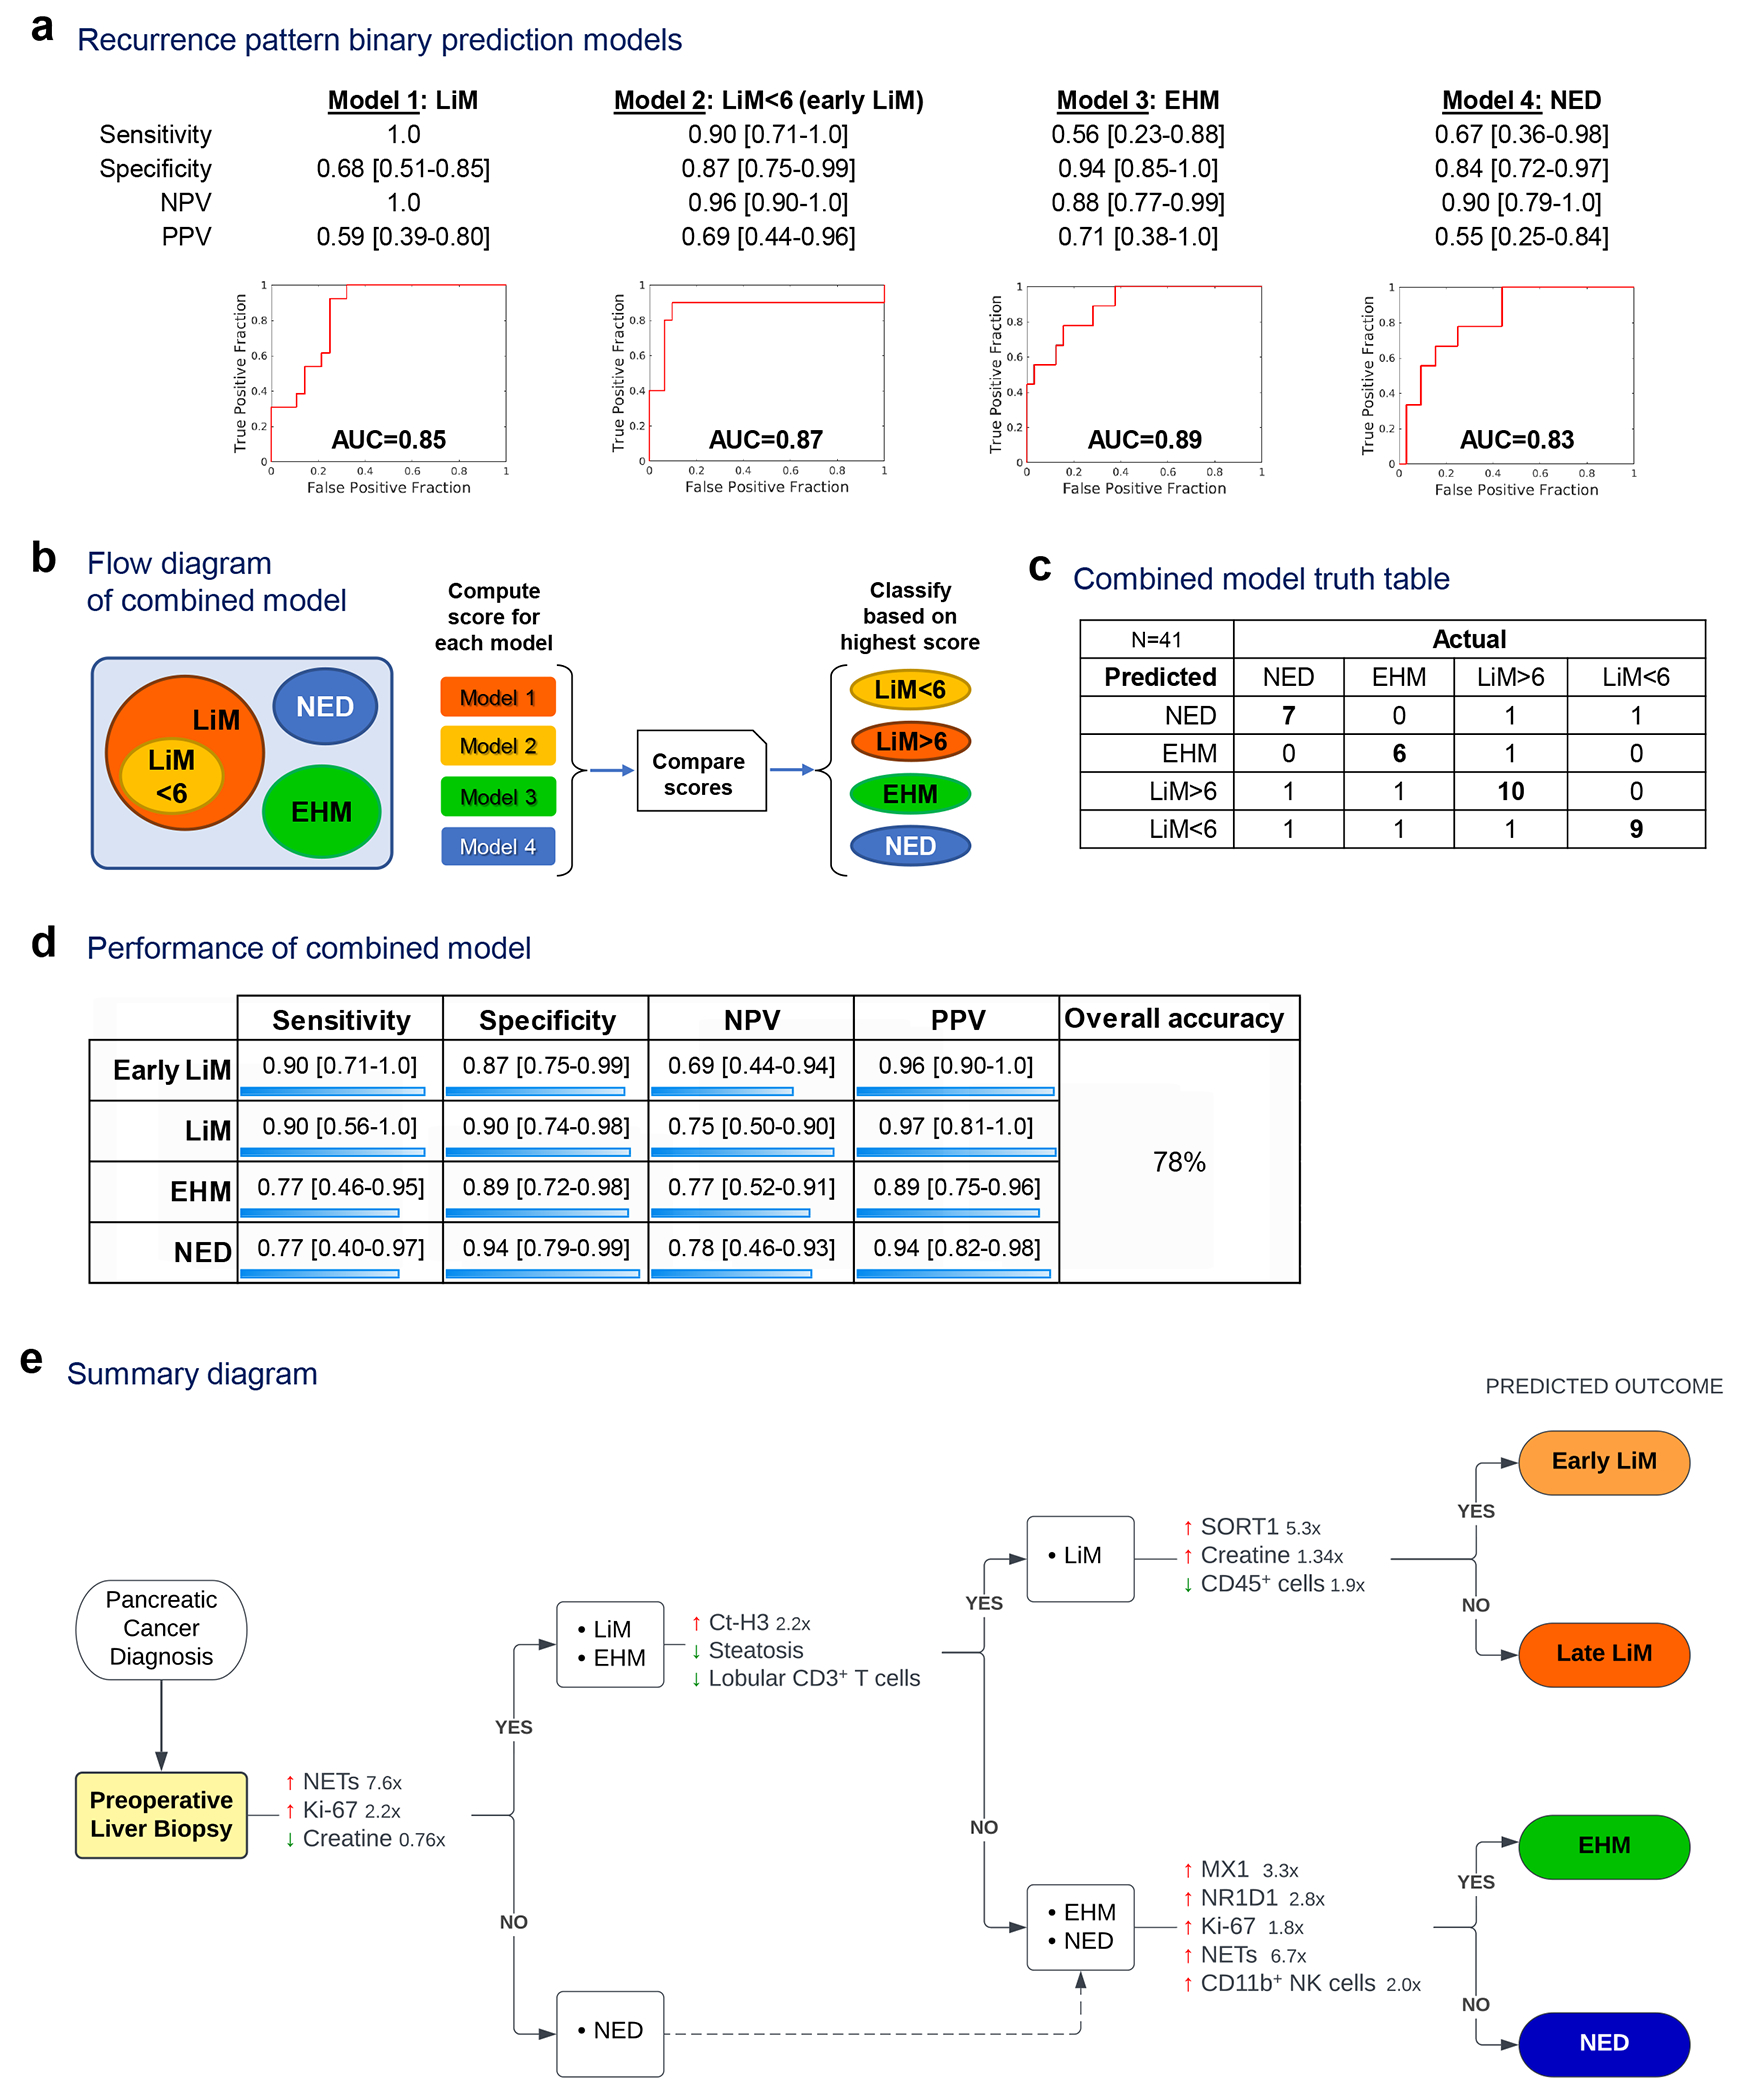
Pre-metastatic liver-specific variables were combined in prediction models to classify patients into recurrence patterns. a, Performance of four prediction models generated using Leave-one-out with 10-fold cross-validation. b-c, The four prediction models were run concurrently (b) and their output was used to classify patients into recurrence pattern groups (c). d, Performance of the combined model. e, Summary diagram outlining stepwise comparisons of metastatic patterns, with the characteristic molecular, cellular and metabolic features favoring each pattern (fold-change is shown for continuous variables). AUC: area under the receiver operating characteristic curve.
We combined the predicted outcomes to classify patients into the recurrence patterns of interest (Fig. 6b). Patients were assigned to the metastatic group of the model that gave the highest risk score (Fig. 6c and Supplementary Table S11). The combined model performed well for identification of early LiM, with 90% accuracy (Fig. 6d). Of the 10 patients who developed early LiM, nine were classified correctly. Conversely, 9 out of 12 patients predicted to develop early LiM were correctly classified. The overall accuracy of the combined model in assigning patients to specific recurrence groups was 78%.
In summary, our findings demonstrate the potential to predict PaC recurrence patterns via immunometabolic characterization of perioperative liver biopsies (summarized in Fig. 6e), and are particulary accurate in predicting early LiM.
Discussion
PaC is one of the most challenging malignancies due to its protracted subclinical course and early LiM, which almost universally results in a fatal outcome. We reported previously that only 34% of resected PaC patients remain alive one year after diagnosis of LiM2. Thus, reliable strategies for identification of patients at high risk of distant recurrence in the preoperative setting are urgently needed. Our multi-omics approach that comprehensively characterizes the liver pre-metastatic niche in PaC patients, demonstrates potential for such prognostic implementation.
Based on pre-clinical studies12–14,25,26, we hypothesized that metastatic sites, particularly the liver, exhibit detectable microenvironmental changes before clinical evidence of metastasis. Alterations in resident cell phenotypes, extracellular matrix (ECM), and immune cell infiltration collectively create a pre-metastatic niche27,28. Using transcriptomics, metabolomics and histopathology, we observed that pre-metastatic livers of PaC patients indeed displayed a prominent inflammatory response with augmented myeloid and lymphoid cell subsets, at the time of resection. At the mRNA level, the inflammatory signature was prominent in PaC patients who primarily developed EHM and secondarily late LiM, as compared to long-term survivors. This suggests that the EHM-specific transcriptomic signature may represent a defensive anti-tumor immune response within the liver.
Although PaC livers had increased CD11B+ cell infiltration and a higher number of activated NK cells compared to non-PaC livers, the levels of intrahepatic CD11B+ cells did not differ significantly among PaC patients with varying metastatic patterns. By contrast, CD3+ lymphocyte infiltration was elevated in PaC livers, especially in patients who remained free of LiM during follow-up. Analysis of these enriched CD3+ lymphocytes by single cell RNA sequencing and imaging mass cytometry did not identify any specific expanded subset, though the strongest trends were observed for CD8+ lymphocytes. Furthermore, lobular infiltration of CD3+ lymphocytes correlated inversely with time to LiM and thus may have prognostic significance. These observations suggest that myeloid cell infiltration in the liver is an early event during PaC metastasis and a hallmark of the liver pre-metastatic niche, whereas T cell infiltration later in PaC progression may reflect anti-tumor activity. Thus, patients who fail to mount an intrahepatic T cell immune response are more likely to develop subsequent LiM. These findings are consistent with a report by Pommier and colleagues, who found that isolated, disseminated PaC cells in mice were kept in check by infiltrating T cells, whereas T cell depletion combined with disseminated tumor cell endoplasmic reticulum stress enabled the development of macro-metastases29.
We also observed an increased neutrophil infiltration and NET formation in PaC livers that developed LiM, particularly those that developed LiM within 6 months post-resection. Pre-clinical studies have linked neutrophils and NETs to pre-metastatic niche formation and promotion of metastasis, potentially through inhibition of cytotoxic T cells as well as release of ECM-degrading enzymes that facilitate tumor cell migration and adhesion13,14. The precise role of NETs in hepatic metastasis remains to be determined.
In addition, we found several metabolic alterations in the liver of PaC patients. We observed that patients with subsequent LiM had less microscopic evidence of hepatic steatosis at the time of resection. Previous studies suggested immunomodulatory roles of cholesterol and fatty acid metabolites, which may account for these observations30. For example, it was previously shown that lipid-rich hepatic dendritic cells are more immunogenic and can promote lymphocyte-mediated anti-tumor immune responses, whereas lipid-poor dendritic cells are tolerogenic and induce Treg responses with resultant anergy to cancer31. Reinforcing these observations, we noted upregulation of SORT1 gene expression in early LiM, which has pleiotropic functions in hepatic cholesterol metabolism and has been shown to be regulated post-transcriptionally by toll-like receptor signaling9,10. Further, patients with steatosis and concurrent T cell lobular infiltration were least susceptible to LiM development. This particular phenotype is intriguing as it has similarities with the pathogenesis of non-alcoholic steatohepatitis, which features robust Th1, NKT and NK cell responses31–33. Thus, it may serve not only as a biomarker but also as a potential therapeutic target. It should be emphasized that the inverse association between steatosis and LiM does not necessarily imply causation, nor can the timing of the observed events be determined by evaluating one time point. Does steatosis and CD3+ infiltration precede the inception of PaC, or does this evolve during pancreatic carcinogenesis? Our recently published work showed that a subset of tumor-derived extracellular particles termed “exomeres” preferentially home to the liver, and increase Kupffer cell-mediated fat deposition and interfere with drug metabolism34. This might support hepatic steatosis and related immune infiltration as an evolving secondary process in a subset of patients with pancreatic carcinogenesis.
Moreover, we observed that hepatic creatine levels were reduced in PaC patients, and more significantly in patients who developed LiM. Creatine serves as an energy source for activated cytotoxic T cells, whereas depletion of T cell creatine leads to an exhausted phenotype35. Our metabolomic data suggest that PaC metastatic growth may be linked, at least in part, to immuno-metabolic deregulation and impaired anti-tumor immune responses. Further studies could precisely delineate the immunometabolic events within the liver pre-metastatic niche, and provide a promising therapeutic target to curtail LiM.
The ability to predict which patients will develop metastasis is a critical goal for PaC management. That a portion of patients with seemingly localized PaC develop LiM within months after resection underscores the need for predictive tools to determine the optimal treatment approach. Identifying patients with a high probability of early LiM would provide strong justification to avoid surgical intervention in favor of initial systemic therapy, whereas patients that do not develop metastasis would undergo upfront surgical resection. To this extent, we created a predictive model for early LiM based on findings in perioperative liver biopsies. Although this approach will require further refinement and validation in larger patient cohorts, our results support the benefit of incorporating pre-metastatic liver biopsy into the preoperative evaluation of non-metastatic PaC. Patients with a robust anti-tumor inflammatory signature and steatosis may be at lower risk of LiM, whereas patients exhibiting a high frequency of NETs and upregulated SORT1 in pre-metastatic livers may be at higher risk for rapid metastasis.
Currently there is no reliable method to predict metastatic propensity of PaC, except for a markedly elevated serum CA19-9. However, high CA19-9 may result from large primary tumors rather than metastasis, and it does not inform on the timing and patterns of recurrence. Moreover, patients without elevated CA19-9 are still at risk for metastasis. A biomarker that predicts PaC organotropism and recurrence timing could have direct implications in therapeutic decision making. In our defined PaC recurrence groups for example, a patient predicted to develop early LiM could be managed with total NAT and maximum chemotherapy upfront (e.g. 12 cycles of mFOLFIRINOX) prior to considering resection. Patients predicted to have late LiM could be treated with standard dose NAT. On the other hand, EHM patients, which exhibited the strongest anti-metastatic features, may be better suited for approaches that can enhance anti-tumor immune responses, such as neoadjuvant chemoradiation with or without immune checkpoint inhibitors. Furthermore, knowledge of the expected recurrence group could dictate frequency of post-resection surveillance, with patients predicted to develop early LiM being monitored most frequently (e.g. every 2 months initially) and less frequent for patients predicted as NED.
Our predictive (as opposed to prognostic) analysis of the pre-metastatic liver profile could have implications for selecting the best treatment modality for patients with borderline resectable and locally advanced PaC, and may even have repercussions for the selection of the best candidates for cytoreduction of liver oligometastatic disease. Currently, the overwhelming majority of PaC patients with resectable liver-confined metastases are managed with systemic therapy in a palliative setting, whereas only a very limited number of such patients are offered metastasectomy, after no progression on prolonged systemic therapy. Knowledge of the status of the unaffected liver (pre- vs anti-metastatic) could predict the risk of disease progression due to immune evasion and inadequate tumor control, and thus aid selection of patients appropriate for cytoreduction, in a similar manner as in colorectal cancer.
A relative weakness of our study is the fact that patients did not have surveillance imaging studies at strictly defined time intervals, which may have affected the assessment of timing of recurrence. For example, one patient (PT16) who was incorrectly predicted to be early LiM (LiM<6) developed clinically detectable LiM at 8.4 months. Also, while biliary obstruction was more prevalent among PaC patients and we observed a trend to lower rates of biliary obstruction among PaC patients who remained recurrence-free, we previously reported that biliary obstruction itself does not translate into increased risk of LiM2. Lastly, the relatively small sample size in the different recurrence groups may have led to inadequate power to detect true differences and contribute to overfitting of the machine learning model, despite our attempts to minimize it using cross-validation techniques36.
Nonetheless, strengths of the present study include its prospective design and blinded specimen processing workflow. The downstream multi-parametric analyses were performed prior to knowledge of patients’ recurrence status. Moreover, the fact that patients were enrolled before administration of radiation or systemic therapy eliminated any effects of treatment on the identified liver signatures and demonstrates the potential utility of pre-operative liver biopsies at the time of initial diagnostic workup.
As neoadjuvant treatment of PaC is used with increasing frequency, the effect on the pre-metastatic liver and development of subsequent metastasis warrants investigation to define more effective anti-metastatic regimen for patients. Our data show that the use of multi-model data integration with machine learning may be effective in developing models to predict patients likely to fail a surgery-first approach and guide more precise oncologic management.
In conclusion, we present data supporting an overall augmentation of the immune infiltrate and inflammatory response in pre-metastatic PaC livers, with NET-forming neutrophils preceding emergence of LiM and, conversely, CD3+ lymphocytes acting as critical anti-metastatic effector cells. Metabolic derangements involving the creatine/arginine pathways and potentially impacting citrullination within the liver, as well as hepatic steatosis, represent putative immunometabolic links worthy of further investigation. We propose that a liver biopsy at the time of PaC diagnosis may be an invaluable adjunct to provide prognostic information and guide novel treatment approaches, such as liver-directed immunotherapies and metabolic repurposing, in the pre-metastatic setting.
Methods
Study design and patients
We performed a prospective observational study of 68 patients subjected to pancreatic resection at Memorial Sloan Kettering Cancer Center (MSKCC) between 2015 and 2018. Patients ≥18 years old, with presumed resectable pancreatic adenocarcinoma according to NCCN guidelines (PaC group), or pancreatic/peri-pancreatic benign or pre-malignant lesions (non-PaC group) were eligible for the study. Patients who had received neoadjuvant therapy, and those with unresectable or metastatic disease or a cancer diagnosis other than pancreatic ductal adenocarcinoma (e.g., acinar cell carcinoma, intraductal papillary mucinous neoplasms [IPMN] with associated colloid carcinoma) were excluded.
The collection and analysis of human blood, tumor and liver tissue was approved by the Institutional Review Boards of MSKCC (IRB # 15-015) and Weill Cornell Medicine (IRB # 0604008488), clinical trial registration # NCT02393703. All patients presenting in the MSKCC HPB clinic for possible pancreatectomy who met inclusion criteria were screened and considered for recruitment at the discretion of the operative surgeon. All individuals who agreed to participate provided informed consent. The study is compliant with all relevant ethical regulations regarding research involving human subjects. The sex of the included patients is reported in Supplementary Table S1 and is in line with the established slightly higher incidence of PaC in males. Sex assignment was based on self-reported questionnaire asking for sex at birth, as documented in the patient medical records. Gender or race data have not been collected since they were not readily available from the medical records. No attempt to select patients on a race, sex and/or gender basis was made.
Clinical Outcomes and Recurrence Groups
All patients underwent routine perioperative clinical care and radiologic follow-up according to our institutional standards37. Recurrence data were collected from medical records. The date and site of first metastatic recurrence were defined as the date a lesion was first detected on cross-sectional imaging, even if it was initially indeterminate and later classified as a recurrence on subsequent imaging and/or biopsy. Follow up data were collected up to the occurrence of LiM or death, otherwise patients were censored at 36 months. Time to first recurrence and time to LiM (TTLiM) were calculated from the day of resection. Patients who developed LiM as first site of recurrence (with or without simultaneous EHM recurrence), were classified as LiM<6 or LM>6, depending on whether LM occurred within 6 months of resection or beyond 6 months, respectively. Patients with EHM-only recurrence at any time during follow up were classified as EHM. Isolated local recurrences were classified separately. Patients without clinical or radiologic evidence of recurrence over follow-up were classified as NED.
Tissue collection and processing
Three geographically distinct incisional liver biopsies without any gross evidence of metastasis were obtained at the time of surgery and transferred on ice directly to the lab. Millimeter-sized pieces were frozen on liquid nitrogen for downstream RNA and metabolite extractions. When sufficient liver material was available, a fresh portion was immediately processed for flow cytometry and/or cryopreserved for single-cell RNA sequencing (scRNAseq).
Histology, Immunohistochemistry, Immunofluorescence
For histologic analyses, liver biopsies were washed in PBS and fixed in 4% PFA/PBS overnight at 4oC, followed by multiple washes in cold PBS before being transferred to cold 70% EtOH. Tissues were dehydrated and embedded in paraffin and sectioned into 4 μm sections.
FFPE tissues were stained by conventional H&E protocols and Masson’s Trichrome. Two independent expert liver pathologists (G.A., J.J.) examined the stained slides in a blinded fashion and graded fibrosis, steatosis and inflammation (portal and lobular) according to standardized scores for reporting hepatic pathology11.
4 μm FFPE sections were stained for IHC/IF manually or at the Molecular Core Facility of Memorial Sloan Kettering Cancer Center using Discovery XT processor or Ultra processor (Ventana Medical Systems-Roche). Ki-67, IBA-1, and CD45 were stained by IHC according to the following protocol: After 32 min of heat and CC1 (Cell Conditioning 1, Ventana cat#950-500) retrieval, the tissue sections were blocked first for 30 min in Background Blocking reagent (Innovex, catalog#: NB306). A rabbit monoclonal anti-Ki-67 (clone SP6, abcam cat#16667) was used at 2.5μg/mL concentration and incubated for 6 hours incubation. A rabbit polyclonal anti-IBA-1 (Wako, cat#019-19741) was used in a concentration of 0.1μg/mL for 5 hours incubation. A mouse monoclonal anti-CD45 (clone 2B11, Dako cat#M0701) was used at 2.5μg/mL concentration and incubated for 6 hours incubation. Thereafter, primary antibodies were followed by 60 minutes of biotinylated goat anti-rabbit IgG (Vector labs, cat.# PK6101) in 5.75 μg /ml concentration. Blocker D, Streptavidin-HRP D (part of DAB Map kit, Ventana Medical Systems) and DAB Map kit (Cat#760-124,Ventana Medical Systems) were prepared according to manufacturer instructions. The slides were counterstained with hematoxylin and coverslipped with Permount (Fisher Scientific). Immunohistochemistry for p53 was performed similarly using the undiluted ready-to-use clone DO-7 mouse monoclonal antibody (Dako, cat# GA616), as described previously38. CD11B, CD68, CD206, CD3, CD8, NE, ctH3 and MPO were stained by IF. After 32 min of heat and CC1 (Cell Conditioning 1, Ventana cat#950-500) retrieval, the tissue sections were blocked first for 30 min in Background Blocking reagent (Innovex, catalog#: NB306). The incubation with the primary antibodies were done for 6 hours. A rabbit monoclonal CD11B antibody (clone EPR1344, abcam cat#133357) was used in 1 μg /ml concentration followed by 60 minutes incubation with biotinylated goat anti-rabbit IgG (Vector labs, cat#PK6101) in 5.75μg /ml. Blocker D, Streptavidin- HRP and TSA A488 (Life Tech, cat#B40932) prepared according to manufacturer instruction in 1:100 for 16 min. A mouse monoclonal CD68 (clone KP1, Dako, cat#M0814) was used in 0.02μg /ml followed by biotinylated anti- mouse secondary (Vector Labs, MOM Kit BMK-2202) in 5.75 μg /ml. Blocker D, Streptavidin- HRP and TSA CF594 (Biotium, cat#92174) were prepared according to manufacturer instruction in 1:2000 for 16 min. A rabbit polyclonal anti-CD3 antibody (Dako, cat#A0452) was used in 2.4 μg /ml concentrations followed by 60 minutes incubation with biotinylated goat anti-rabbit IgG (Vector labs, cat#PK6101) in 5.75 μg /ml. Streptavidin- HRP and TSA A488 (Life Tech, cat#B40932) prepared according to manufacturer instruction in 1:100 for 16 min. A rabbit polyclonal anti-CD8 antibody (Cell Signaling, cat#98941) was used in 4.8 μg /ml concentrations followed by 60 minutes incubation with biotinylated goat anti-rabbit IgG (Vector labs, cat#PK6101) in 5.75μg /ml. Streptavidin- HRP and TSA CF594 (Biotium, cat.#92174) were prepared according to manufacturer instruction in 1:2000 for 16 min. All slides were counterstained in 5 μg /ml DAPI [dihydrochloride(2-(4-Amidinophenyl)-6-indolecarbamidine dihydrochloride], Sigma D9542, for 5 minutes at room temperature, mounted with anti-fade mounting medium Mowiol [Mowiol 4-88 (CALBIOCHEM cat#475904)] and coverslipped. For NET analysis, anti-NE / Neutrophil Elastase Sheep anti-Human Polyclonal Antibody (LS-Bio, LS-B4244), dilution 1:200), anti-ct-H3 histone H3 (citrulline R2 + R8 + R17) Rabbit antibody - ChIP Grade (Abcam, ab5103, dilution 1:250) and anti-MPO / goat anti-myeloperoxidase (R&D, cat#AF3667, dilution 1:200) was used.
Quantifications of stains were performed by imageJ and/or a blinded pathologist. Positive area, number of cells and localization was analyzed.
Tissue microarray construction and imaging mass cytometry
Two tissue microarrays (TMAs) were constructed from 37 patients (32 PaC – 8 per recurrence group, and 5 non-PaC) with sufficient tissue to punch 3 cores of 1.5mm diameter representing both portal and lobular areas, defined by pathologist. TMAs were sectioned and confirmed by H&E staining and used for imaging mass cytometry. 100 μg of purified antibody in BSA and Azide free format was conjugated using the MaxPar X8 multimetal labeling kit (Fluidigm) as per the manufacturer’s protocol (Supplementary Table S12). Sections were ablated on a Hyperion Imaging System (Fluidigm). Freshly cut 5-micron thick FFPE sections were stored at 4°C for a day before staining. Slides were first incubated for 1 hour at 60°C on a slide warmer followed by dewaxing in fresh CitriSolv (Decon Labs) twice for 10 minutes, rehydrated in descending series of 100%, 95%, 80%, and 75% ethanol for 5 minutes each. After 5 minutes of MilliQ water wash, the slides were treated with antigen retrieval solution (Tris-EDTA pH 9.2) for 30 minutes at 96°C. Slides were cooled to room temperature, washed twice in TBS and blocked for 1.5 hours in SuperBlock Solution (ThermoFischer), followed by overnight incubation at 4°C with the prepared antibody cocktail containing all metal-labeled antibodies in a humid chamber. Next day, slides were washed twice in 0.2% Triton X-100 in PBS, and twice in TBS. DNA staining was performed using Intercalator-Iridium in PBS solution for 30 minutes in a humid chamber at room temperature. Slides were washed with MilliQ water and air dried prior to ablation. The instrument was calibrated using a tuning slide to optimize the sensitivity of detection range. All ablations were performed with a laser frequency of 200 Hz. Tuning was performed intermittently to ensure the signal detection integrity was within the detectable range. The raw MCD files were exported for further downstream processing.
Processing IMC data into AnnData single cell matrix with spatial coordinates
We used the IMC package (https://github.com/ElementoLab/imc, version 0.1.4) to preprocess the raw MCD files from into a combined AnnData object that contains the location and expression profiles of acquired cells. With original MCD files acquired through Hyperion machine, ROIs were extracted as stacks of images in tiff file format along with associated metadata including channel and epitope information. To reduce the images to 3-dimensional conventional format, we used a pretrained Ilastik39 model to predict nuclear, cytoplasmic, and background probability map. The probability map was subsequently segmented using DeepCell40 to capture and identify cellular and nuclear borders.
To quantify cellular expressions, we used the cell masks to aggregate the mean intensity of pixels within a cell for each antibody channel through scikit-image. We combined the per cells expression vector from all cells across all images into a single matrix through scanpy41 in AnnData42 format to process the data comprehensively and consistently. We then performed log transformation, Z-score normalization with truncated at positive and negative 3 standard deviations, followed by harmony43 (version 0.3.0) batch correction to phase out sample-specific biases.
T cell phenotyping and spatial localization
To filter out the T cell population, we extracted cells that had CD3 expression that was greater than 2 standard deviations after Z-score normalization. This captured 36,987 cells (5.3%) out of 696,335 cells. For the extracted T cells, we performed principal component analysis, neighborhood calculation, and Leiden clustering44 to systematically and quantitatively identify the cell phenotypes captured in IMC with all markers combined across all images. These clusters were annotated into CD4, CD8, Treg, NKT/γδT cells based on their expression of CD3, CD4, CD8A, FoxP3, NKG2A, and TRDC.
To identify the spatial localization of the T cells, we performed UTAG45 with a max_dist of 20 and Leiden clustering at 0.1 and mapped the resulting 3 clusters to lobular or portal based on the whether the zones were KRT8/18 and ARG1 positive.
RNA sequencing
mRNA sequencing of liver biopsies was performed at Integrated Genomics Operation (IGO), Memorial Sloan Kettering Cancer Center. Briefly, total RNA from 5 mg of frozen liver tissue was extracted using the RNeasy Mini Kit (QIAGEN catalog # 74104) according to instructions provided by the manufacturer. After RiboGreen quantification and QC analysis of 1ug using Total RNA Nano chip on Agilent Bioanalyzer 2100, samples with RIN values less than 3 were excluded. Samples underwent ribosomal depletion and library preparation using the TruSeq Stranded Total RNA LT Kit (Illumina catalog # RS-122-1202) according to instructions provided by the manufacturer with 6-8 cycles of PCR. Samples were barcoded and run on a HiSeq 2500 in Rapid or High Output Mode or a HiSeq 4000 in a 50bp/50bp paired end run, using the HiSeq Rapid SBS Kit v2, TruSeq SBS Kit v4, or HiSeq 3000/4000 SBS Kit, respectively (Illumina). On average, 88 million paired reads were generated per sample and 32% of the data mapped to the transcriptome. Standard pipeline analyses were performed by IGO and subsequent comparisons were performed by DESeq2, R software. Log2 fold changes exceeding 1/−1 with adjusted p<0.1 (Walds test) were considered differentially expressed. Genes of interest were further confirmed by protein expressions and scRNA sequencing. Heatmaps and hierarical clustering were generated by Morpheus (Broad Institute). GSEA using Hallmarks of Cancer gene set (MSigDB) was performed to determine pathways differentially enriched between the groups (p<0.05, FDR<0.25). Gene clustering analysis and visualization were performed by Metascape v.3.5 and Cytoscape 3.5.1 ClueGO with the GO Immune System Process with a p value cutoff of <0.1.
Metabolomics
Metabolite extraction was performed on 24 PaC and 9 Non-PaC patients with enough liver biopsy material, as previously described46. Briefly, 5mg of liquid nitrogen snap-frozen liver tissue was submerged in 80% methanol and pestle-grinded on dry ice, followed by serial incubations and centrifugations to obtain a clear supernatant for lyophilization by SpeedVac. The samples were stored in −80°C. Unlabeled polar metabolite profiling by LC-MS/MS was performed at Beth Israel Deaconess Medical Center, Harvard Medical School. A total of 296 metabolites were detected. Results are presented as peak area of total ion current. Data analyses were performed using MetaboAnalyst 4.0 and 5.047.
Hepatic non-parenchymal cell isolation
Hepatic non-parenchymal cell (NPC) isolation for downstream single-cell studies was performed on a subset of patients with adequate liver tissue as follows: a portion of the specimen was minced with scissors to 1mm pieces and digested in HBSS with 1mg/mL Collagenase IV (Worthington) and 1U/mL DNAse I (Roche) for 20 min at 37°C with constant agitation. After washing and straining through a 70μm mesh, the NPCs were separated by density gradient centrifugation with 40% Optiprep solution as previously described31. Specifically, the cell suspension was combined with the Optiprep, underlayed in GBSS buffer, and spun at 900xg for 20 min. The NPCs, which concentrated at the interface, were collected and subjected to red blood cell lysis using ACK lysis buffer (Gibco). Isolated NPCs were validated to be >90% CD45+ cells by flow cytometry on BD FACS Canto with the FACSDiva software (BD Biosciences). Analysis was performed using FlowJo v.10 (FlowJo LLC).
Single cell RNA sequencing
The isolated hepatic NPC (>90% CD45+) were cryopreserved in 10% DMSO/90% FBS mix until the time of analysis. Upon retrieval, live cells were sorted by exclusion on ethidium homodimer-1 and gating on calcein violet, validated by trypan blue staining, and submitted to downstream processing for scRNAseq if viability was >80%. Of the 10 tested patient samples, 8 met the recommended cell concentration and viability criteria (6000 cells/50 000 reads) and were submitted for downstream analysis by 10X Genomics at the Epigenomics Core, WCM (Table S3). Sequencing results were post-processed by the Cellranger software (10x Genomics), subjected to ZINB-WaVE dimensional reduction48, and further analyzed by the R Seurat pipeline (Satija lab). Unsupervised clustering of all cells combined after ZINB-WaVE dimensional reduction yielded 6 distinct clusters, with most cells expressing PTPRC/CD45, consistent with immune cell lineage (Extended Data Fig. S6a). The two major clusters consisted of myeloid cells (cluster 1; 4,747 cells) and lymphoid cells (cluster 5; 28,564 cells). Unsupervised subdivision of the main clusters at higher resolution (0.8) resulted in refinement of the lymphoid cluster into NK, NKT, and T cell clusters, and further division of the myeloid cluster into monocytes and myeloid DCs. Finally, supervised lineage marker-based clustering of the myeloid population yielded 3 subsets: CD14+ classical monocytes, CD16+ non-classical monocytes, and CD1c+ myeloid DCs. The other initial clusters were defined as myeloid DC subset (CD1c−; cluster 2), lymphoid DCs (cluster 3), B cells (cluster 4), and a population of proliferating lymphoid cells (cluster 6). Subsequent analyses were done on CD3+ lymphoid clusters by subsetting after further integration and dimensional reduction visualized by UMAP.
Deconvolution of RNA sequencing data was performed by Cibersortx software with custom or the LM22 gene signature23.
Statistical analysis
Statistical analysis was conducted using SPSS Statistics for Windows v.25 & 26 (IBM Corp., Armonk, NY) and GraphPad Prism v.9 for Windows (GraphPad Software Inc., San Diego, CA). For nominal variables, the Pearson’s χ2 test and Fisher’s exact test were used. For ordinal variables, the Kruskal-Wallis test was used. Continuous variables that followed a normal distribution were compared using a pairwise t-test, whereas non-parametric tests (Mann-Whitney U-test or Kruskal-Wallis test) were used if the distribution was not normal. All tests were two-tailed and results were considered statistically significant when p≤0.05. Data visualized in bar graphs represent biological replicates and are displayed as mean±SEM, unless otherwise specified. Recurrence and survival analyses were conducted using Kaplan-Meier methods. Hazard ratios were calculated using the Cox proportional hazards model.
Development of Prediction Models
The modeling of potential predictive features of future metastasis was evaluated with multivariate analysis using machine learning-based classification technique. Four models (m1-m4) were designed to distinguish one recurrence group at a time: m1, LiM vs all; m2, Early LiM (LiM<6) vs all; m3, EHM vs. all; and m4, NED vs all. Feature selection for each model was performed using minimum redundancy maximum relevance (MRMR) method49. A forward selection method was applied to determine the final feature set, in which features were sequentially added to an empty candidate set until the addition of further features did not decrease the misclassification error. The selected features were then included in designing the prediction model using a naïve-Bayes classifier.
To evaluate the performance of the selected features, leave-one-image-out (LOO) method was applied considering the small sample size. The LOO is a form of cross-validation where one sample is used for testing and the remaining observations are used to train the model. This is repeated until all samples are explored as test data. The feature selection followed by model designing was performed with training data only and evaluated with test data.
Classification of patients into recurrence groups was performed by calculating a probability score with each of the four models. The result with the highest probability score was selected.
Extended Data
Extended Data Fig. 1 |. Gene expression patterns in the liver associated with future recurrence.
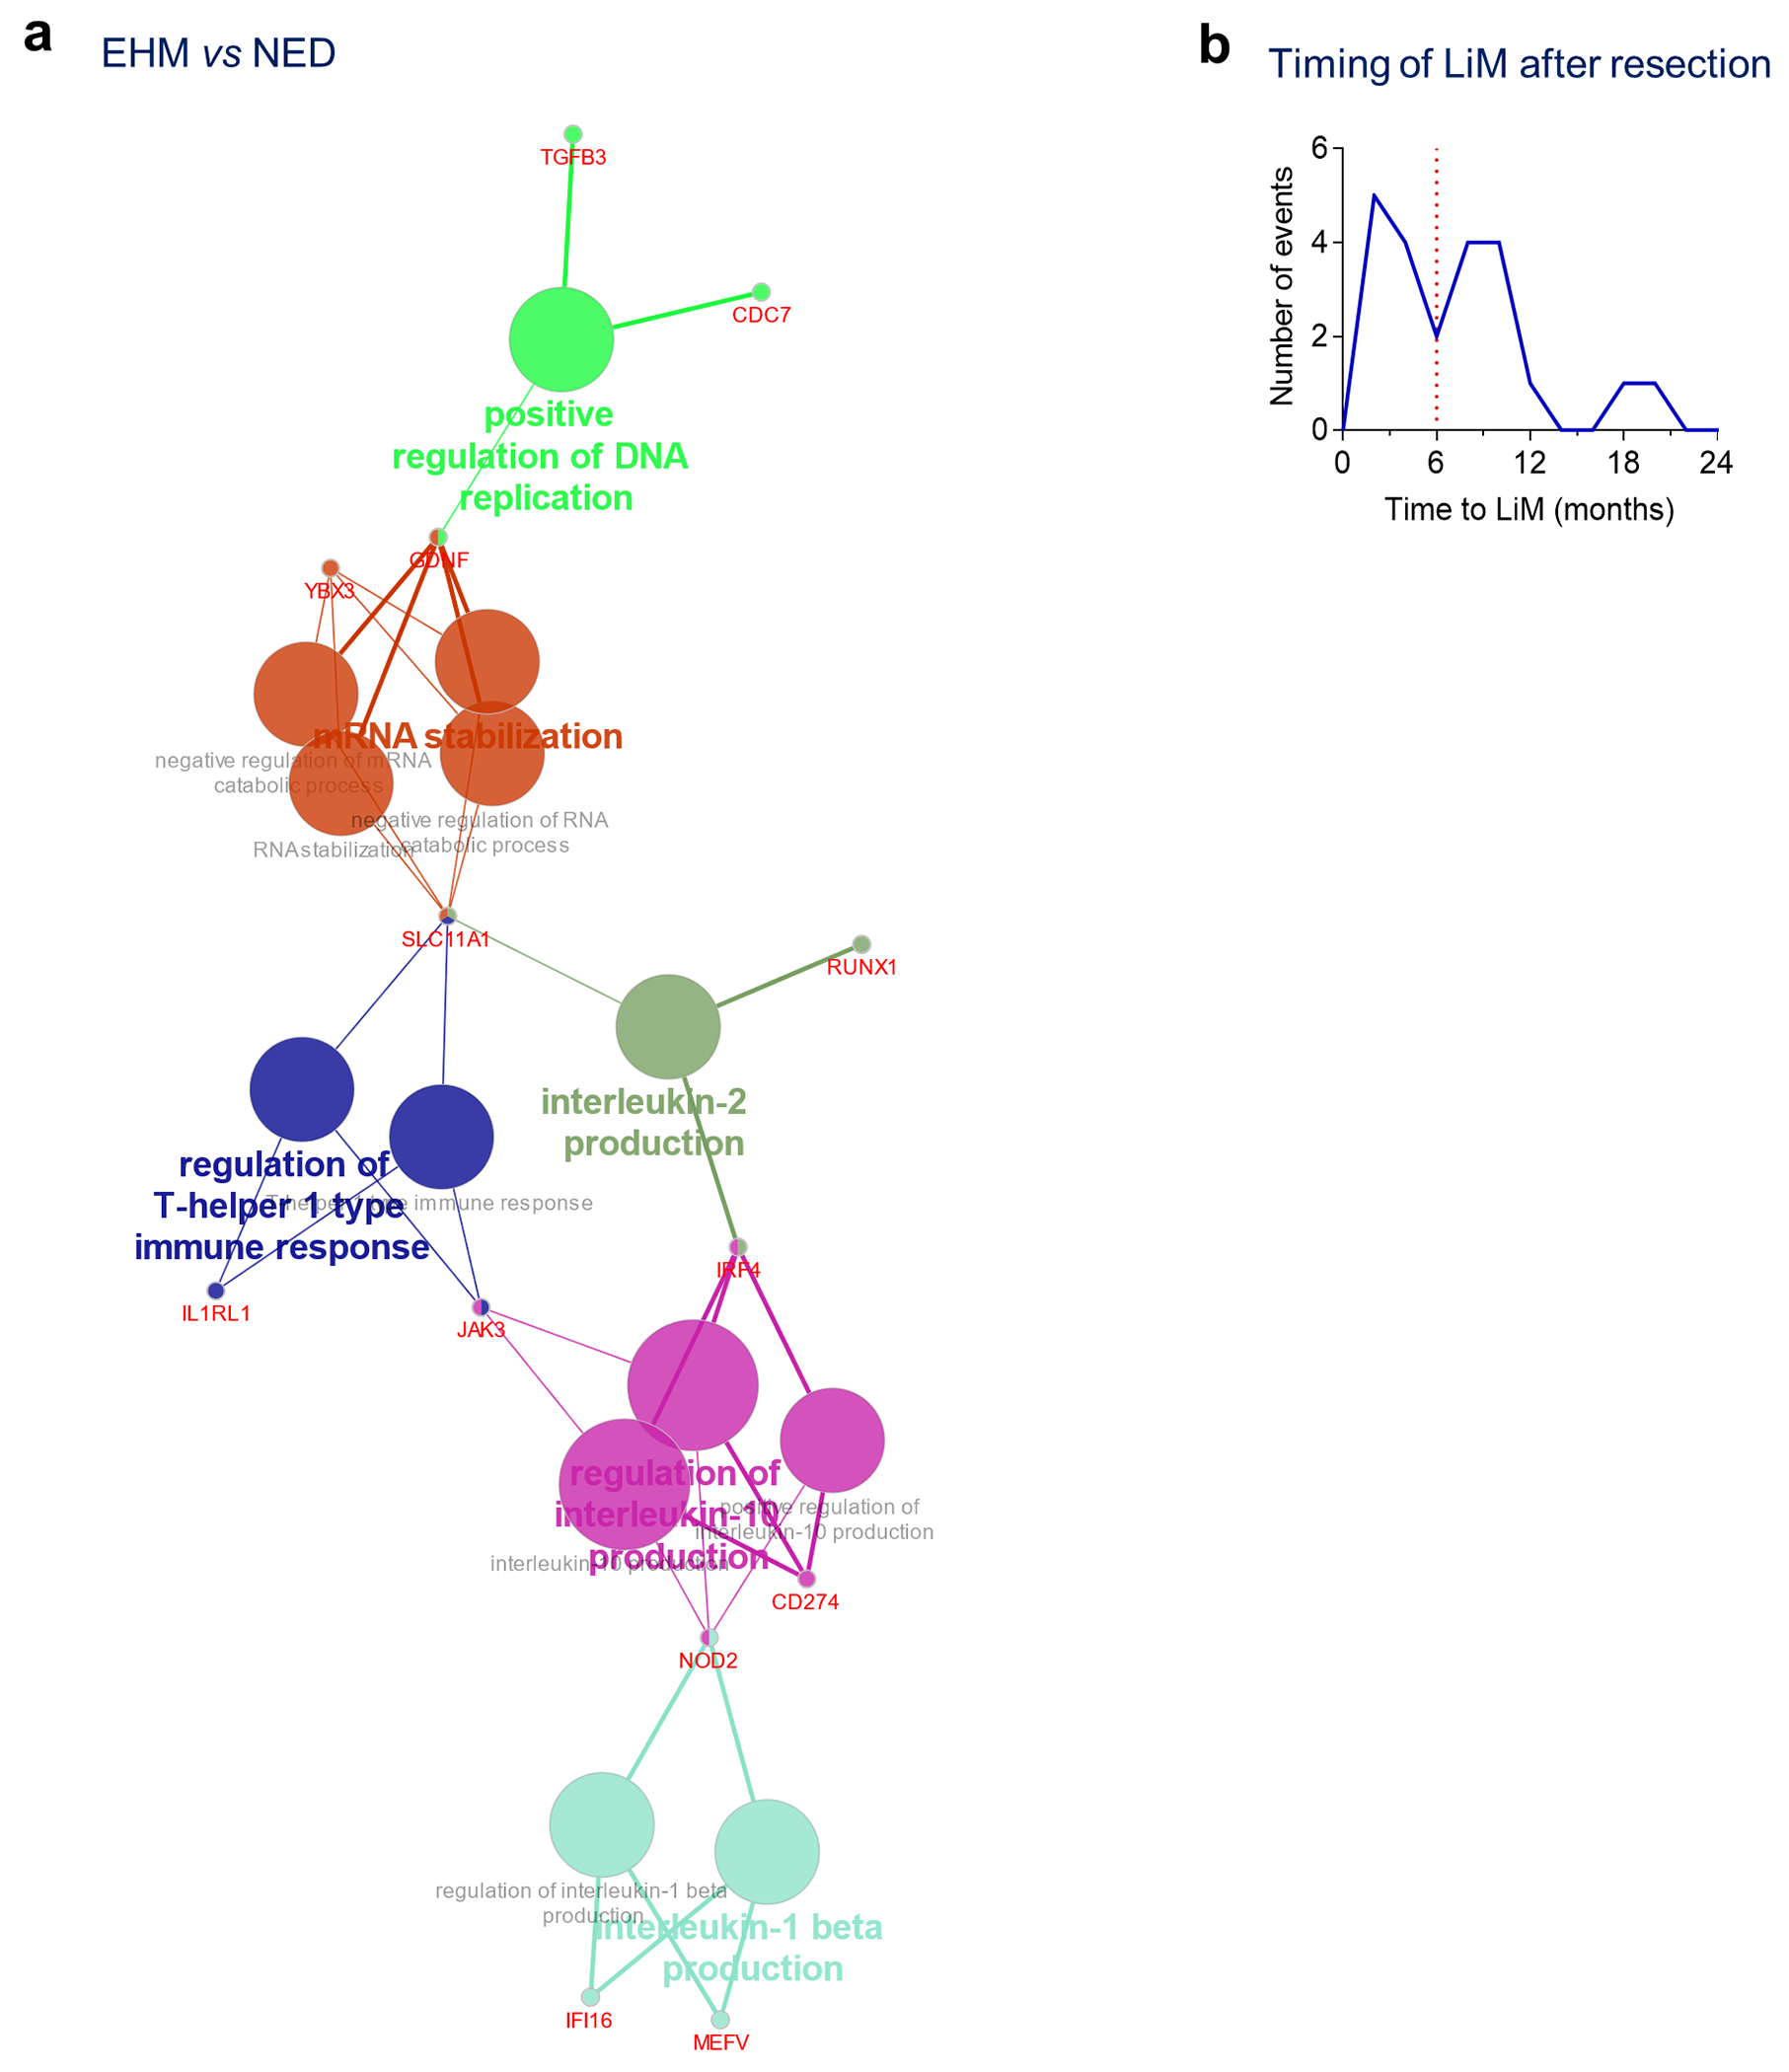
a, Immune cell gene clustering of the genes upregulated in EHM patients compared to NED (Cytoscape, ClueGO). b, Analysis of the timing of liver metastasis after resection of PaC demonstrated a pattern of an early peak of LiM, which occurred within 6 months of resection, followed by a second peak beyond 6 months.
Extended Data Fig. 2 |. Liver histology scoring.
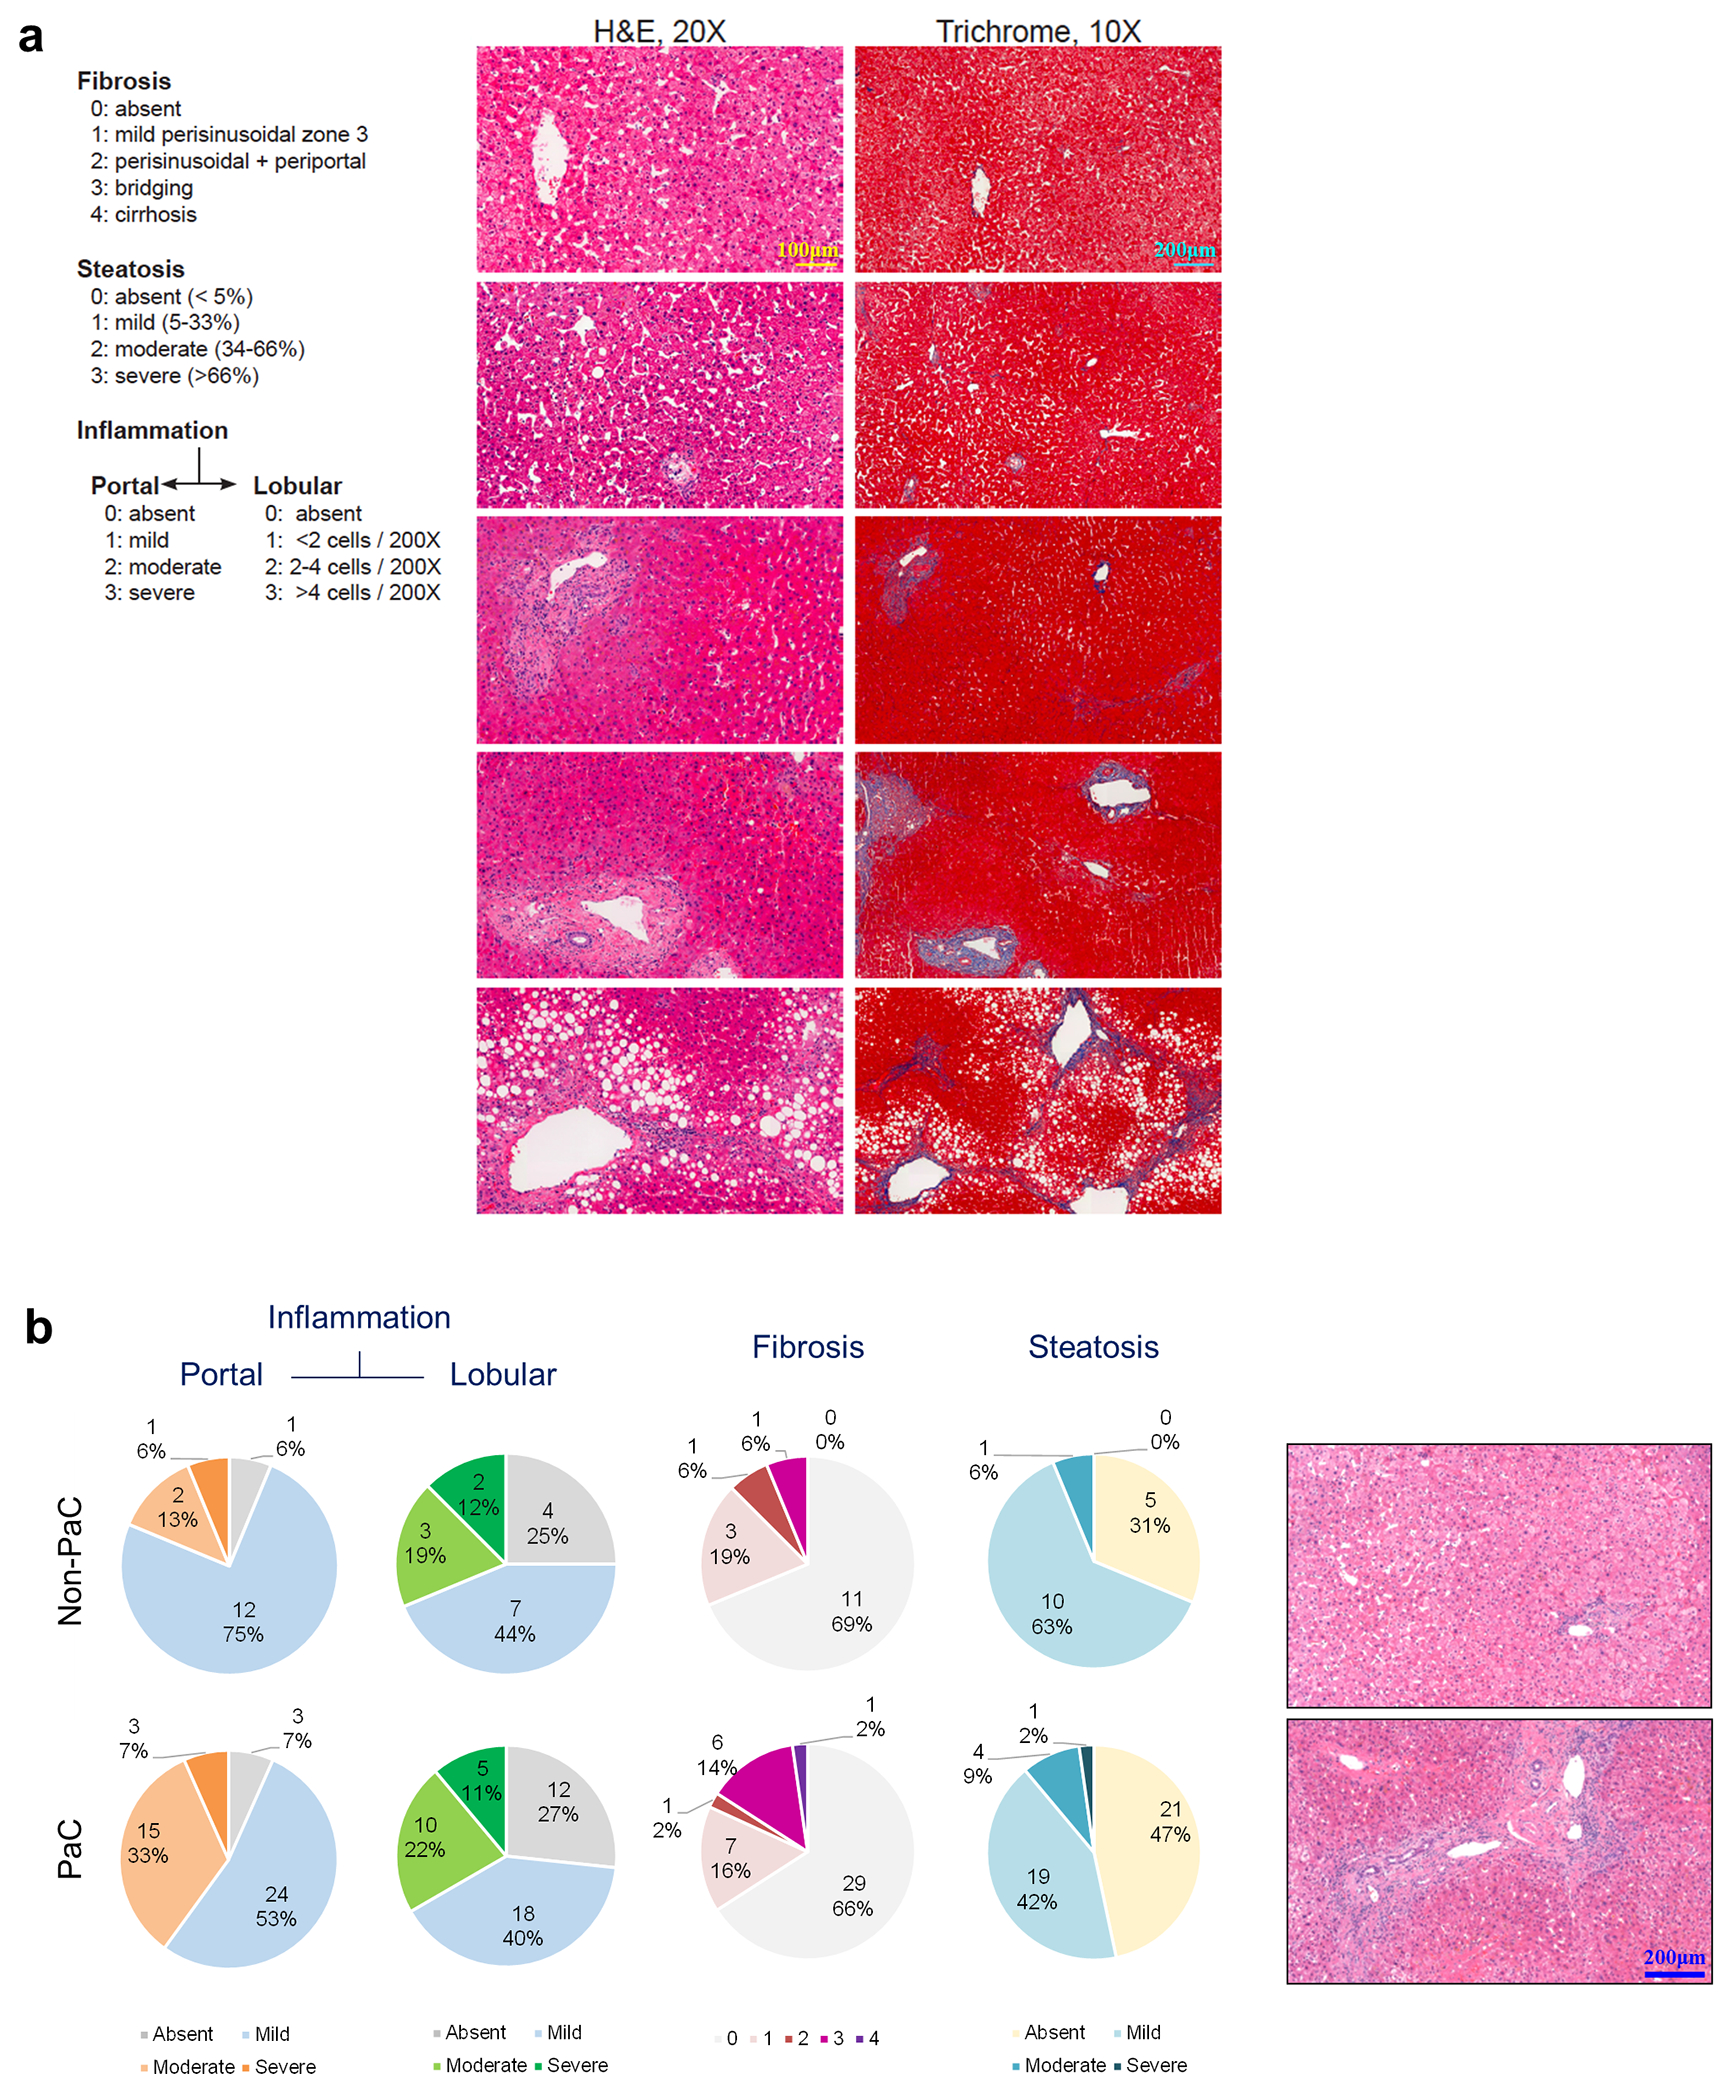
a-b, Liver fibrosis, steatosis, and inflammation were scored by two blinded pathologists and compared between PaC and Non-PaC. No statistically significant differences were noted (Somer’s d test: portal inflammation, p=0.361; lobular inflammation, p=0.986; fibrosis, p= 0.695; steatosis, p=0.442).
Extended Data Fig. 3 |. Liver immune cell characterization.
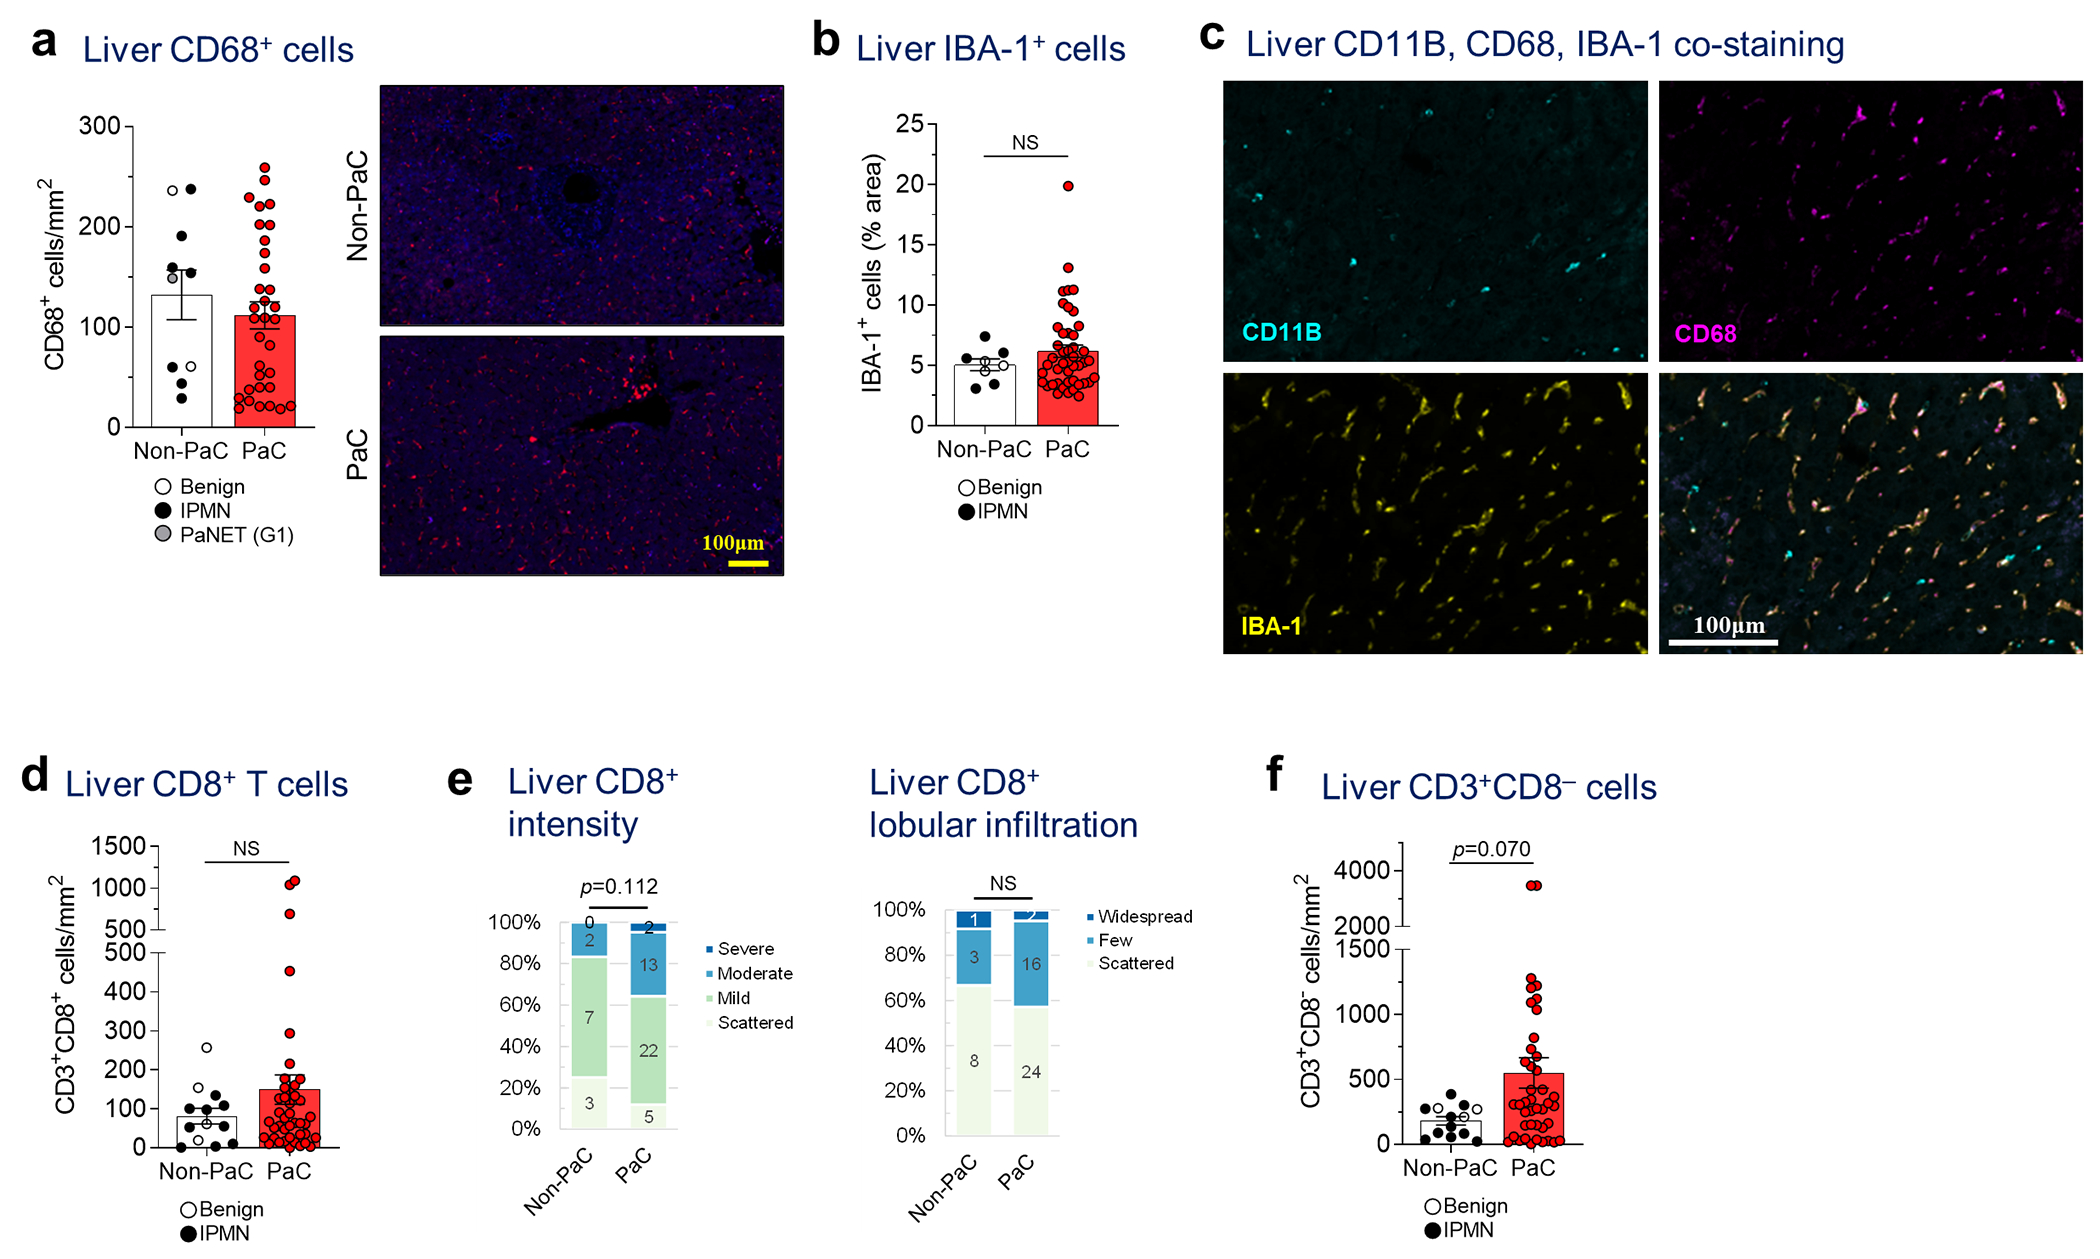
a, Liver biopsies stained by immunofluorescence (IF) for CD68, quantified using ImageJ and compared between PaC (n=33) and Non-PaC (n=10; Mann-Whitney U-test; p=0.356). b, Liver biopsies were stained by immunohistochemistry (IHC) for the macrophage activation marker IBA-1. The percentage of stained area was quantified with ImageJ and compared between PaC (n=45) and Non-PaC (n=8; Mann-Whitney U-test; p=0.687). c Liver biopsies were co-stained by IF for CD11B, CD68, and IBA-1 to assess for overlap of these markers (n=3). d-f, Liver biopsies were co-stained by IF for CD3 and CD8 as in Fig. 2e–f. d, CD3+CD8+ T cells were quantified using ImageJ and compared between PaC (n=42) and Non-PaC (n=13; Mann-Whitney U-test; p=0.565). e, The intensity of CD8 staining and the degree of CD8+ T cell lobular infiltration in PaC livers (n=42) were assessed by a blinded pathologist and compared to non-PaC livers (n=12; Somers’ d; p=0.112 and p=0.648, respectively), f, CD3+CD8” lymphocytes were quantified using ImageJ and compared between PaC (n=42) and Non-PaC (n=13; Mann-Whitney U- test; p=0.070). MeaniSEM are shown in bar graphs.
Extended Data Fig. 4 |. Single cell RNA sequencing (scRNAseq) of liver immune cells.
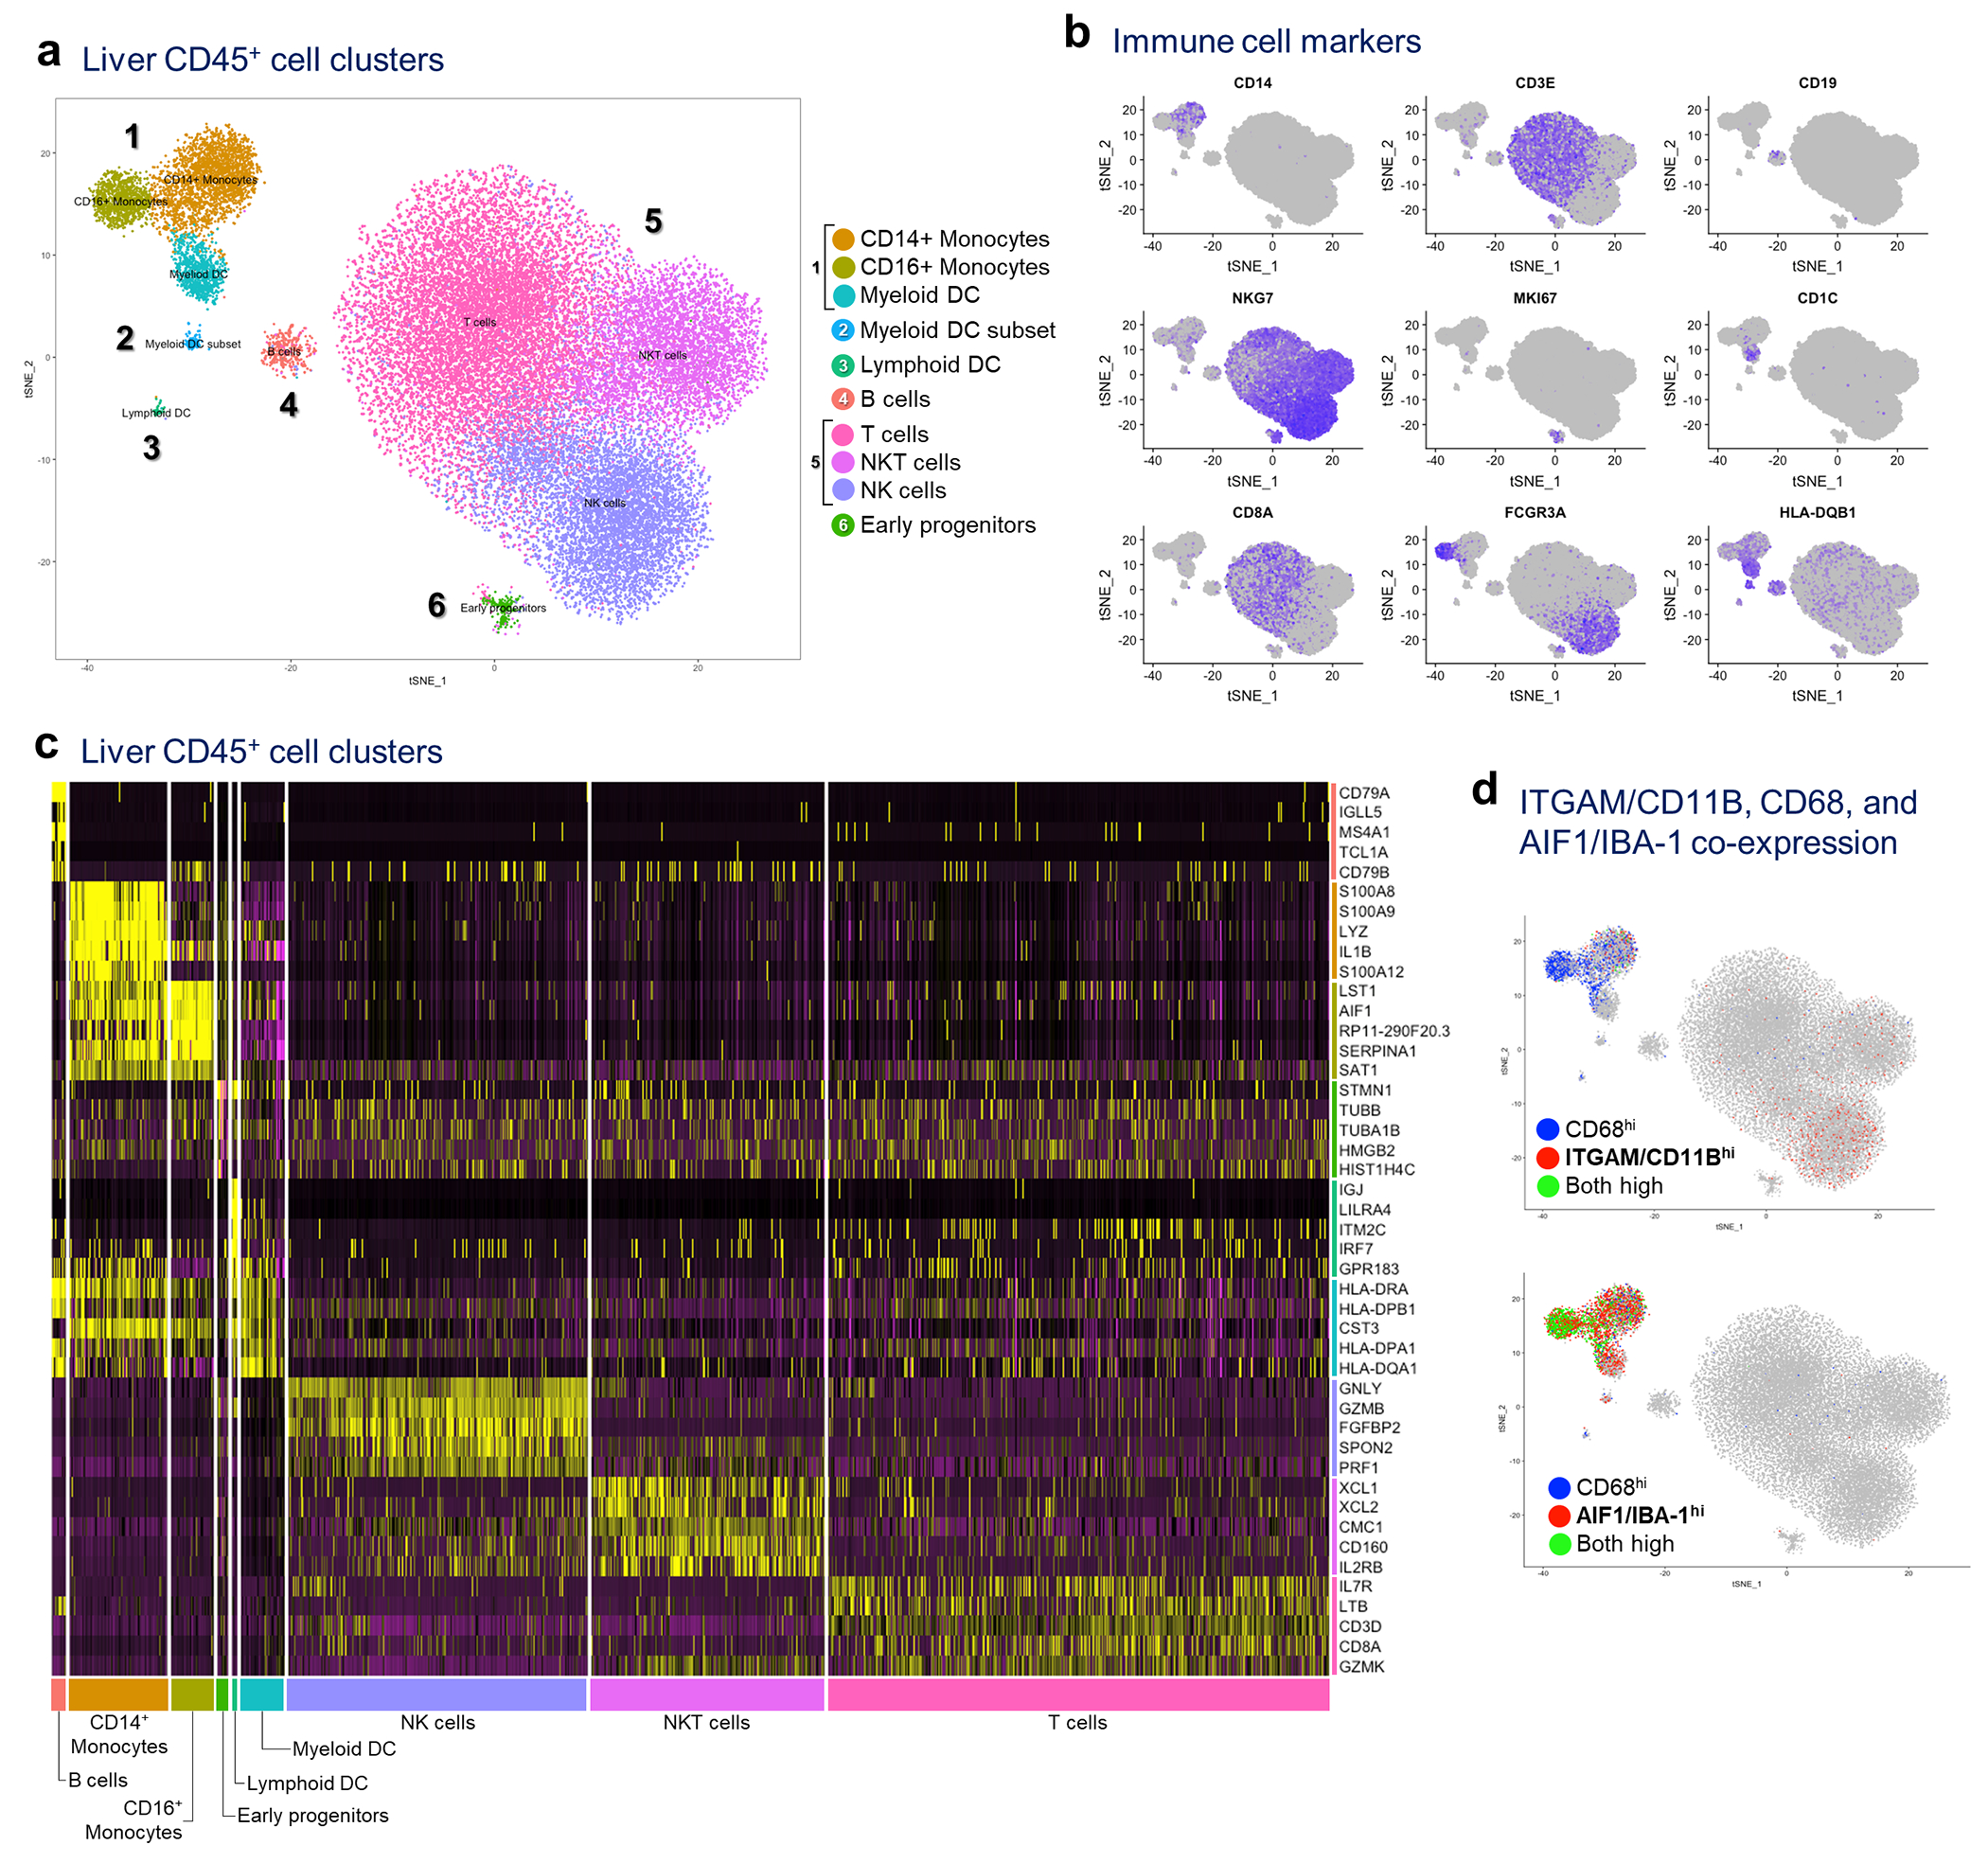
a, Hepatic NPCs (>95% CD45+) were isolated from 3 non-PaC and 5 PaC patients and subjected to scRNAseq. A total of 33,311 cells were sequenced, with 48,294 mean reads per cell and 1,000 median genes per cell detected. The sequencing saturation was >78% for all samples, a, tSNE plot combining all samples showing clustering into 10 major cell clusters, b, Distribution of gene expression of conventional immune cell markers further defining the different cell types, c, Heatmap of top 5 genes assigning the main cell types, d, Co-expression of CD11B/ITGAM, CD68, and IBA-1/AIF1 was assessed at the gene level, revealing CD1 IB expression predominantly by the CD14+ monocyte subset of the myeloid cluster and by the NK cell subset of the lymphoid cluster, showing little co-expression with CD68 (top tSNE plot). IBA-1 was expressed by all 3 subsets of the myeloid cluster, and most CD68-expressing cells (bottom tSNE plot).
Extended Data Fig. 5 |. scRNAseq of liver immune cells showing altered NK cell subsets.
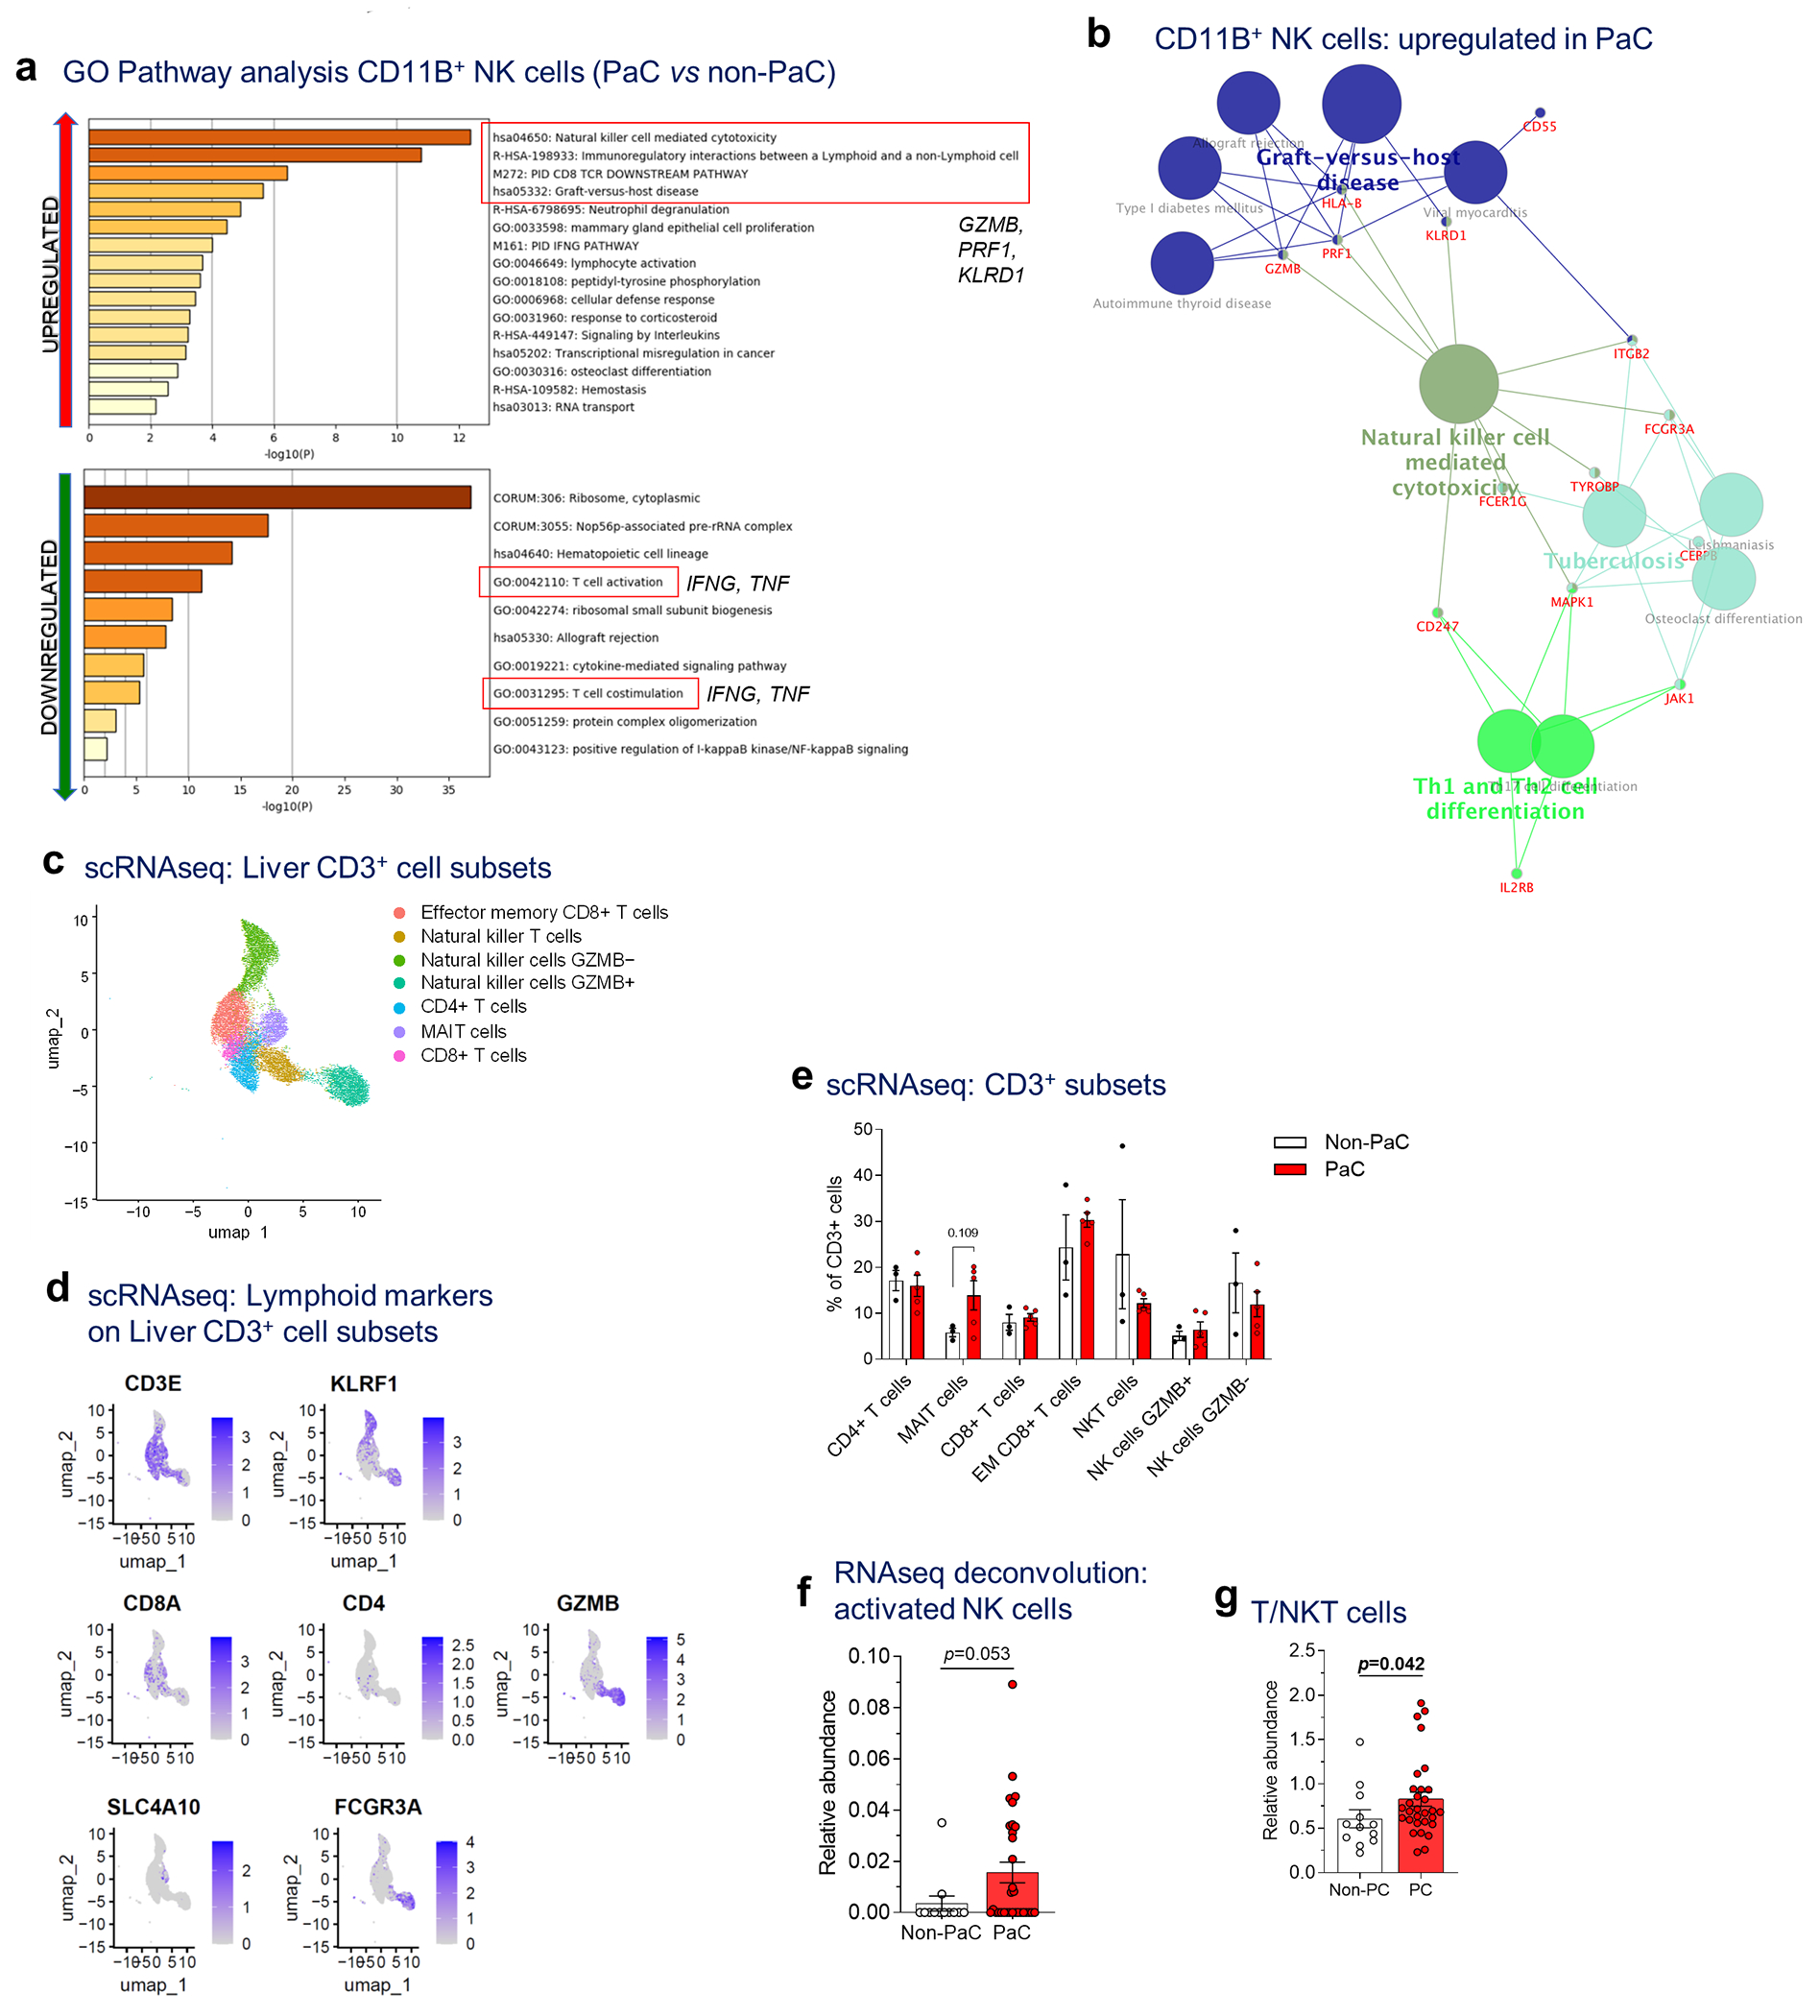
a, GO pathway analysis (Metascape) of the upregulated genes (upper panel) and downregulated genes (lower panel; cutoff p<0.1, after adjustment for multiple comparisons), b, Immune cell gene clustering (Cytoscape, ClueGO) of genes upregulated in CD11B+ NK cells in PaC vs non-PaC (cutoff p<0.1, after adjustment for multiple comparisons), c-e, Sub-analysis of the lymphoid cluster (corresponding to cluster 5 of Ext. Data Fig. 5a) to explore subsets of CD3-expressing lymphocytes demonstrated 7 sub-clusters (MAIT, mucosa-associated invariant T cells), c. Key defining genes are shown in d and in Figure 3i. e, The relative proportion of these subclusters was compared between PaC and Non-PaC (multiple t-tests with correction for multiple comparisons, shown if p<0.25). f, Cibersort-based deconvolution of the bulk liver mRNA sequencing data using the LM22 immune cell reference gene set for activated NK cells (PaC, n=31; Non-PaC, n=12; Mann-Whitney U-test, p=0.053, Cibersort). g Cibersort-based deconvolution of the bulk liver mRNA sequencing data using the T/NKT immune cell gene set derived in Extended Data Fig. 4 (PaC, n=30; Non-PaC, n=12; Mann-Whitney U-test, p=0.042). MeaniSEM are shown in bar graphs.
Extended Data Fig. 6 |. Imaging mass cytometry for characterization of CD3+ cell subsets.
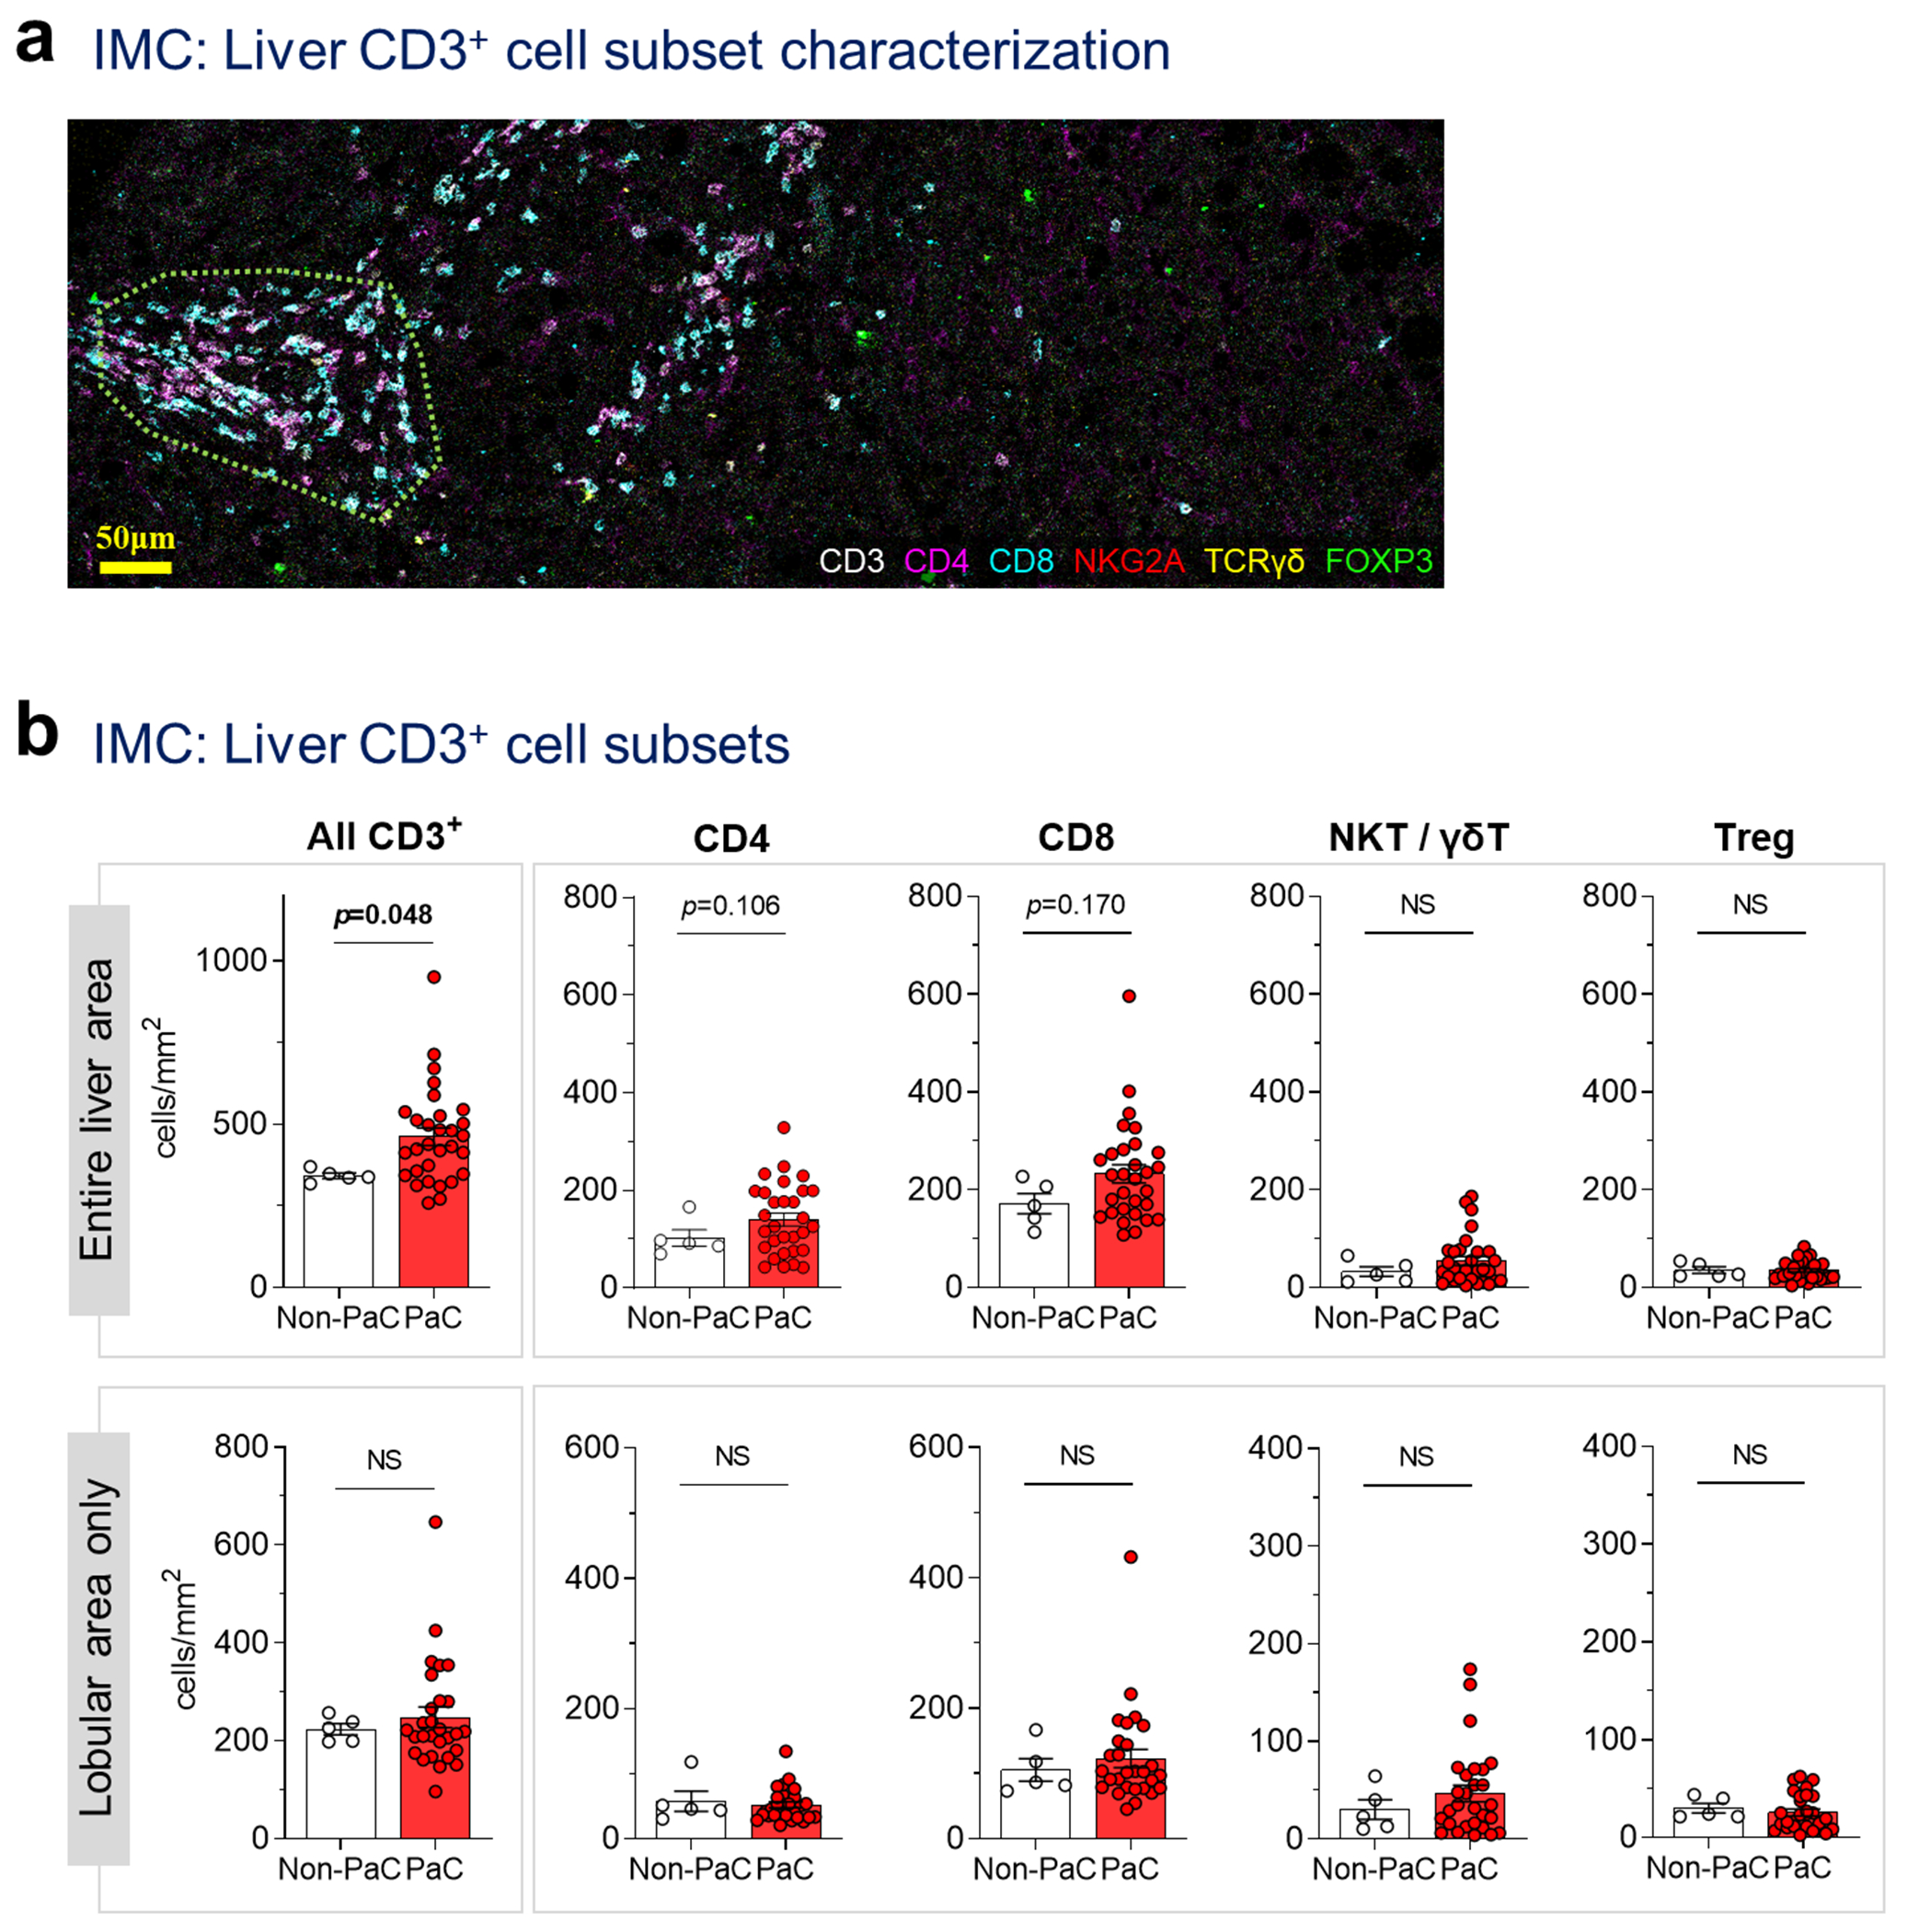
Imaging mass cytometry (IMC) was performed on a tissue microarray including 2-3 cores per patient from 5 Non-PaC and 30 PaC patients, a, Representative image from a patient with LiM>6mo demonstrating the staining pattern and the spatial distribution. For calculation of lobular cell densities, portal areas (enclosed in dotted line here) were segmented and subtracted from the total cell count for each patient, b, Subsets of CD3+ cells in the entire liver section, or in the lobular areas only, were compared between PaC and non-PaC: CD3+, p=0.048 (total) and p=0.981 (lobular; Mann-Whitney U-test); CD4+, p=0.048 (total) and p=0.742 (lobular; t-test); CD8+, p=0.170 (total) and p=0.715 (lobular; Mann-Whitney U-test); NKT/yST (TCRy8+ and/or NKG2A+), p=0.477 (total) and p=0.604 (lobular; Mann-Whitney U-test); Treg (FOXP3+), p=0.727 (total) and p=0.448 (lobular; Mann-Whitney U-test). MeaniSEM are shown in bar graphs. Only p<0.25 are shown on the graphs.
Extended Data Fig. 7 |. Liver immune cells among recurrence groups.
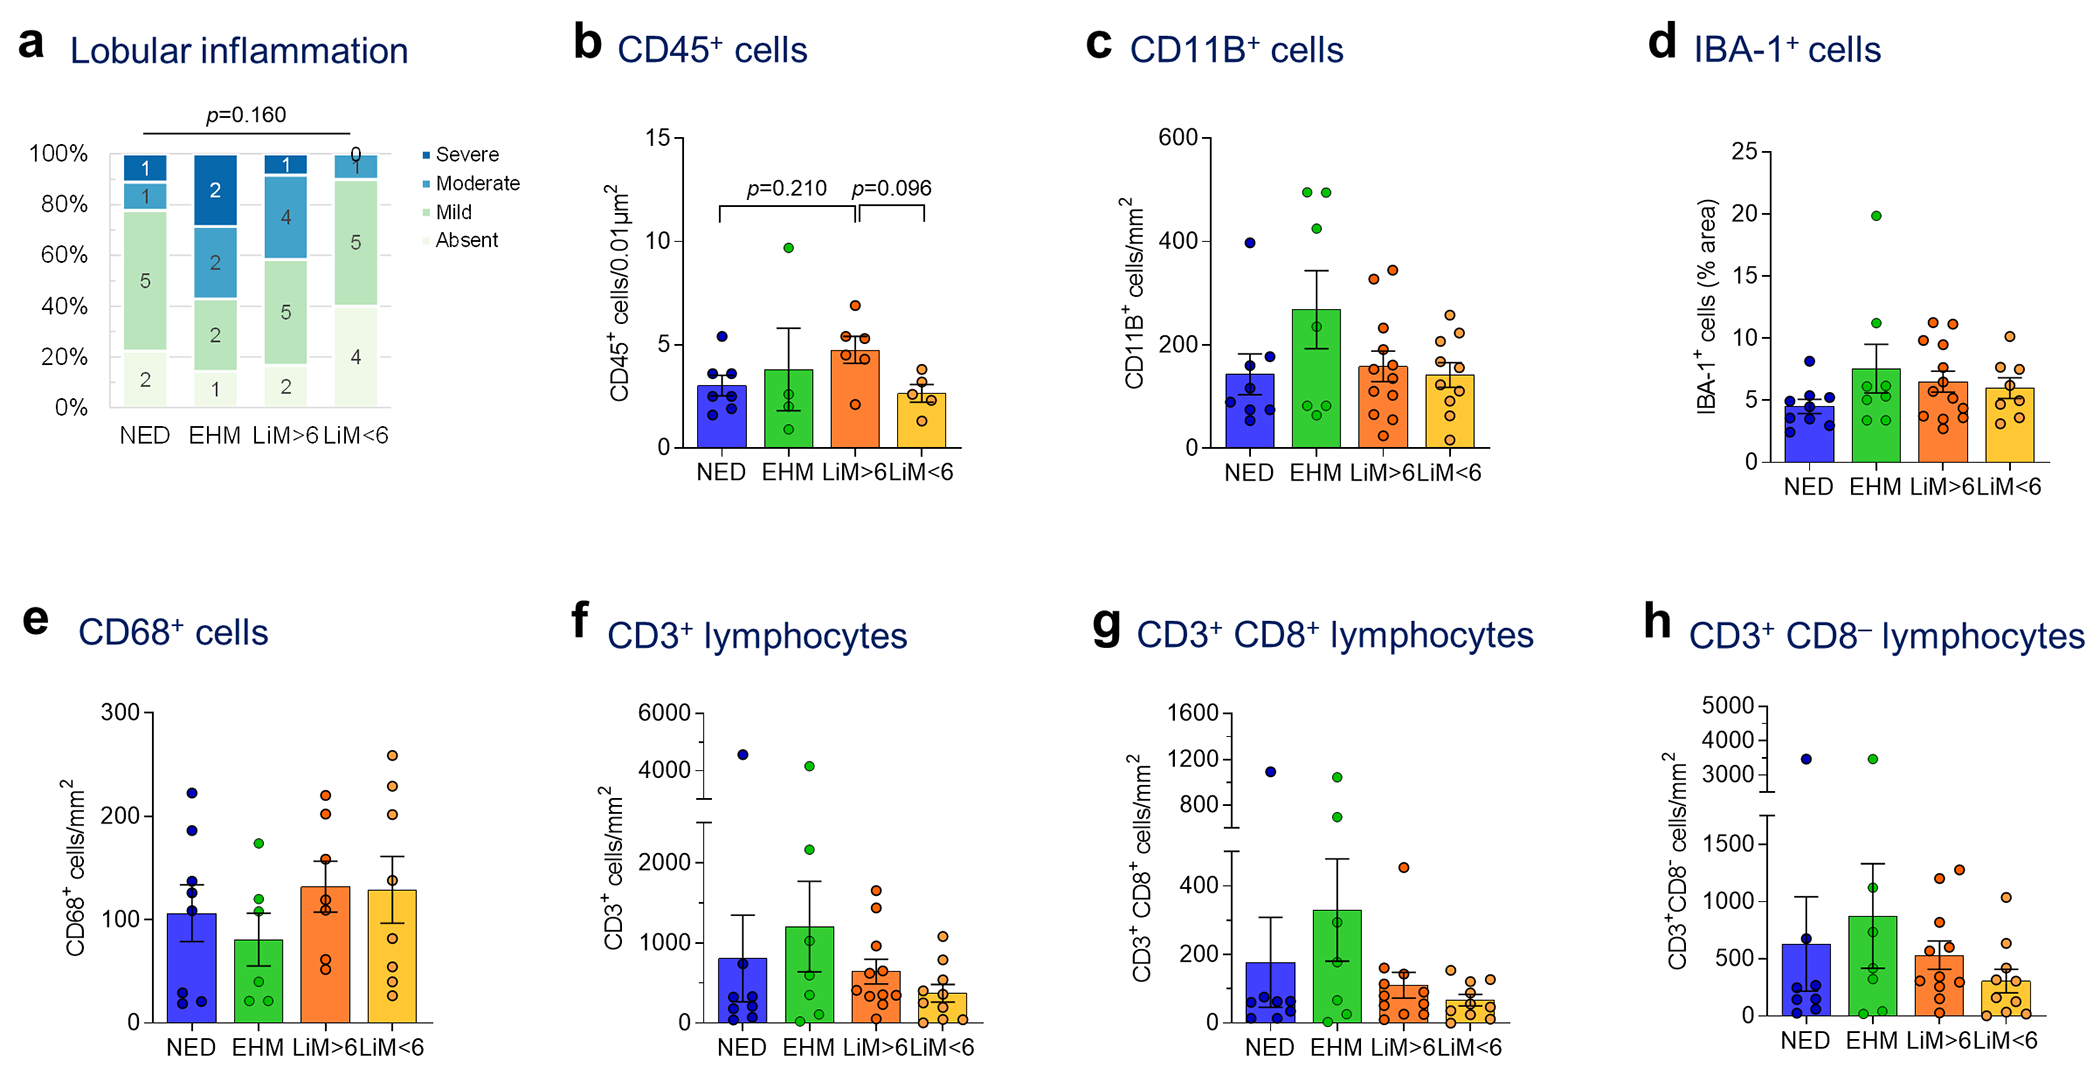
a, Liver biopsies obtained at the time of resection from patients with NED, or distant recurrence (EHM, LiM>6, or LiM<6) were manually scored by a blinded pathologist for lobular inflammation (Kruskal-Wallis test), b-h, Liver biopsies were stained by IHC (b, d) or IF (c, e-h) for different immune cell markers, quantified using ImageJ and compared between the defined PaC recurrence pattern groups (ANOVA and pair-wise t-tests with multiple comparison correction by FDR; only p-values <0.25 are shown). MeaniSEM are shown in bar graphs, b, CD45+ cells (n= 22; ANOVA p=0.161). c, CD11B+ cells (n=37; ANOVA p=0.504). d, IBA1+ cells (n=38; ANOVA p=0.185). e, CD68+ cells (n=29; ANOVA p=0.544). f, CD3+ cells (n=36; ANOVA p=0.335). g, CD3+CD8+ cells (n=36; ANOVA p=0.289). h, CD3+CD8” cells (n=36; ANOVA p=0.420).
Extended Data Fig. 8 |. Metabolic dysregulations in the pre-metastatic liver.
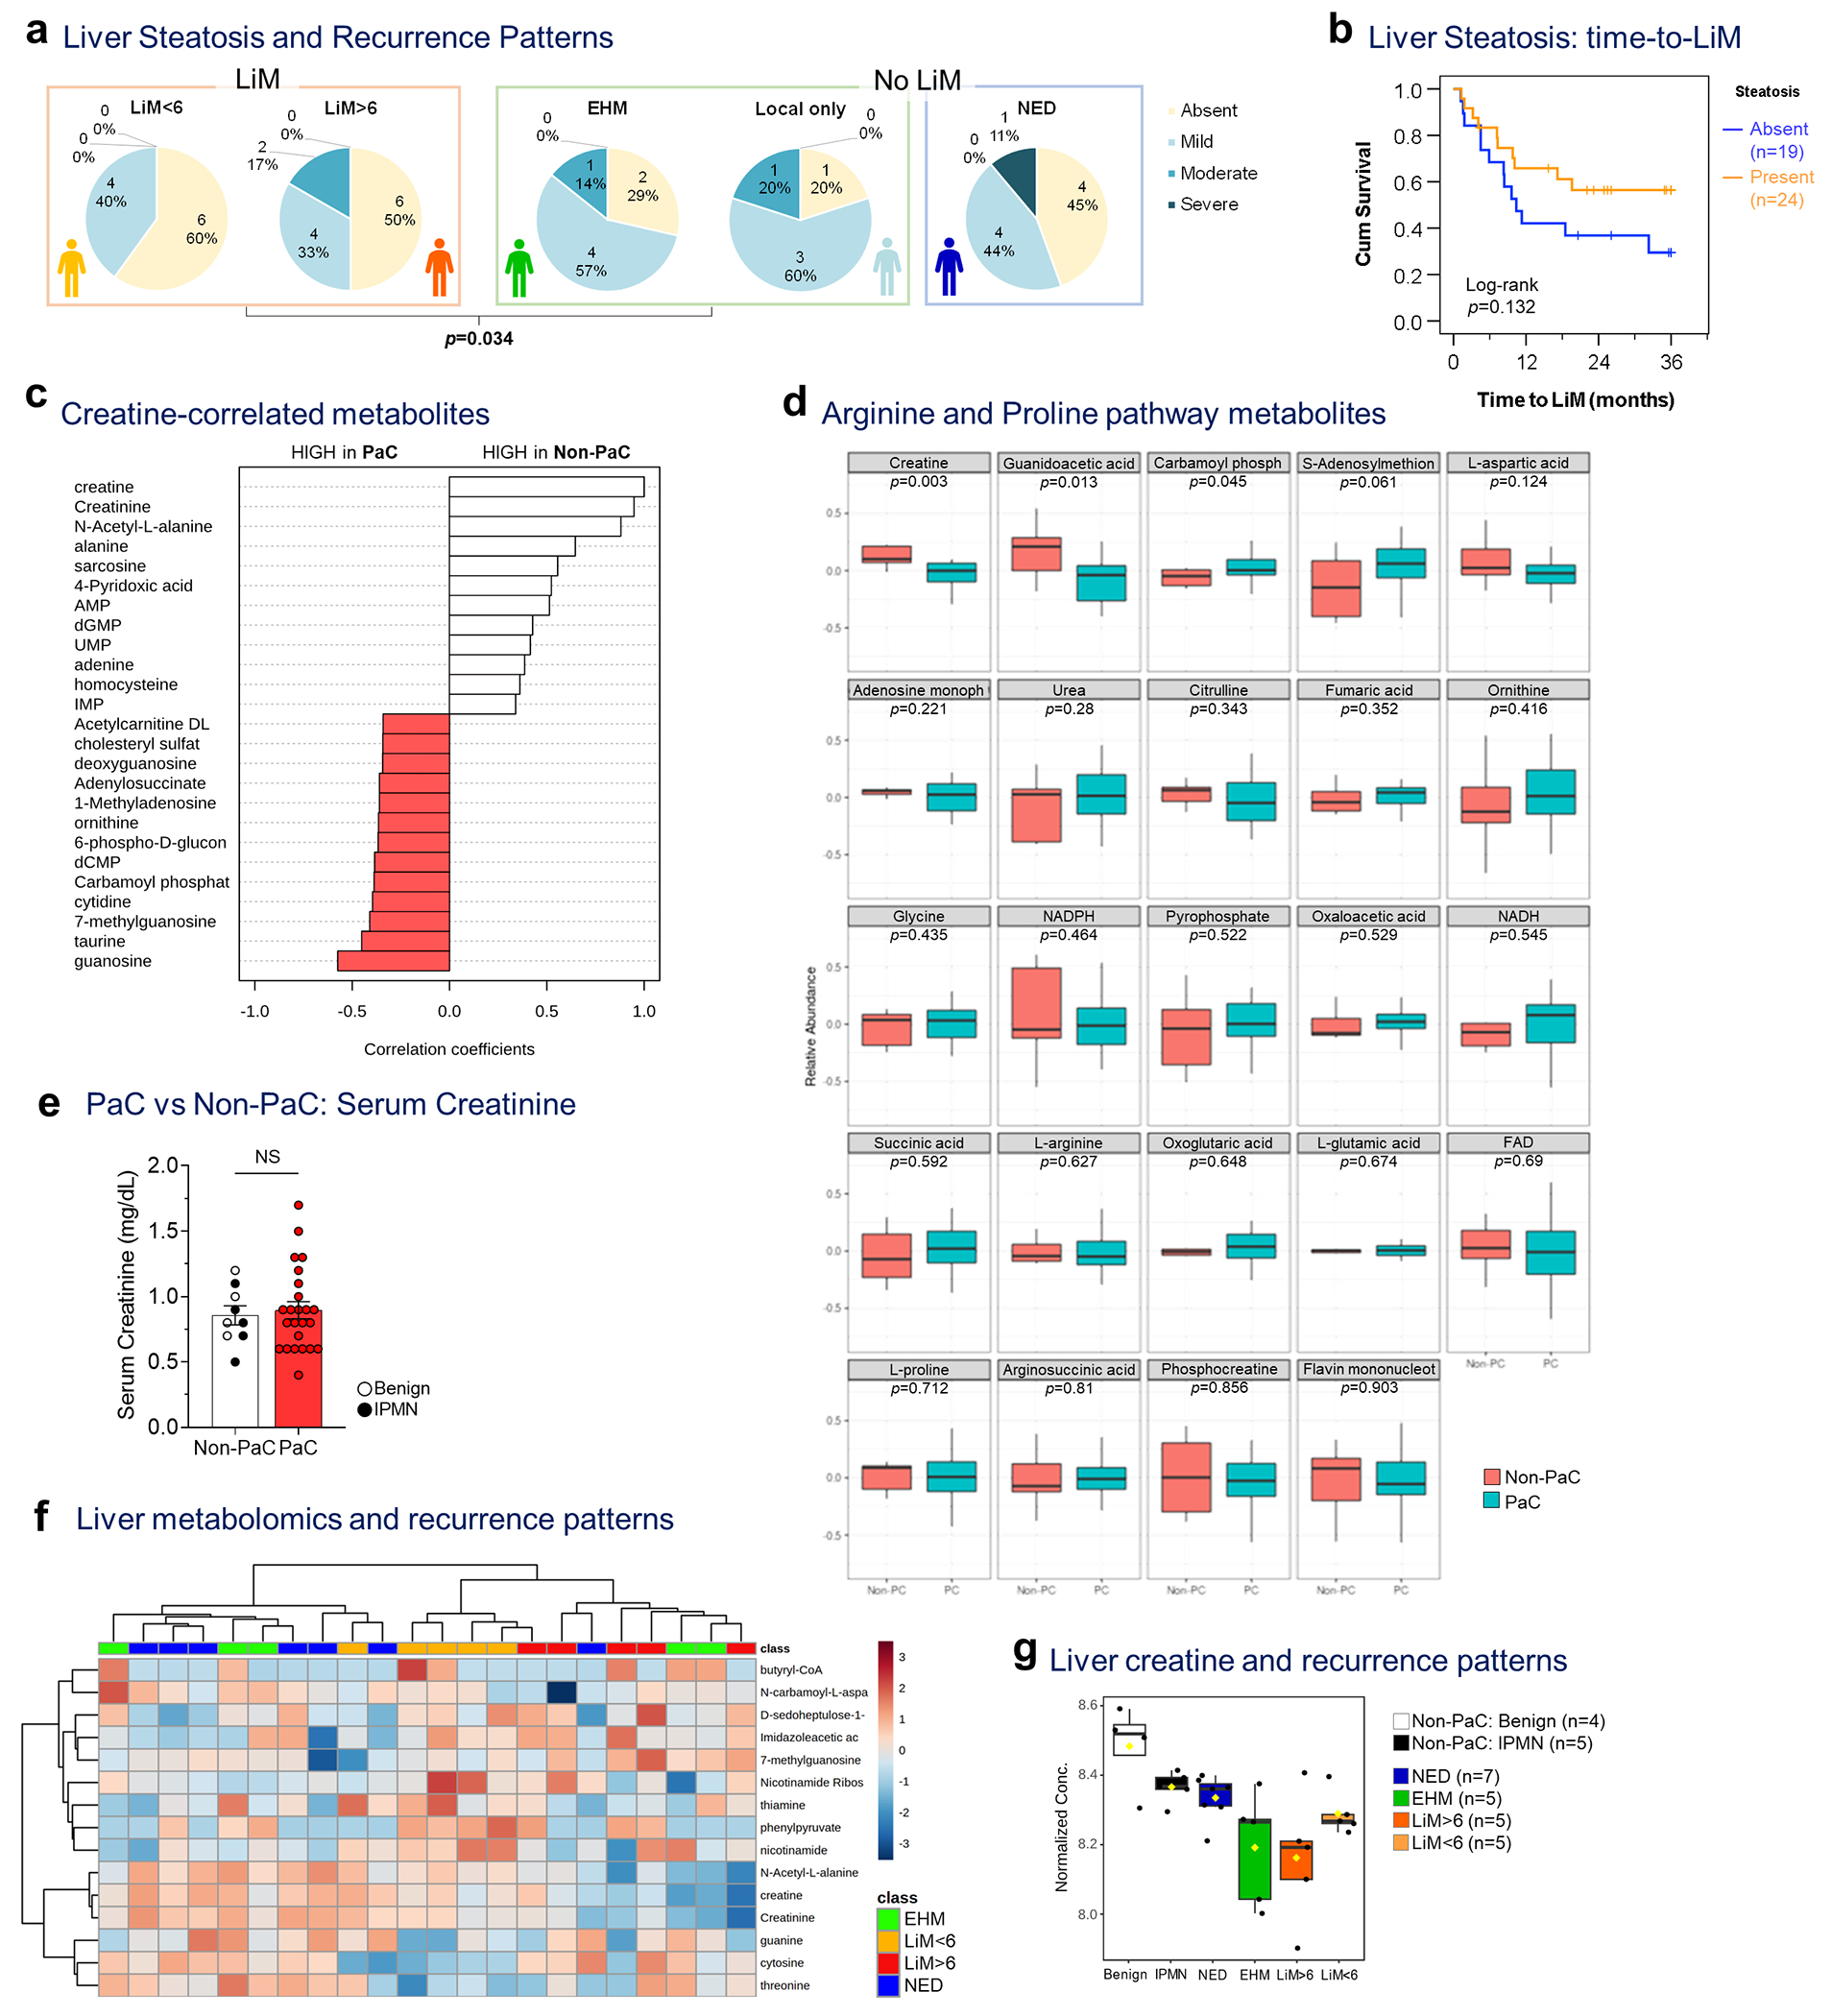
a, Liver steatosis, graded at the time of resection, was examined separately among patients with LiM (LiM<6 and LiM>6), and patients without LiM (either distant EHM or isolated local recurrence) or disease-free during follow-up (NED). Patients who developed LiM had significantly less steatosis compared to those who developed recurrence at other sites (either distant EHM or isolated local recurrence) which correlated with the severity of metastatic pattern (LiM<6 being the worst and isolated local recurrence being the best prognostic group, based on overall survival outcomes [not shown]; Somer’s d test; p=0.034). b, Kaplan-Meier curve of time to LiM in patients with (n=24) or without (n=19) evidence of liver steatosis (Log-rank test). c, Top 25 metabolites correlated with creatine in the pre-metastatic liver and d, expression of metabolites in the arginine/proline pathway (PaC, n=24; Non-PaC, n=9; t- test with correction for multiple comparisons), e, Comparison of serum creatinine levels among patients who underwent liver metabolomic analysis showed no difference (PaC, n=24; Non-PaC, n=9; Mean±SEM; t-test, p=0.680). f, Top 15 metabolites separating the defined recurrence groups (EHM, n=5; LiM<6, n=5; LiM>6, n=5; NED, n=7), including creatine and g, comparison of creatine levels in all analyzed samples (ANOVA; p<0.001, FDR=0.229). Box plots represent Median±IQR, with whiskers at at 95th percentiles.
Extended Data Table 1.
Clinicopathological characteristics of PC patients with different recurrence patterns (N=41#)
| NED | EH only# | LM>6mo | LM<6mo | p value | |||||
|---|---|---|---|---|---|---|---|---|---|
| Patients in group (% all) | 9 | 24% | 9 | 11% | 13 | 20% | 10 | 22% | |
| Male | 6 | 67% | 5 | 56% | 10 | 77% | 6 | 60% | 0.732^1 |
| Age - Median (Range) | 65.1 | (49-83.4) | 71.6 | (58.6-87.0) | 67.5 | (57.8-81.1) | 67.7 | (51.7-77.1) | 0.545^2 |
| BMI - Median (Range) | 27.9 | (24.1-35.0) | 32.1 | (22.3-37.2) | 25.7 | (19.5-39.0) | 25.5 | (20.0-32.4) | 0.317 ^2 |
| Biliary obstruction * | 4 | 44% | 5 | 56% | 7 | 54% | 8 | 80% | 0.426 ^1 |
| Preop. biliary drainage | 4 | 44% | 4 | 44% | 4 | 31% | 4 | 40% | 0.897 ^1 |
| Preop CA19-9 - Median (Range) | 90 | (<1-130) | 147 | (3-463) | 211.5 | (64-1406) | 195 | (35-1132) | 0.368 ^4 |
| Differentiation | 0.020 ^ 4 | ||||||||
| Well | 2 | 22% | 0 | 0% | 0 | 0% | 0 | 0% | |
| Moderate | 5 | 56% | 7 | 78% | 8 | 67% | 4 | 40% | |
| Poor | 2 | 22% | 2 | 22% | 4 | 33% | 6 | 60% | |
| T-stage (per AJCC 8th ed.) | 0.652 ^4 | ||||||||
| 1 (<2cm) | 1 | 11% | 1 | 11% | 0 | 0% | 0 | 0% | |
| 2 (>2 and <4cm) | 6 | 67% | 5 | 56% | 9 | 69% | 8 | 80% | |
| 3(>4cm) | 2 | 22% | 2 | 22% | 4 | 31% | 2 | 20% | |
| 4 (invasion of great vessels) | 0 | 0% | 1 | 11% | 0 | 0% | 0 | 0% | |
| N-stage (per AJCC 8th ed.) | 6 | 67% | 8 | 89% | 8 | 61% | 6 | 60% | 0.286 ^4 |
| 0 (-ve LNs) | 3 | 33% | 1 | 11% | 5 | 39% | 4 | 40% | |
| 1 (1-3 +ve LNs) | 3 | 33% | 2 | 22% | 4 | 31% | 4 | 40% | |
| 2 (>3 +ve LNs) | 3 | 33% | 6 | 67% | 4 | 31% | 2 | 20% | |
| Lymphovascular invasion | 7 | 78% | 3 | 67% | 10 | 77% | 8 | 80% | 0.912 ^1 |
| Perineural invasion | 9 | 100% | 8 | 89% | 13 | 100% | 10 | 100% | ^ 1 |
Patients with isolated local recurrence (n=5) as well as patients with inadequate follow-up (n=3) are not shown.
Biliary obstruction was defined by the presence of either (a) clinical/biochemical (based on abnormal total bilirubin) evidence of jaundice, or (b) preoperative biliary drainage procedure for the relief of biliary obstruction.
Statistical tests:
Pearson’s %;
ANOVA;
Kruskal-Wallis;
Linear-by-Linear Association
Supplementary Material
Acknowledgements
We thank the patients who participated in our study. We thank the research staff of the MSKCC HPB Service and the Rubenstein Center for Pancreatic Cancer Research; the MSKCC Integrated Genomics Core, Flow Cytometry Core, and Microscopy and Molecular Cytology Core and the Institutional Core Grant (CCSG P30 CA008748-53); Hospital for Special Surgery Flow Cytometry Core; the BIDMC Mass Spectrometry Facility, Harvard Medical School; the Epigenomics Core of Weill Cornell Medicine; the WCM Metabolomics Core Facility; the Linköping University Core Facility and Region Östergötland, Departments of Surgery and Pathology. The authors gratefully acknowledge support from: the National Cancer Institute CA224175 (D.L.), CA210240 (D.L.), CA232093 (D.L.), CA163117 and CA207983 (D.L.), CA163120 (D.L.), CA169416 (D.L.), CA169538 (D.L.), CA218513 (D.L., H.Z.) and AI144301 (D.L.), the United States Department of Defense W81XWH-13-1-0425 (D.L.), W81XWH-13-1-0427, W81XWH-13-1-0249 (D.L.), and W81XWH-14-1-0199 (D.L.), National Institutes of Health/WCM CTSC (NIH/NCATS (UL1TR00457) (H.Z.); NIH/NCATS (UL1TR002384) (D.L. and H.Z.)). The Hartwell Foundation (D.L.), the Thompson Family Foundation (D.L. and D.K), the STARR Consortium I9-A9-056 (D.L., H.Z.), and I8-A8-123 (D.L.), the Pediatric Oncology Experimental Therapeutics Investigator’s Consortium (D.L.), Alex’s Lemonade Stand Foundation (D.L.), the Breast Cancer Research Foundation (D.L..), the Feldstein Medical Foundation (D.L.), the Tortolani Foundation (D.L.), the Clinical & Translational Science Center (D.L., H.Z.), the Mary Kay Ash Charitable Foundation (D.L., I.M.), the Malcolm Hewitt Weiner Foundation, the Manning Foundation (D.L., A.H.), the Daniel P. and Nancy C. Paduano Family Foundation, the James Paduano Foundation, the Sohn Foundation, the AHEPA Vth District Cancer Research Foundation, the Daedalus Fund Selma and Lawrence Ruben Science to Industry Bridge Award, Atossa Therapeutics and the Children’s Cancer and Blood Foundation (all to D.L.). The Swedish Cancer Society project grant (21 1824 Pj 01 H), the Swedish Research Society Starting Grant (2021-02356), and the Swedish Society for Medical Research (grant no. S21-0079) (L.B). The Alan and Sandra Gerry Metastasis and Tumor Ecosystems Center of Memorial Sloan Kettering Cancer Center (CPZ), Conquer Cancer Foundation of The American Society of Clinical Oncology (JMH), the National Institutes of Health (R01CA234614 and R01DK121072 to R.E.S.), the United States Department of Defense (W81XWH-21-1-0978 to R.E.S.), and the Paul G. Allen Family Foundation UWSC13448 (to R.E.S.).
Footnotes
Competing interests
D.L. is on the scientific advisory board of Aufbau Holdings Ltd. R.E.S. is on the scientific advisory board of Miromatrix Inc. and Lime Therapeutics and is a speaker and consultant for Alnylam. The other authors declare no competing interests.
Code avaliability
Code used for image quantifications and generation of the prediction models is available at https://github.com/czambir/PC_pml_code. Code used for imaging mass cytometry analysis can be found at https://github.com/ElementoLab/imc, version 0.1.4.
Data availability
Gene expression data has been deposited to the NIH GEO repository and can be accessed as GSE245535 (bulk mRNAseq) and GSE267209 (single cell RNAseq). Cytoscape ClueGO with GO Immune system Process was used for gene clustering (https://apps.cytoscape.org/apps/cluego) and Metascape (https://metascape.org/gp/index.html#/main/step1) was used for gene ontology analysis. Gene set enrichement analysis was performed using the Hallmark gene sets from MSigDB (https://www.gsea-msigdb.org/gsea/msigdb/human/genesets.jsp?collection=H). The LM22 dataset was used for deconvolution of bulk mRNAseq by Cibersortx (matrix provided in Supplementary_Tables_1.xlsx). Metabolomics source data can be accessed in Supplementary_Tables_1.xlsx. Clinical data in this study can be found in Extended Data Table 1, Supplementary Table S1, Supplementary Table S8 and Supplementary Table S11.
References
- 1.Siegel RL, Miller KD, Fuchs HE & Jemal A Cancer statistics, 2022. CA Cancer J. Clin. 72, 7–33 (2022). [DOI] [PubMed] [Google Scholar]
- 2.Zambirinis CP, et al. Recurrence After Resection of Pancreatic Cancer: Can Radiomics Predict Patients at Greatest Risk of Liver Metastasis? Ann. Surg. Oncol. 29, 4962–4974 (2022). [DOI] [PMC free article] [PubMed] [Google Scholar]
- 3.Wangjam T, et al. Resected pancreatic ductal adenocarcinomas with recurrence limited in lung have a significantly better prognosis than those with other recurrence patterns. Oncotarget 6, 36903–36910 (2015). [DOI] [PMC free article] [PubMed] [Google Scholar]
- 4.Bindea G, et al. ClueGO: a Cytoscape plug-in to decipher functionally grouped gene ontology and pathway annotation networks. Bioinformatics 25, 1091–1093 (2009). [DOI] [PMC free article] [PubMed] [Google Scholar]
- 5.Zhou Y, et al. Metascape provides a biologist-oriented resource for the analysis of systems-level datasets. Nat Commun 10, 1523 (2019). [DOI] [PMC free article] [PubMed] [Google Scholar]
- 6.Delgado I, et al. A role for transcription factor E2F2 in hepatocyte proliferation and timely liver regeneration. Am. J. Physiol. Gastrointest. Liver Physiol. 301, G20–31 (2011). [DOI] [PubMed] [Google Scholar]
- 7.Iakova P, Awad SS & Timchenko NA Aging reduces proliferative capacities of liver by switching pathways of C/EBPalpha growth arrest. Cell 113, 495–506 (2003). [DOI] [PubMed] [Google Scholar]
- 8.Zhang C, Sun C, Zhao Y, Ye B & Yu G Signaling pathways of liver regeneration: Biological mechanisms and implications. iScience 27, 108683 (2024). [DOI] [PMC free article] [PubMed] [Google Scholar]
- 9.Gao A, et al. Implications of Sortilin in Lipid Metabolism and Lipid Disorder Diseases. DNA Cell Biol. 36, 1050–1061 (2017). [DOI] [PubMed] [Google Scholar]
- 10.Yabe-Wada T, et al. TLR signals posttranscriptionally regulate the cytokine trafficking mediator sortilin. Sci. Rep. 6, 26566 (2016). [DOI] [PMC free article] [PubMed] [Google Scholar]
- 11.Goodman ZD Grading and staging systems for inflammation and fibrosis in chronic liver diseases. J. Hepatol. 47, 598–607 (2007). [DOI] [PubMed] [Google Scholar]
- 12.Costa-Silva B, et al. Pancreatic cancer exosomes initiate pre-metastatic niche formation in the liver. Nat. Cell Biol. 17, 816–826 (2015). [DOI] [PMC free article] [PubMed] [Google Scholar]
- 13.Grunwald B, et al. Pancreatic Premalignant Lesions Secrete Tissue Inhibitor of Metalloproteinases-1, Which Activates Hepatic Stellate Cells Via CD63 Signaling to Create a Premetastatic Niche in the Liver. Gastroenterology 151, 1011–1024 e1017 (2016). [DOI] [PubMed] [Google Scholar]
- 14.Seubert B, et al. Tissue inhibitor of metalloproteinases (TIMP)-1 creates a premetastatic niche in the liver through SDF-1/CXCR4-dependent neutrophil recruitment in mice. Hepatology 61, 238–248 (2015). [DOI] [PMC free article] [PubMed] [Google Scholar]
- 15.Zheng C, et al. Landscape of Infiltrating T Cells in Liver Cancer Revealed by Single-Cell Sequencing. Cell 169, 1342–1356 e1316 (2017). [DOI] [PubMed] [Google Scholar]
- 16.MacParland SA, et al. Single cell RNA sequencing of human liver reveals distinct intrahepatic macrophage populations. Nat Commun 9, 4383 (2018). [DOI] [PMC free article] [PubMed] [Google Scholar]
- 17.Feig C, et al. Targeting CXCL12 from FAP-expressing carcinoma-associated fibroblasts synergizes with anti-PD-L1 immunotherapy in pancreatic cancer. Proc. Natl. Acad. Sci. U. S. A. 110, 20212–20217 (2013). [DOI] [PMC free article] [PubMed] [Google Scholar]
- 18.Brewitz A, et al. CD8(+) T Cells Orchestrate pDC-XCR1(+) Dendritic Cell Spatial and Functional Cooperativity to Optimize Priming. Immunity 46, 205–219 (2017). [DOI] [PMC free article] [PubMed] [Google Scholar]
- 19.Bottcher JP, et al. NK Cells Stimulate Recruitment of cDC1 into the Tumor Microenvironment Promoting Cancer Immune Control. Cell 172, 1022–1037 e1014 (2018). [DOI] [PMC free article] [PubMed] [Google Scholar]
- 20.Mikulak J, Bruni E, Oriolo F, Di Vito C & Mavilio D Hepatic Natural Killer Cells: Organ-Specific Sentinels of Liver Immune Homeostasis and Physiopathology. Front. Immunol. 10, 946 (2019). [DOI] [PMC free article] [PubMed] [Google Scholar]
- 21.Krueger PD, Lassen MG, Qiao H & Hahn YS Regulation of NK cell repertoire and function in the liver. Crit. Rev. Immunol. 31, 43–52 (2011). [DOI] [PMC free article] [PubMed] [Google Scholar]
- 22.Dominguez Conde C, et al. Cross-tissue immune cell analysis reveals tissue-specific features in humans. Science 376, eabl5197 (2022). [DOI] [PMC free article] [PubMed] [Google Scholar]
- 23.Newman AM, et al. Robust enumeration of cell subsets from tissue expression profiles. Nature methods 12, 453–457 (2015). [DOI] [PMC free article] [PubMed] [Google Scholar]
- 24.Adrover JM, McDowell SAC, He XY, Quail DF & Egeblad M NETworking with cancer: The bidirectional interplay between cancer and neutrophil extracellular traps. Cancer Cell 41, 505–526 (2023). [DOI] [PMC free article] [PubMed] [Google Scholar]
- 25.Aiello NM, et al. Metastatic progression is associated with dynamic changes in the local microenvironment. Nat Commun 7, 12819 (2016). [DOI] [PMC free article] [PubMed] [Google Scholar]
- 26.Connolly MK, et al. Distinct populations of metastases-enabling myeloid cells expand in the liver of mice harboring invasive and preinvasive intra-abdominal tumor. J. Leukoc. Biol. 87, 713–725 (2010). [DOI] [PMC free article] [PubMed] [Google Scholar]
- 27.Liu Y & Cao X Characteristics and Significance of the Pre-metastatic Niche. Cancer Cell 30, 668–681 (2016). [DOI] [PubMed] [Google Scholar]
- 28.Peinado H, et al. Pre-metastatic niches: organ-specific homes for metastases. Nat. Rev. Cancer 17, 302–317 (2017). [DOI] [PubMed] [Google Scholar]
- 29.Pommier A, et al. Unresolved endoplasmic reticulum stress engenders immune-resistant, latent pancreatic cancer metastases. Science 360(2018). [DOI] [PMC free article] [PubMed] [Google Scholar]
- 30.Lochner M, Berod L & Sparwasser T Fatty acid metabolism in the regulation of T cell function. Trends Immunol. 36, 81–91 (2015). [DOI] [PubMed] [Google Scholar]
Methods-only References
- 31.Ibrahim J, et al. Dendritic cell populations with different concentrations of lipid regulate tolerance and immunity in mouse and human liver. Gastroenterology 143, 1061–1072 (2012). [DOI] [PMC free article] [PubMed] [Google Scholar]
- 32.Henning JR, et al. Dendritic cells limit fibroinflammatory injury in nonalcoholic steatohepatitis in mice. Hepatology 58, 589–602 (2013). [DOI] [PMC free article] [PubMed] [Google Scholar]
- 33.Sutti S & Albano E Adaptive immunity: an emerging player in the progression of NAFLD. Nature reviews. Gastroenterology & hepatology 17, 81–92 (2020). [DOI] [PMC free article] [PubMed] [Google Scholar]
- 34.Wang G, et al. Tumour extracellular vesicles and particles induce liver metabolic dysfunction. Nature 618, 374–382 (2023). [DOI] [PMC free article] [PubMed] [Google Scholar]
- 35.Di Biase S, et al. Creatine uptake regulates CD8 T cell antitumor immunity. J. Exp. Med. 216, 2869–2882 (2019). [DOI] [PMC free article] [PubMed] [Google Scholar]
- 36.Geroldinger A, Lusa L, Nold M & Heinze G Leave-one-out cross-validation, penalization, and differential bias of some prediction model performance measures-a simulation study. Diagn Progn Res 7, 9 (2023). [DOI] [PMC free article] [PubMed] [Google Scholar]
- 37.Allen PJ, et al. Pasireotide for postoperative pancreatic fistula. N. Engl. J. Med. 370, 2014–2022 (2014). [DOI] [PubMed] [Google Scholar]
- 38.Attiyeh MA, et al. CT radiomics associations with genotype and stromal content in pancreatic ductal adenocarcinoma. Abdom Radiol (NY) 44, 3148–3157 (2019). [DOI] [PMC free article] [PubMed] [Google Scholar]
- 39.Berg S, et al. ilastik: interactive machine learning for (bio)image analysis. Nature methods 16, 1226–1232 (2019). [DOI] [PubMed] [Google Scholar]
- 40.Van Valen DA, et al. Deep Learning Automates the Quantitative Analysis of Individual Cells in Live-Cell Imaging Experiments. PLoS Comput. Biol. 12, e1005177 (2016). [DOI] [PMC free article] [PubMed] [Google Scholar]
- 41.Wolf FA, Angerer P & Theis FJ SCANPY: large-scale single-cell gene expression data analysis. Genome Biol. 19, 15 (2018). [DOI] [PMC free article] [PubMed] [Google Scholar]
- 42.Virshup I, Rybakov S, Theis FJ, Angerer P & Wolf FA anndata: Annotated data. bioRxiv, 2021.2012.2016.473007 (2021). [Google Scholar]
- 43.Korsunsky I, et al. Fast, sensitive and accurate integration of single-cell data with Harmony. Nature methods 16, 1289–1296 (2019). [DOI] [PMC free article] [PubMed] [Google Scholar]
- 44.Traag VA, Waltman L & van Eck NJ From Louvain to Leiden: guaranteeing well-connected communities. Sci. Rep. 9, 5233 (2019). [DOI] [PMC free article] [PubMed] [Google Scholar]
- 45.Kim J, et al. Unsupervised discovery of tissue architecture in multiplexed imaging. Nature methods 19, 1653–1661 (2022). [DOI] [PMC free article] [PubMed] [Google Scholar]
- 46.Yuan M, Breitkopf SB, Yang X & Asara JM A positive/negative ion-switching, targeted mass spectrometry-based metabolomics platform for bodily fluids, cells, and fresh and fixed tissue. Nat. Protoc. 7, 872–881 (2012). [DOI] [PMC free article] [PubMed] [Google Scholar]
- 47.Chong J, et al. MetaboAnalyst 4.0: towards more transparent and integrative metabolomics analysis. Nucleic Acids Res. 46, W486–W494 (2018). [DOI] [PMC free article] [PubMed] [Google Scholar]
- 48.Risso D, Perraudeau F, Gribkova S, Dudoit S & Vert JP A general and flexible method for signal extraction from single-cell RNA-seq data. Nat Commun 9, 284 (2018). [DOI] [PMC free article] [PubMed] [Google Scholar]
- 49.Peng H, Long F & Ding C Feature selection based on mutual information: criteria of max-dependency, max-relevance, and min-redundancy. IEEE Trans Pattern Anal Mach Intell 27, 1226–1238 (2005). [DOI] [PubMed] [Google Scholar]
Associated Data
This section collects any data citations, data availability statements, or supplementary materials included in this article.
Supplementary Materials
Data Availability Statement
Gene expression data has been deposited to the NIH GEO repository and can be accessed as GSE245535 (bulk mRNAseq) and GSE267209 (single cell RNAseq). Cytoscape ClueGO with GO Immune system Process was used for gene clustering (https://apps.cytoscape.org/apps/cluego) and Metascape (https://metascape.org/gp/index.html#/main/step1) was used for gene ontology analysis. Gene set enrichement analysis was performed using the Hallmark gene sets from MSigDB (https://www.gsea-msigdb.org/gsea/msigdb/human/genesets.jsp?collection=H). The LM22 dataset was used for deconvolution of bulk mRNAseq by Cibersortx (matrix provided in Supplementary_Tables_1.xlsx). Metabolomics source data can be accessed in Supplementary_Tables_1.xlsx. Clinical data in this study can be found in Extended Data Table 1, Supplementary Table S1, Supplementary Table S8 and Supplementary Table S11.


