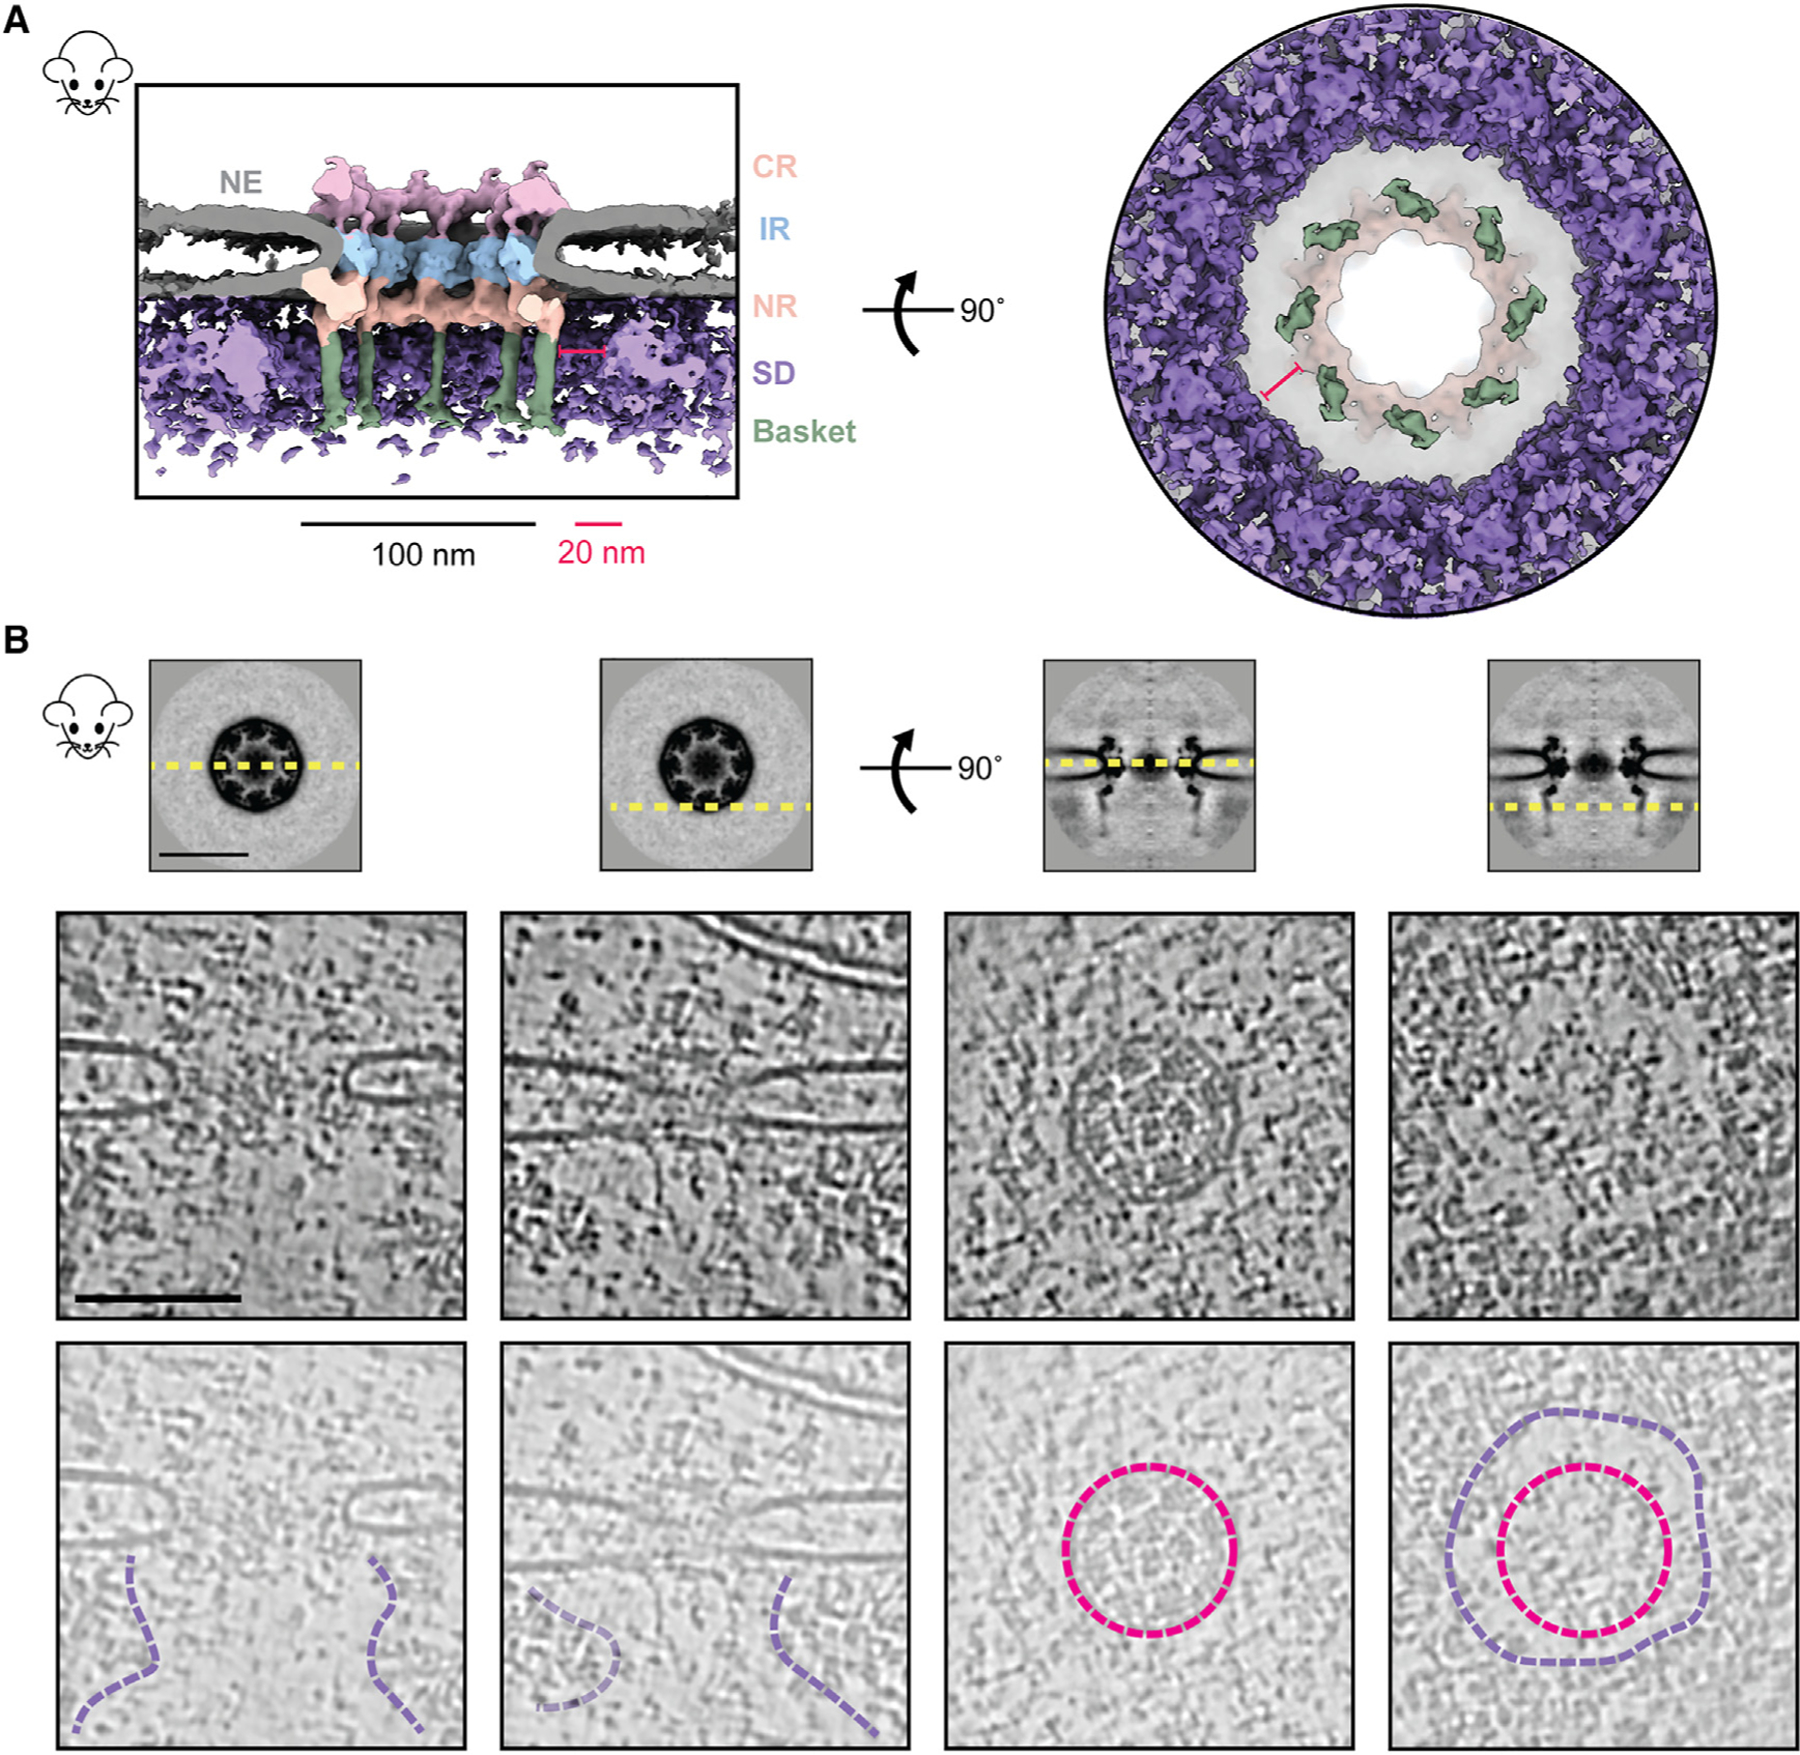
Figure 2. Direct observation of the heterochromatin exclusion zone around the mNPC.

(A) The cross-sectional (left) and nucleoplasmic view (right) of the C8-symmetrized average map of mNPC shows that molecular crowding (via surrounding densities [SDs]) around the mNPC is absent in the immediate vicinity of the basket (~20 nm).
(B) Tomogram slices of different regions around the NPC show the extent of this exclusion zone. Top: slices of the mNPC average used to depict viewing planes (yellow, dashed) in tomogram slices below. Middle and bottom: tomogram slices of an mNPC viewed parallel (left) and perpendicular (right) to the plane of the NE, as depicted in the top panel. Tomogram slices are duplicated in the bottom row to show annotated views. Lumenal rings (pink) and boundaries of the exclusion zone (purple) are indicated. CR, cytoplasmic ring; IR, inner ring; NR, nuclear ring; NE, nuclear envelope; SDs, surrounding densities. Scale bars, 100 nm unless stated otherwise.
See also Figure S3.
