

Abstract
Objective
Lipomatous hypertrophy of the interatrial septum (LHIS) is a distinct section of epicardial adipose tissue. However, its association with COPD is poorly documented.
Methods
Patients undergoing coronary computed tomography angiography (CTA) for clinical indications were recruited retrospectively and screened for LHIS and COPD. LHIS density and the coronary artery disease profile were quantified by CTA: stenosis severity (coronary artery disease radiological reporting system (CADRADS)), coronary artery calcium (CAC) and high-risk plaque (HRP). COPD patients with LHIS were matched for age and sex, the major cardiovascular risk factors (CVRFs), and compared to controls.
Results
The prevalence of LHIS in all 5466 patients was 5.9%. 151 (72.6%) of 208 patients with COPD had LHIS. LHIS density in COPD patients was higher (−10.93 HU versus −21.1 HU; p<0.001), despite body mass index (BMI) (28.8 versus 27.01 kg·m−2; p=0.002) being lower. LHIS density was lower in obese (BMI >30 kg·m−2) patients (20.4 versus 13.6 HU; p=0.02). BMI was inversely correlated with LHIS density (BetaR −0.031; 95% CI: −0.054– −0.008; p=0.007). LHIS density was associated with COPD, but not with BMI on multivariate models. CAC and coronary stenosis severity (CADRADS and >50% stenosis) were not different (p=0.106, p=0.156 and p=0.350, respectively). HRPs were observed more frequently in COPD patients with severe Global Initiative for Chronic Obstructive Lung Disease (GOLD) stages ≥2 (32.3% versus 20.1%; p=0.044), but not when adding mild GOLD stages.
Conclusions
The prevalence of LHIS in COPD patients is high (72.6%), and the adipose tissue density is higher, indicating a higher brown fat component. In obese, patients LHIS density is lower and declines along with BMI. Coronary stenosis severity and calcium were not different; however HRPs were more frequent in severe COPD.
Shareable abstract
LHIS has a high prevalence in COPD patients and higher density, suggestive for brown adipose tissue. Further research is required to explore LHIS as imaging biomarker of epicardial adipose tissue. https://bit.ly/4a42tjS
Introduction
COPD is a chronic inflammatory disease affecting ∼12% of the general population [1], and is currently the third leading cause of death worldwide. Global Initiative for Chronic Obstructive Lung Disease (GOLD) 2023 defines COPD as a “heterogeneous lung condition characterised by chronic respiratory symptoms (dyspnoea, cough, expectoration, exacerbations) due to abnormalities of the airways (bronchitis, bronchiolitis) and/or alveoli (emphysema) that cause persistent, often progressive, airflow obstruction.” [2]. It is commonly underdiagnosed in the general population, which poses a challenge for future treatment, as airflow limitation tends to progress over time leading to systemic adverse effects. COPD patients may have sudden worsening in airway function and respiratory symptoms, referred to as exacerbations of COPD (AECOPD), which require immediate treatment and sometimes hospitalisation.
Lessons for clinicians
• Our study adds novel insights into pericardial adipose tissue biomarkers predicting cardiovascular risk, with regard to COPD patients, revealing lipomatous hypertrophy of the interatrial septum (LHIS) as a distinct section of the epicardial adipose tissue (EAT) with higher density. • Further research is required to explore LHIS as part of the EAT and its role as imaging biomarker in different subpopulations, as well as its association with clinical outcomes.
COPD may coexist with other diseases, especially cardiovascular diseases such as coronary artery disease (CAD), with a prevalence ranging from 20% to 70% [1]. COPD is frequently associated with other comorbidities such as diabetes, atrial fibrillation, sleep apnoea or lung cancer.
Pericardial adipose tissue components are promising novel biomarkers for the prediction of cardiovascular outcomes [3, 4]. >30 studies and meta-analyses have demonstrated associations with cardiovascular outcomes such as myocardial infarction, coronary revascularisation, atrial fibrillation and cardiac death [5]. Most recently, the UK biobank cohort has linked epicardial adipose tissue (EAT) with diabetes, heart failure and CAD independent of the body mass index (BMI) in 44 725 participants. Variations in EAT were influenced by genes regulating adipocyte morphology, including brown-fat genesis, and the conclusion was that EAT indicates a metabolic “unhealthy” phenotype [5].
EAT is increased in COPD patients as recently reported in a meta-analysis [6], along with markers of systemic inflammation. Lipomatous hypertrophy of the interatrial septum (LHIS) is a distinct section of the EAT with an estimated prevalence of between 1% and 8% [7]. Only two studies with very small sample sizes [8, 9] have reported a borderline association of emphysema (p<0.0377) with LHIS, both of which are underpowered.
The prevalence of LHIS in COPD patients, and its association with CAD, is poorly understood and not well documented in the literature. Coronary computed tomography angiography (CTA) is the modality of choice for the evaluation of coronary stenosis severity, coronary calcium burden and high-risk plaque (HRP) characterisation [10].
Therefore, the purpose of our study was to: 1) report the prevalence of LHIS in COPD patients; 2) characterise LHIS tissue density with regard to its potential as a pericardial imaging biomarker in COPD patients compared to controls; and 3) compare the CAD profile by CTA (stenosis severity, calcium burden and HRP).
Materials and methods
Study design and population
Patients who underwent ECG-gated coronary computed tomography (CT) angiography for clinical indications were included in this retrospective cohort study. Institutional review board approval was obtained.
Inclusion criteria
Patients who had been referred for coronary CTA because of suspected CAD and low-to-intermediate pre-test probability [11] according to European Society Cardiology (ESC) 2019 guidelines were included; they were mainly recruited from ambulatory care under a cardiologist (>80%), and the rest were hospitalised patients (<20%) or those with other clinical indications (i.e. prior percutaneous coronary intervention (PCI)/stent, coronary artery bypass graft surgery or others).
Patients were screened for LHIS, as reported in a clinical standardised radiology report. Further, patients were screened for COPD – with a verified diagnosis from our hospital clinical system (KIS) according to clinical symptoms (dyspnoea), spirometry and chest CT, and staged using GOLD criteria [1]. Controls were recruited after a clinical exam from a board-certified internal medicine specialist involving a detailed record of clinical symptoms (including the exclusion of dyspnoea) and the absence of emphysema and other evident CT signs of COPD (such as bronchiectasis, fibrotic alterations) on a full field of view chest CT scan.
Computed tomography
Coronary artery calcium (CAC) score: A non-contrast ECG-gated CT scan with standardised scan parameters (detector collimation 64×1.5 mm; 120 kV; image reconstruction: 3 mm slice width, increment 1.5) and prospective ECG-triggering was performed. The Agatston score (Agatston units) [12] was calculated for all coronary arteries (SyngoVIA; Siemens Healthineers, Erlangen, Germany).
Coronary CTA: This was performed by using 128-slice dual-source CT (Definition FLASH or DRIVE; Siemens Healthineers) with a detector collimation of 2×64×0.6 mm and a rotation time of 0.28 s, acquiring 128 slices with z-flying spot. Scans were triggered into the arterial phase using bolus tracking and by injecting an intravenous iodine contrast agent (Iopromide, Ultravist 370; Bayer Healthcare, Berlin, Germany). Prospective ECG-triggering (<65 bpm) or retrospective ECG-gating (>65 bpm or arrhythmia) was performed depending on heart rate.
Axial thin-slice images with best image quality in the diastolic and systolic phase were reconstructed with a 0.75 mm slice width (increment 0.4) and transferred to 3D postprocessing software (SyngoVIA; Siemens Healthineers).
Axial multiplanar reformations (MPRs) were used to quantify the following pericardial fat volume compartments (figure 1):
FIGURE 1.

Lipomatous hypertrophy of the interatrial septum (LHIS). a) 3D volume rendering technique (VRT) and b) axial multiplanar reformations (MRP) was used for quantification of computed tomography density (HU) and size measurement (width).
LHIS: was defined as mass-like lipomatous tissue infiltration of the entire interatrial septum from cranial to caudal, sparing the fossa ovalis, with a “dumb-bell” configuration.
The maximal width was identified on axial images and measured with a digital caliper.
CT density: a circular region of interest (ROI) was placed into the area of maximal LHIS width, and drawn as large as possible.
When placing the ROI, care was taken to avoid artefacts (such as motion blurring) or dense structures such as fibrous bands or microvessels.
EAT density: An ROI was placed into the right and the left EAT compartment (mid-section) and the right and left paracardial adipose tissue (PAT) sections. The mean of right and left measurements was calculated.
Coronary CTA image analysis
Curved multiplanar reformations (cMPR) and oblique interactive MPR using client-server-based 3D postprocessing software (SyngoViaTM; Siemens Healthineers) were generated and the following outcome measures evaluated:
Coronary stenosis severity was scored visually according to CAD-RADSTM [13] score (0–5) as: minimal (1) <25%, mild (2) 25–49.9%, moderate (3) 50–69.9%, severe (4) ≥70%–99% and occluded (5) 100% on a per-coronary segment-base (AHA-modified 17-segment classification); this was assisted by quantitative stenosis measurement using cMPR.
- HRP analysis was performed according to the four coronary artery disease radiological reporting system (CADRADS)/HRP criteria [13]:
- Low-attenuation plaque (LAP) was defined as hypoattenuating lesion with <150 Hounsfield units (HU). CT density was screened with the “pixel lens”, and the lowest Hounsfield unit value was recorded [14]. LAP <30 HU was defined as lipid-rich necrotic core (10), and LAP<60 HU as fibrofatty.
- Napkin-ring sign was defined as an outer high-density rim with an inner hypodense area [15].
- Spotty calcification was defined as a calcification of <3 mm in size.
- Positive remodelling was defined as a remodelling index of >1.1.
A patient was labelled as having “HRP” if a minimum of two criteria were present, and if at least one LAP <30 HU or LAP <60 HU was present per patient.
Coronary CTA analysis was performed by either one highly experienced reader (>10 years’ experience of cardiac CT) or one less experienced observer (>1 year of radiology training) in consensus.
Major traditional cardiovascular risk factors (CVRFs) were collected and defined according to standardised ESC criteria: arterial hypertension (systolic blood pressure (BP) >140 mmHg or diastolic BP >90 mmHg), dyslipidaemia, positive family history (myocardial infarction or sudden cardiac death in an immediate male relative <55 years or female <65 years), smoker (active: current or quit <6 months before coronary CTA examination and former) and diabetes [16–18].
Statistical analysis
Statistical analysis was performed using SPSS™ software (V29.0; SPSS Inc., Chicago, IL, USA). Quantitative variables are expressed as mean±sd or as median (IQR), and categorical variables as absolute values and percentages. The normal distribution of data was tested with histogram and the Kolmogorov test.
Spearman correlation coefficient was determined for correlation of LHIS tissue CT density (HU) with CT plaque density and BMI, and linear regression analysis was performed.
The independent t-test was applied to test for differences in normally distributed data (e.g., LHIS density (HU), age), and the Mann–Whitney U-test was applied to test for non-normally distributed data (CAC, CADRADS, BMI and LHIS width).
Chi-square test was used to investigate differences in categorical data (e.g., sex, major CVRFs) and Fisher's exact test if the counts per field were <5 (death rate).
LHIS density was tested between obese and non-obese (BMI cut-offs of >25 kg·m−2 for overweight and 30 kg·m−2 for obese). A two-sided p-value of ≤0.05 was defined as significant.
Binary logistic multivariate regression models were generated – Model 1 (end-point COPD), covariates: LHIS density (HU) and BMI; Model 2 (end-point COPD), covariates: LHIS HU, BMI, age and CAC; Model 3 (end-point LHIS yes/no), covariates: BMI, COPD and age; Model 4+5, significantly different CVRF (end-point COPD): Model 4, covariates: age, smoking and BMI; Model 5, covariates: smoking, BMI, positive family history.
Results
5466 consecutive patients referred for coronary CTA for clinical indications were screened for LHIS and COPD. The patient profile is shown in table 1. The prevalence of LHIS in all patients (without COPD) was 5.9% (324 out of 5466). In 208 patients with COPD, the prevalence of LHIS was markedly higher in 151 (72.6%) (p<0.001). The majority of COPD patients (148, 98%) had GOLD ≥stage 2. The characteristics of patients included in the study with LHIS and complete data are shown in table 1. The 151 patients with COPD were matched for age and sex with 151 controls. Table 2 shows the differences in LHIS characteristics and the CAD profile by CTA between COPD patients and controls, and the differences in CVRFs. The major CVRFs (arterial hypertension, dyslipidaemia, diabetes) were balanced in both groups. The prevalence of obesity (BMI >30 kg·m−2) was not different between both groups. There were more smokers in the COPD cohort (p<0.001) but fewer patients with a positive family history (p<0.001).
TABLE 1.
Patient characteristics
| Patients with LHIS (n=302) | |
| Age (years) | 63.3±9.1 |
| Female | 116 (38.4) |
| BMI (kg·m−2) | 27.9±5.1 |
| Overweight or obese (BMI >25 kg·m−2) | 209 (69.2) |
| Obese (BMI >30 kg·m−2) | 98 (32.4) |
| Smoking | 204 (67.6) |
| Arterial hypertension | 177 (58.6) |
| Positive family history | 101 (33.4) |
| Dyslipidaemia | 177 (58.6) |
| Diabetes | 73 (24.2) |
| COPD | 151 (50) |
| GOLD stage 2+3+4, n | 148 |
|
GOLD stage 1+0, n# FEV1 % |
3 52.5±17.8 |
| Screening cohort (n=5466) ¶ | |
| Age (years) | 59.7±11.4 |
| Female | 2264 (41.4) |
| BMI (kg·m−2) | 28.1±17.8 |
| Smoking | 2475 (45.2) |
| Arterial hypertension | 3125 (57.2) |
| Positive family history | 2287 (41.8) |
| Dyslipidaemia | 3411 (62.4) |
| Diabetes | 678 (12.3) |
Parametric variables are expressed as mean±sd, categorical variables as absolute values (n) and percentages (%). LHIS: lipomatous hypertrophy of the interatrial septum; BMI: body mass index; GOLD: Global Initiative for Chronic Obstructive Lung Disease; FEV1: forced expiratory volume in 1 s. #: one patient with GOLD 0 had evident signs of COPD (severe destructive emphysema) on computed tomography; ¶: all patients who underwent computed tomography angiography.
TABLE 2.
COPD patients with LHIS compared to controls with LHIS (n=302)
| COPD | Controls | p-value | |
|---|---|---|---|
| Patients (n) | 151 | 151 | |
| LHIS (HU) | −10.93±24.6 | −21.1±25.1 | <0.001 |
| LHIS width (mm) | 7.2±2.7 | 6.7±2.8 | 0.009 |
| Age (years) | 63.2±8.1 | 63.6±10.1 | 0.712 |
| Female | 57 (37.8) | 62 (41.1) | 0.637 |
| BMI (kg·m−2) | 27.01±4.8 | 28.8±5.2 | 0.001 |
| Smoking (%) | 84.7 | 45.9 | <0.001 |
| Arterial hypertension (%) | 61.3 | 55.5 | 0.453 |
| Positive family history (%) | 21.4 | 44.5 | <0.001 |
| Dyslipidaemia (%) | 55.3 | 63.1 | 0.296 |
| Diabetes (%) | 27.9 | 18.3 | 0.198 |
| Overweight | |||
| Overweight, BMI >25 kg·m−2 | 92 (60.9) | 117 (77.5) | 0.003 |
| Obese, BMI >30 kg·m−2 | 41 (27.1) | 57 (37.7) | 0.065 |
| Atrial fibrillation | 14 (9.3) | 15 (9.9) | 0.999 |
| Coronary artery disease profile by CTA | |||
| HRP prevalence | |||
| GOLD ≥2 (n=147) (%) | 32.3 | 20.1 | 0.044 |
| All GOLD stages (%) | 31.3 | 24.8 | 0.192 |
| CAC score (AU), median (IQR) | 78.9 (343.3) | 34.7 (266.8) | 0.106 |
| CADRADS | |||
| Mean | 2.47 | 2.21 | 0.156 |
| Median | 2.0 | 2.0 | |
| 0 (n) | 15 | 25 | |
| 1 (n) | 20 | 15 | |
| 2 (n) | 33 | 39 | |
| 3 (n) | 23 | 22 | |
| 4 (n) | 42 | 36 | |
| 5 (n) | 2 | 0 | |
| S/G/N | 18 | 14 | |
| Obstructive CAD (>50% stenosis) | 67 (44.3) | 58 (38.4) | 0.350 |
Parametric variables are expressed as mean±sd, categorical variables as absolute values (n) and percentages (%). LHIS: lipomatous hypertrophy of the interatrial septum; HU: Hounsfield units; BMI: body mass index; CTA: computed tomography angiography; HRP: high-risk plaque; GOLD: Global Initiative for Chronic Obstructive Lung Disease; CAC: coronary artery calcium; IQR: interquartile range; CADRADS: Coronary Artery Disease Radiological Reporting System (stenosis severity); S: stent; G: coronary artery bypass graft; N: nondiagnostic or not-performed (e.g. Calcium Score only). Bold indicates statistical significance.
The CT density (HU) of LHIS (figure 1) was significantly higher in COPD patients (−10.93 HU versus −21.1 HU, p<0.001) (figure 2a) despite lower mean BMI (28.8 versus 27.01 kg·m−2; p=0.002).
FIGURE 2.

a) Computed tomography (CT) density of lipomatous hypertrophy of the interatrial septum (LHIS) (HU) was higher in COPD patients compared to controls (p<0.001) indicating a higher brown adipose tissue (BAT) component. b) CT density of LHIS (HU) in COPD patients with obesity (body mass index (BMI) >30 kg·m−2) was lower than in non-obese patients (p=0.02).
LHIS density (HU) was significantly lower in obese patients with a BMI over 30 kg·m−2 (20.4±22.7 versus 13.6±25.5 HU) (p=0.02) (figure 2b and table 2), but no difference was found for a BMI cut-off of 25 kg·m−2 (p=0.198).
Multivariate regression Model 1 showed a significant association of both BMI and LHIS density (HU) with COPD, while BMI was less strongly associated (OR 0.94, 95% CI: 0.896–0.985; p=0.01) than LHIS density (HU) (OR 1.01, 95% CI: 1.005–1.025; p=0.003). After adjusting for age and CAC score, BMI lost the significance (OR 0.95, 95% CI: 0.907–1.004); p=0.072), but only LHIS density (HU) (OR 1.02, 95% CI: 1.005–1.026; p=0.005) remained associated.
Model 3 (table 3) illustrates the relationship between the prevalence of LHIS, BMI, age and COPD: BMI was not significantly associated with LHIS (OR 1.0, p=0.681), only age and COPD were (OR 1.02 and OR 9.13, respectively; both p<0.001).
TABLE 3.
Multivariate regression Model 3: association of COPD, BMI and age with the prevalence of LHIS
| Odds ratio (95% CI) | p-value | |
|---|---|---|
| BMI | 1.00 (0.994–1.010) | 0.681 |
| COPD | 9.13 (6.325–13.172) | <0.001 |
| Age | 1.03 (1.017–1.048) | <0.001 |
LHIS: lipomatous hypertrophy of the interatrial septum; BMI: body mass index.
A weak but significant inverse correlation of BMI with LHIS density (HU) was found (r= −0.113, p=0.047) and a significant association on linear regression analysis (BetaR: −0.031, 95% CI: −0.054– −0.008; p<0.007) (figure 3).
FIGURE 3.
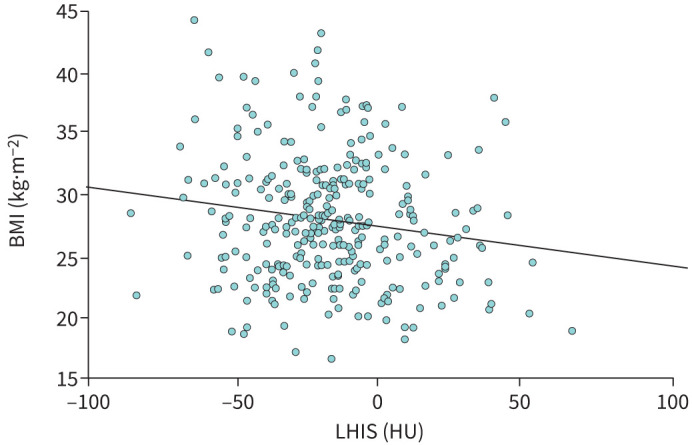
Linear regression analysis: body mass index (BMI) was inversely correlated with lipomatous hypertrophy of the interatrial septum (LHIS) density (HU) (BetaR −0.031, 95% CI: −0.054– −0.008; p=0.007).
Model 5 (table 4) shows that after adjusting for the significantly different CVRFs between the COPD and control group, BMI was no longer significant (p=0.825); only smoking and LHIS density (HU) (p<0.001) remained strongly associated, and positive family history (p=0.003, however with an OR of <1.0).
TABLE 4.
Model 5: smoking and LHIS density (HU) were significantly associated with COPD, but not BMI
| Odds ratio (95% CI) | p-value | |
|---|---|---|
| BMI | 1.00 (0.940–1.081) | 0.825 |
| Smoking | 8.52 (3.798–19.107) | <0.001 |
| LHIS (HU) | 1.03 (1.012–1.043) | <0.001 |
| Positive family history | 0.34 (0.165–0.698) | 0.003 |
LHIS: lipomatous hypertrophy of the interatrial septum; BMI: body mass index; HU: Hounsfield units.
Figure 4 shows the CT images and quantification of LHIS CT density in an obese 71-year-old female without COPD, and in a 73-year-old male with COPD.
FIGURE 4.

a) Obese, 71-year-old female (body mass index (BMI) 29.9 kg·m−2), no COPD: lower lipomatous hypertrophy of the interatrial septum (LHIS) computed tomography (CT) density (−24.1 HU) indicating a higher white adipose tissue (WAT) component. b) Non-obese, 73-year-old male (BMI 21.1 kg·m−2), severe COPD GOLD stage 2: higher LHIS CT density (+13.9 HU) suggestive of more brown adipose tissue (BAT). GOLD: Global Initiative for Chronic Obstructive Lung Disease.
Table 2 shows the CAD profile by CTA. CAC score and coronary stenosis severity (CADRADS) were not different among all patients with COPD (p=0.106 and p=0.156). Obstructive coronary disease (>50% stenosis) rates were not different (44.3% versus 38.4%; p=0.350). HRPs (figure 5) were more frequently observed in COPD patients with moderate-to-severe GOLD stages (≥2) (32.3% versus 20.1%, p=0.044), but the statistical significance ceased when adding patients with mild GOLD stages.
FIGURE 5.
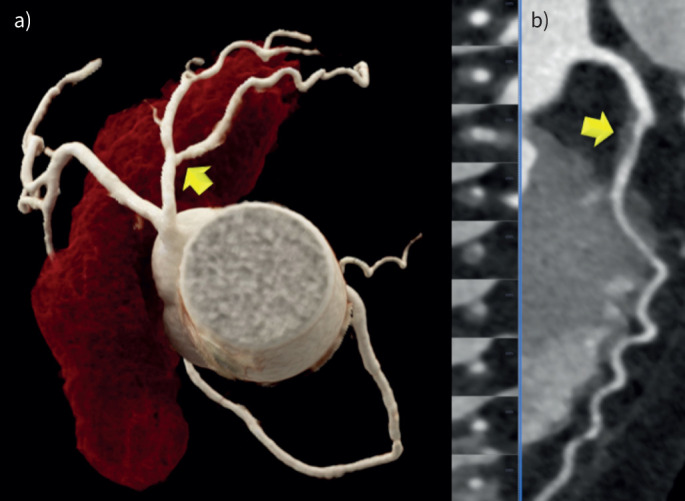
Coronary artery disease by computed tomography angiography (CTA): 70-year-old male with mild coronary stenosis (<50%) (CADRADS 2) of the proximal left anterior descending (LAD) coronary artery caused by a high-risk plaque (HRP) (yellow arrow) with low attenuation. 3D volume rendering technique (VRT): a) Spyder view and b) curved multiplanar reformations (MRP). Coronary artery calcium (CAC) score was 0 (zero). CADRADS: coronary artery disease radiological reporting and data system.
There was a weak positive trend but no significant correlation between coronary plaque density (HU) and LHIS density (HU) (r=0.2, p=0.172), and no association on linear regression analysis (beta 0.217, 95% CI: −0.105–0.538, p=0.182).
LHIS density (mean±SD −15.98±25 HU) was higher than mean EAT (−95 HU) and PAT (−109.9 HU) CT density in all patients with LHIS (p<0.001) in a pooled cohort of LHIS patients with and without COPD (n=195).
Discussion
First, our study showed a markedly higher prevalence of LHIS (72.6%) in patients with COPD as compared to controls in our large cohort. This high frequency of LHIS in COPD patients has not been documented yet in a large number of patients referred for coronary CTA. Only two studies, each with a low sample size (n=23 and n=28), have reported an association of LHIS with emphysema, demonstrating a similarly high rate of LHIS (65.2% and 64.2%) [6, 9] compared to our study.
In COPD patients, chronic hypoxia activates the expression of hypoxic-inducible factors and rewires signalling pathways in adipose tissue, which are responsible for inflammation, fibrosis [19] and impaired angiogenesis. LHIS has been associated with unexplained arrhythmias such as atrial fibrillation (AF), supraventricular arrhythmias and other conduction disturbances [20]; however, only a few studies have been published. It is hypothesised that fat infiltration may disrupt orderly atrial depolarisation, leading to fibrosis and impairment of contractility and electrical conduction.
Patients with AF have an increased prevalence of COPD of 13% [21], which poses an independent relationship [22], and is associated with a poor prognosis [23, 24]. The trigger pathways of AF in COPD patients are poorly understood. The left atria in COPD typically tend to decrease, due to compression of the cardiac chambers by emphysema and lung overexpansion, contrary to the most common cause of secondary AF, being enlarged left atria. Accordingly, the high prevalence of LHIS in COPD [19] might be the missing link for the high co-occurrence of AF in COPD patients, although this has not been tested in our study.
Second, our study revealed, for the first time, that LHIS density (HU) was notably higher in COPD patients, suggesting brown adipose tissue (BAT), reflected by higher HU values [25]. In line with this, 18-FDG-tracer uptake by positron emission tomography within LHIS has been reported previously [7], and BAT was also found on histopathology [26].
BAT contains multilocular lipid droplets with far more mitochondria than white adipocytes, and is an indicator of improved cardiometabolic health [27, 28]. In contrast, white adipose tissue (WAT) has lower HU, is more endocrine active, triggers inflammation and is associated with adverse cardiovascular outcomes [29]. Lower EAT density (HU) has also shown a stronger association with major adverse cardiovascular events (MACE) than EAT volume and even the coronary calcium score [29].
In our cohort, BMI was lower in COPD patients, while the age and sex distribution was not significantly different. Our results are in concordance with a prior study [30] demonstrating an association of BAT with less obesity, in which the authors also reported improved metabolic function, and a lower cardiovascular risk.
Importantly, LHIS density in our series was lower in obese patients with a BMI over 30 mg·m−2. The CT density of adipose tissue is dependent on the lipid component. WAT exhibits lower HU because it contains larger droplets. Therefore, in obese patients, LHIS may not contain as much BAT due to a gradually increasing WAT component.
EAT is endocrine active and excretes pro-inflammatory and pro-fibrotic mediators. Higher EAT volume and lower EAT density predict MACE [31], even in asymptomatic patients as shown by the EISNER trial. EAT volume was found to be abnormally elevated in COPD patients in a recent meta-analysis pooling 596 patients [6]. Higher EAT volume [32] has also been associated with AF. However, prior studies quantifying EAT volume have not distinguished LHIS from EAT surrounding the left atrium. Because our study shows that CT density of LHIS is significantly lower and different from EAT, our data indicate that LHIS should be considered a distinct adipose tissue section of the EAT because it may act as a positive biomarker, reversing cardiovascular risk – though this has to be tested in prospective outcomes studies including cardiovascular end-points. Commercial software tools nowadays, however, do include LHIS in the quantification of EAT volume. However, in obese patients, LHIS density decreases (figure 3), which may impact cardiovascular outcomes.
Importantly, COPD was more strongly associated with LHIS density than BMI, which lost its significance in multivariate models (table 3).
Third, and surprisingly, our study showed no differences in the coronary atherosclerosis profile between COPD patients with LHIS and controls. Both the CAC score and stenosis severity by CTA (CADRADS and obstructive disease rate) were equal. The absolute % of HRP was slightly higher in patients with severe COPD (GOLD stage ≥2), with a borderline significance (p=0.044). However, after adding patients with mild COPD, the statistical significance ceased. Still, the absolute % of HRP in COPD patients was 31.1% higher than previous studies have reported in large-scale cohorts with low-to-intermediate pre-test probability patients (ranging from 6.4 to 26.5%, and increasing with age) [33]. Of note, the prevalence of smoking was markedly higher in COPD patients, which might reflect the higher rate of HRP. Smoking is a known CVRF associated with HRP [34]. Despite COPD patients carry a higher cardiovascular risk and have higher CAC and stenosis severity as reported by one prior Swedish cohort study using CTA [35], we did not observe a difference.
Therefore, our data may suggest that LHIS acts as a protective biomarker due to its BAT component in COPD patients. Higher EAT volume, as found in COPD patients [36], has been linked with an increased prevalence of HRP.
Limitations
We acknowledge the retrospective study design with its potential biases and confounders. For CAD CTA analysis, the groups were matched for age and sex and the major CVRFs arterial hypertension, dyslipidaemia and diabetes. The prevalence of smoking was higher in COPD patients, while a positive family history was more prevalent in controls and the BMI was higher, possibly causing a counterbalancing effect. Still, a confounding bias has to be acknowledged. Multivariate models, adjusted for significant CVRFs (table 4) showed that after adjusting for BMI, LHIS density (HU) and smoking remained strongly significantly associated with COPD, while BMI lost significance. Positive family history remained significant, but the reasons are unclear.
Conclusion
The prevalence of LHIS is markedly higher in COPD patients (72.6%), and the adipose interatrial septum tissue density is higher, indicating a higher brown fat component. However, in obese patients, LHIS density gradually declines along with BMI, and is significantly higher in individuals with a BMI over 30 kg·m−2. While the presence of LHIS in obese individuals may largely represent an accumulation of WAT, the “browning” of interatrial fat in patients with COPD may suggest an ongoing consuming disease.
COPD patients with LHIS had a lower BMI but no differences in the CAD profile, except for patients with severe COPD GOLD stages ≥2, who had more HRPs.
Footnotes
Provenance: Submitted article, peer reviewed.
Conflict of interest: None declared.
References
- 1.Agusti A, Böhm M, Celli B, et al. GOLD COPD DOCUMENT 2023: a brief update for practicing cardiologists. Clin Res Cardiol 2024; 113: 195–204. doi: 10.1007/s00392-023-02217-0 [DOI] [PMC free article] [PubMed] [Google Scholar]
- 2.Agustí A, Celli BR, Criner GJ, et al. Global initiative for chronic obstructive lung disease 2023 report: GOLD executive summary. Am J Respir Crit Care Med 2023; 207: 819–837. doi: 10.1164/rccm.202301-0106PP [DOI] [PMC free article] [PubMed] [Google Scholar]
- 3.Kenchaiah S, Budoff MJ, Ding J, et al. Reply: prognostic role of pericardial fat on the incidence of heart failure. J Am Coll Cardiol 2021; 78: e113–e115. doi: 10.1016/j.jacc.2021.08.008 [DOI] [PMC free article] [PubMed] [Google Scholar]
- 4.Okura K, Maeno K, Okura S, et al. Pericardial fat volume is an independent risk factor for the severity of coronary artery disease in patients with preserved ejection fraction. J Cardiol 2015; 65: 37–41. doi: 10.1016/j.jjcc.2014.03.015 [DOI] [PubMed] [Google Scholar]
- 5.Rämö JT, Kany S, Hou CR, et al. Cardiovascular significance and genetics of epicardial and pericardial adiposity. JAMA Cardiol 2024; 13: e240080. doi: 10.1001/jamacardio.2024.0080 [DOI] [PMC free article] [PubMed] [Google Scholar]
- 6.Lan Y, Ma Q, Luo G, et al. Epicardial adipose tissue in patients with chronic obstructive pulmonary disease: systematic review with meta-analysis and trial sequential analysis. BMC Pulm Med 2023; 23: 241. doi: 10.1186/s12890-023-02535-z [DOI] [PMC free article] [PubMed] [Google Scholar]
- 7.Fan CM, Fischman AJ, Kwek BH, et al. Lipomatous hypertrophy of the interatrial septum: increased uptake on FDG PET. AJR Am J Roentgenol 2005; 184: 339–342. doi: 10.2214/ajr.184.1.01840339 [DOI] [PubMed] [Google Scholar]
- 8.Kuester LB, Fischman AJ, Fan CM, et al. Lipomatous hypertrophy of the interatrial septum: prevalence and features on fusion 18F fluorodeoxyglucose positron emission tomography/CT. Chest 2005; 128: 3888–3893. doi: 10.1378/chest.128.6.3888 [DOI] [PubMed] [Google Scholar]
- 9.Heyer CM, Kagel T, Lemburg SP, et al. Lipomatous hypertrophy of the interatrial septum: a prospective study of incidence, imaging findings, and clinical symptoms. Chest 2003; 124: 2068–2073. doi: 10.1378/chest.124.6.2068 [DOI] [PubMed] [Google Scholar]
- 10.Williams MC, Kwiecinski J, Doris M, et al. Low-attenuation noncalcified plaque on coronary computed tomography angiography predicts myocardial infarction: results from the multicenter SCOT-HEART trial (Scottish Computed Tomography of the HEART). Circulation 2020; 141: 1452–1462. doi: 10.1161/CIRCULATIONAHA.119.044720 [DOI] [PMC free article] [PubMed] [Google Scholar]
- 11.Knuuti J, Wijns W, Saraste A, et al. 2019 ESC Guidelines for the diagnosis and management of chronic coronary syndromes. Eur Heart J 2020; 41: 407–477. doi: 10.1093/eurheartj/ehz425 [DOI] [PubMed] [Google Scholar]
- 12.Agatston AS, Janowitz WR, Hildner FJ, et al. Quantification of coronary artery calcium using ultrafast computed tomography. J Am Coll Cardiol 1990; 15: 827–832. doi: 10.1016/0735-1097(90)90282-t [DOI] [PubMed] [Google Scholar]
- 13.Cury RC, Abbara S, Achenbach S, et al. CAD-RADS™ Coronary Artery Disease – Reporting and Data System. An expert consensus document of the Society of Cardiovascular Computed Tomography (SCCT), the American College of Radiology (ACR) and the North American Society of Cardiovascular Imaging (NASCI). J Cardiovasc Comput Tomogr 2016; 10: 269–281. doi: 10.1016/j.jcct.2016.04.005 [DOI] [PubMed] [Google Scholar]
- 14.Nakazato R, Otake H, Konishi A, et al. Atherosclerotic plaque characterization by CT angiography for identification of high-risk coronary artery lesions: a comparison to optical coherence tomography. Eur Heart J Cardiovasc Imaging 2015; 16: 373–379. doi: 10.1093/ehjci/jeu188 [DOI] [PubMed] [Google Scholar]
- 15.Maurovich-Horvat P, Schlett CL, Alkadhi H, et al. The napkin-ring sign indicates advanced atherosclerotic lesions in coronary CT angiography. JACC Cardiovasc Imaging 2012; 5: 1243–1252. doi: 10.1016/j.jcmg.2012.03.019 [DOI] [PubMed] [Google Scholar]
- 16.Williams B, Mancia G, Spiering W, et al. 2018 ESC/ESH Guidelines for the management of arterial hypertension. Eur Heart J 2018; 39: 3021–3104. doi: 10.1093/eurheartj/ehy339 [DOI] [PubMed] [Google Scholar]
- 17.Mach F, Baigent C, Catapano AL, et al. 2019 ESC/EAS Guidelines for the management of dyslipidaemias: lipid modification to reduce cardiovascular risk. Eur Heart J 2020; 41: 111–188. doi: 10.1093/eurheartj/ehz455 [DOI] [PubMed] [Google Scholar]
- 18.Cosentino F, Grant PJ, Aboyans V, et al. 2019 ESC Guidelines on diabetes, pre-diabetes, and cardiovascular diseases developed in collaboration with the EASD. Eur Heart J 2020; 41: 255–323. doi: 10.1093/eurheartj/ehz486 [DOI] [PubMed] [Google Scholar]
- 19.Wang R, Sun Q, Wu X, et al. Hypoxia as a double-edged sword to combat obesity and comorbidities. Cells 2022; 11: 3735. doi: 10.3390/cells11233735 [DOI] [PMC free article] [PubMed] [Google Scholar]
- 20.Laura DM, Donnino R, Kim EE, et al. Lipomatous atrial septal hypertrophy: a review of its anatomy, pathophysiology, multimodality imaging, and relevance to percutaneous interventions. J Am Soc Echocardiogr 2016; 29: 717–723. doi: 10.1016/j.echo.2016.04.014 [DOI] [PubMed] [Google Scholar]
- 21.Romiti GF, Corica B, Pipitone E, et al. Prevalence, management and impact of chronic obstructive pulmonary disease in atrial fibrillation: a systematic review and metaanalysis of 4,200,000 patients. Eur Heart J 2021; 42: 3541–3554. doi: 10.1093/eurheartj/ehab453 [DOI] [PubMed] [Google Scholar]
- 22.Liao KM, Chen CY. Incidence and risk factors of atrial fibrillation in Asian COPD patients. Int J Chron Obstruct Pulmon Dis 2017; 12: 2523–2530. doi: 10.2147/COPD.S143691 [DOI] [PMC free article] [PubMed] [Google Scholar]
- 23.Goudis CA. Chronic obstructive pulmonary disease and atrial fibrillation: an unknown relationship. J Cardiol 2017; 69: 699–705. doi: 10.1016/j.jjcc.2016.12.013 [DOI] [PubMed] [Google Scholar]
- 24.Warming PE, Garcia R, Hansen CJ, et al. Atrial fibrillation and chronic obstructive pulmonary disease: diagnostic sequence and mortality risk. Eur Heart J Qual Care Clin Outcomes 2023; 9: 128–134. doi: 10.1093/ehjqcco/qcac059 [DOI] [PubMed] [Google Scholar]
- 25.Houchun HH, Sandra AC, Krishna SN, et al. Differential CT attenuation of metabolically active and inactive adipose tissues: preliminary findings. J Comput Assist Tomogr 2011; 35: 65–71. doi: 10.1097/RCT.0b013e3181fc2150 [DOI] [PMC free article] [PubMed] [Google Scholar]
- 26.Page DL. Lipomatous hypertrophy of the cardiac interatrial septum. Human Pathol 1970; 1: 151–163. doi: 10.1016/S0046-8177(70)80008-9 [DOI] [PubMed] [Google Scholar]
- 27.Becher T, Palanisamy S, Kramer DJ, et al. Brown adipose tissue is associated with cardiometabolic health. Nat Med 2021; 27: 58–65. doi: 10.1038/s41591-020-1126-7 [DOI] [PMC free article] [PubMed] [Google Scholar]
- 28.Aldiss P, Davies G, Woods R, et al. “Browning” the cardiac and peri-vascular adipose tissues to modulate cardiovascular risk. Int J Cardiol 2017; 228: 265–274. doi: 10.1016/j.ijcard.2016.11.074 [DOI] [PMC free article] [PubMed] [Google Scholar]
- 29.Goeller M, Achenbach S, Marwan M, et al. Epicardial adipose tissue density and volume are related to subclinical atherosclerosis, inflammation and major adverse cardiac events in asymptomatic subjects. J Cardiovasc Comput Tomogr 2018; 12: 67–73. doi: 10.1016/j.jcct.2017.11.007 [DOI] [PMC free article] [PubMed] [Google Scholar]
- 30.Franssens BT, Hoogduin H, Leiner T, et al. Relation between brown adipose tissue and measures of obesity and metabolic dysfunction in patients with cardiovascular disease. J Magn Reson Imaging 2017; 46: 497–504. doi: 10.1002/jmri.25594 [DOI] [PubMed] [Google Scholar]
- 31.Eisenberg E, McElhinney PA, Commandeur F, et al. Deep learning-based quantification of epicardial adipose tissue volume and attenuation predicts major adverse cardiovascular events in asymptomatic subjects. Circ Cardiovasc Imaging 2020; 13: e009829. doi: 10.1161/CIRCIMAGING.119.009829 [DOI] [PMC free article] [PubMed] [Google Scholar]
- 32.Franssens BT, Nathoe HM, Leiner T, et al. Relation between cardiovascular disease risk factors and epicardial adipose tissue density on cardiac computed tomography in patients at high risk of cardiovascular events. Eur J Prev Cardiol 2017; 24: 660–670. doi: 10.1177/2047487316679524 [DOI] [PubMed] [Google Scholar]
- 33.Feuchtner GM, Beyer C, Langer C, et al. The atherosclerotic profile of a young symptomatic population between 19 and 49 years: coronary computed tomography angiography or coronary artery calcium score? J Cardiovasc Dev Dis 2021; 8: 157. doi: 10.3390/jcdd8110157 [DOI] [PMC free article] [PubMed] [Google Scholar]
- 34.Senoner T, Plank F, Langer C, et al. Smoking and obesity predict high-risk plaque by coronary CTA in low coronary artery calcium score (CACS). J Cardiovasc Comput Tomogr 2021; 15: 499–505. doi: 10.1016/j.jcct.2021.04.003 [DOI] [PubMed] [Google Scholar]
- 35.Svendsen CD, Kuiper KKJ, Ostridge K, et al. Factors associated with coronary heart disease in COPD patients and controls. PLoS One 2022; 17: e0265682. doi: 10.1371/journal.pone.0265682 [DOI] [PMC free article] [PubMed] [Google Scholar]
- 36.Nerlekar N, Brown AJ, Muthalaly RG, et al. Association of epicardial adipose tissue and high-risk plaque characteristics: a systematic review and meta-analysis. J Am Heart Assoc 2017; 6: e006379. doi: 10.1161/JAHA.117.006379 [DOI] [PMC free article] [PubMed] [Google Scholar]