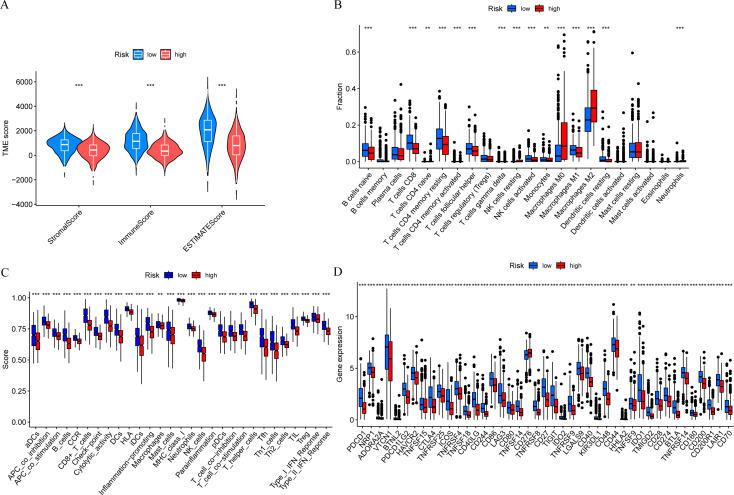
Figure 7. Risk score and tumor immune microenvironment.
(A) Comparison of immune infiltration scores (including Stromal score, Immune score, and ESTIMATE score) between low-risk and high-risk groups. (B) Comparison of tumor-infiltrating immune cells between low-risk and high-risk groups. (C) Comparison of immune-function score between low-risk and high-risk groups. (D) Comparison of immune checkpoint genes between low-risk and high-risk groups.

