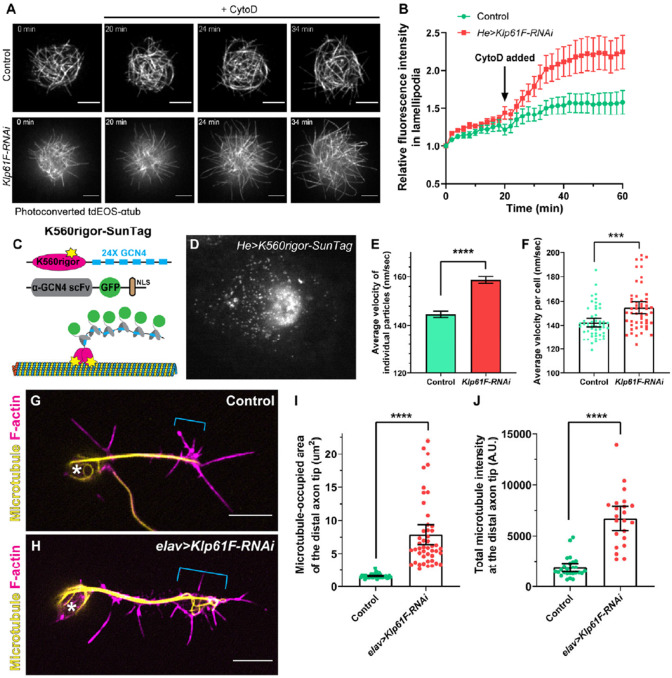
Figure 5. Kinesin-5/Klp61F inhibits microtubule penetration into the periphery of hemocytes and the axonal growth cone of neurons.
(A) Microtubule penetration before and after actin fragmentation by cytochalasin D (CytoD) in control and Klp61F-depleted Drosophila primary hemocytes. CytoD was added at 20 minutes after the start of imaging. Microtubules were labeled with α-tubulin 84B tagged with a tandem dimer of EOS (tdEOS-αtub84B), and globally photoconverted from green to red by UV light. Scale bars, 5 μm. See also Videos 5 and 6. (B) Quantification of microtubule penetration into the lamellipodia in control and Klp61F-RNAi hemocytes. The microtubule intensity in the lamellipodia at 0 minutes was normalized to 1. Data points are shown as average ± SEM. Sample sizes for control and Klp61F-RNAi are N=20 and N=24, respectively. (C) Schematic illustration of the K560Rigor-SunTag system. Co-expression of (1) a human truncated kinesin-1 motor (K560) carrying a rigor mutation (E236A) with 24 copies of the GCN4 peptide, and (2) a single-chain antibody fragment (scFv) against GCN4 tagged with super-folder GFP (sfGFP) and a nuclear localization signal (NLS), result in bright dots irreversibly attached to microtubules. (D) A representative image of a K560Rigor-SunTag-expressing hemocyte. Bright dots outside the nucleus indicate the attachment points of the rigor mutant kinesin-1 motor to microtubules. The movement of these K560Rigor-SunTag dots serves as an indicator of microtubule sliding. (E-F) Quantification of K560Rigor-SunTag dot movement in control and Klp61F-RNAi hemocytes. Velocities are plotted for all particles tracked (E) or as average velocities per cell (F). The total number of particles tracked is N=8953 from 53 control cells, and N=9857 from 53 Klp61F-RNAi cells. The particles were tracked in DiaTrack 3.04. The maximum and minimum velocities were set at 500 nm/sec and 77 nm/sec, respectively. (G-H) Distribution of microtubules (by DM1α staining) and F-actin (by phalloidin staining) in control (G) and elav>Klp61F-RNAi (H) larval brain neurons 4.5 hours after plating. Asterisks indicate the cell body, and brackets indicate the axon growth cone. Scale bars, 5 μm. Both samples carried one copy of elavP-Gal4. (I-J) Microtubule distribution in the distal axon tips of control and elav>Klp61F-RNAi neurons. The distal axon tip is defined as the distal-most 5 μm of the axon containing microtubules. Microtubule distribution is shown either by the area occupied by microtubules (I) or by the total microtubule fluorescence intensity in the distal tip region (J). Sample sizes for each genotype: (I) control, N=42; elav>Klp61F-RNAi, N=47; (J) control, N=26; elav>Klp61F-RNAi, N=22. Unpaired t-tests with Welch's correction were performed between control and elav>Klp61F-RNAi: (I), p<0.0001 (****); (J), p<0.0001 (****).

