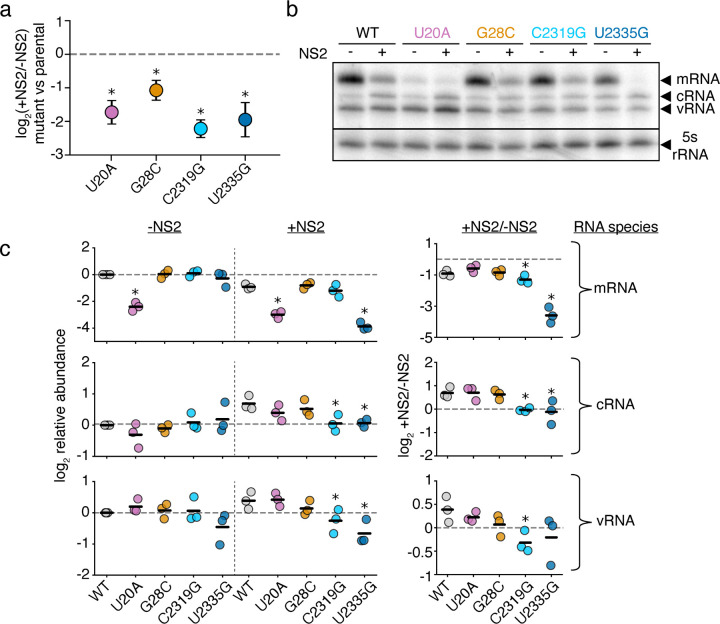
Figure 6. Mutations to NS2-dependent sites can influence mRNA/cRNA/vRNA ratios.
a Each individual mutant in PB1177:385 was transfected alongside a 400nt internal control and minimal replication machinery with, and without, NS2. The relative frequency of each variant relative to the 400nt control was compared against wild-type under each condition. Asterisks indicate a ratio significantly less than 1, one-tailed one-sample t-test, Benjamini-Hochberg corrected FDR<0.05, indicating that the parental exhibits an NS2-dependent advantage over the variant. Points represent mean and standard deviation, n=3. b Representative primer-extension analysis of minimal replication assays with the indicated variants in PB1177:385 with (+) and without (−) the additional expression of NS2. Each molecular species indicated. c Quantitative analysis of primer extension as presented in (b). All values in left two columns corrected against a parental template in the absence of NS2. Dotted line represents that value, points above indicate an increase in that molecular species, below, decrease. Values in the right column represent the ratio of points between the left two columns. Asterisks indicate values that are significantly decreased relative to the parental template, one-tailed t-test with Benjamini-Hochberg corrected FDR <0.1. Full gels presented in Supplementary Fig. 12. Individual replicates and mean presented, n=3. Similar analyses for full-length PB1 template for cRNA presented in Supplementary Fig.13.

