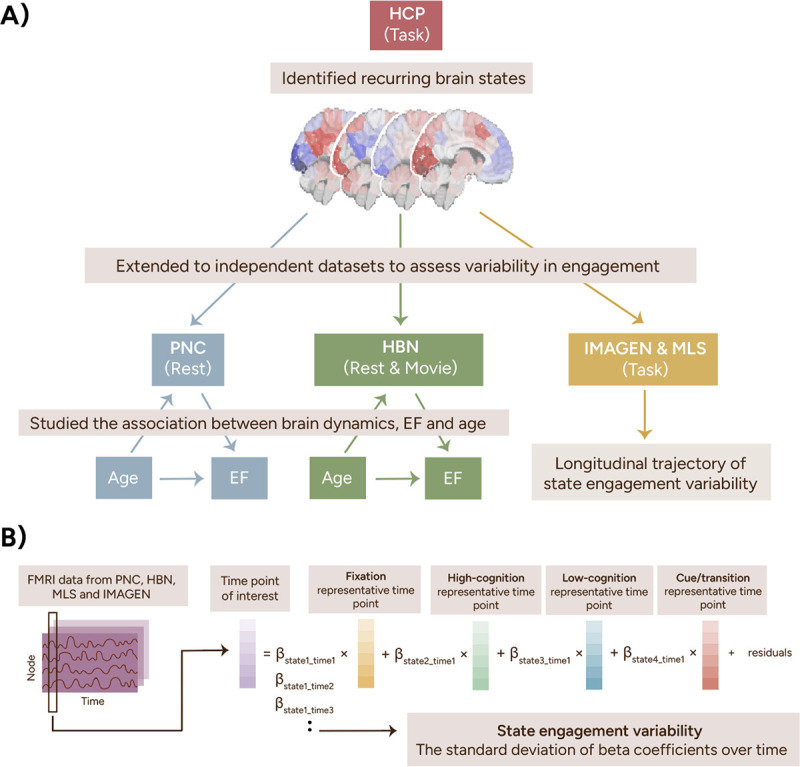
Figure 1.

Study pipeline. We identified four recurring brain states using task-based fMRI data from the HCP. These four brain states were then extended to the PNC, HBN, IMAGEN, and MLS datasets using a previously established pipeline shown in B. To summarize, the representative time points from all four states were regressed from each time point from the PNC, HBN, IMAGEN, and MLS datasets using non-negative least squares regression. This step returned a beta coefficient for each state, indicating its engagement at that time point. State engagement variability was computed as each participant’s standard deviation of beta coefficients across time. HCP, Human Connectome Project; PNC, Philadelphia Neurodevelopmental Cohort; HBN, Healthy Brain Network; MLS, Michigan Longitudinal Study.
