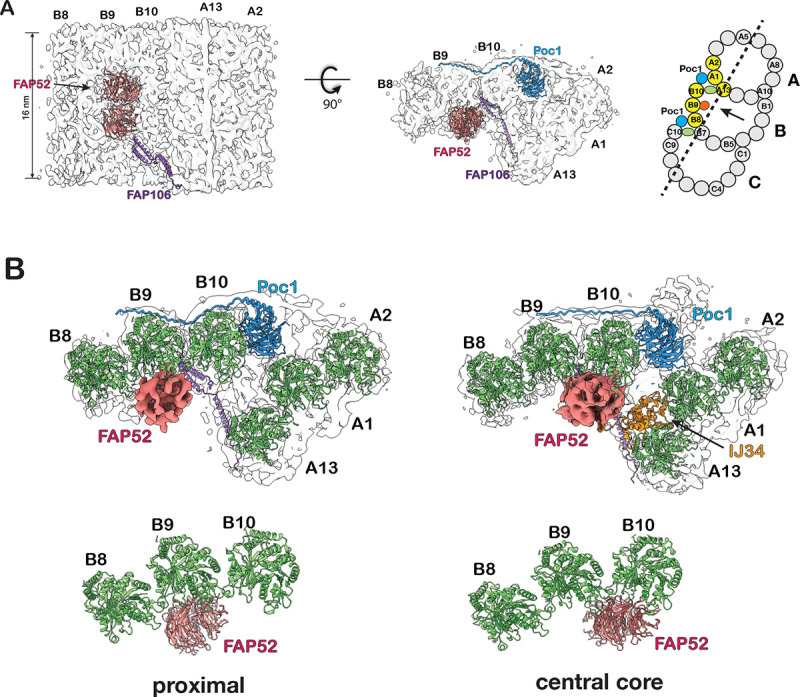
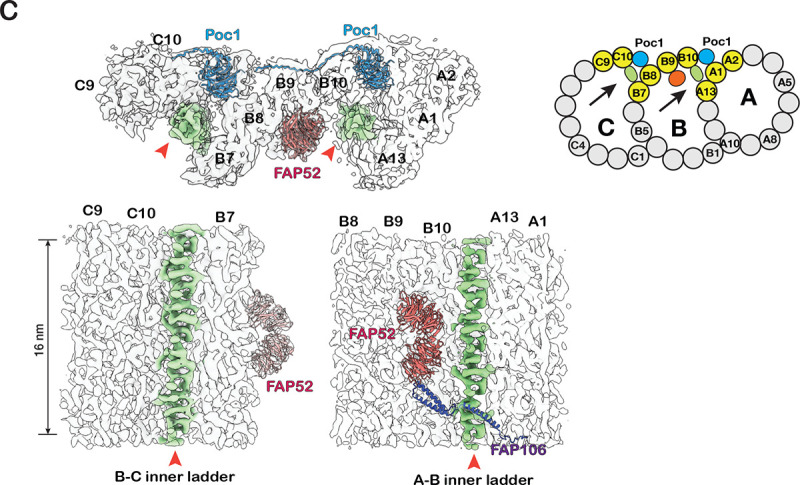
Figure 2.


Structure of the inner Junctions in the proximal region of the BB. (A) The A-B inner junction and the MIPs are identified in the BB proximal region. A schematic diagram of TMT is on the right. The pfs shown in the structure are highlighted in yellow. A dash line indicates the cutting plane and an arrow indicates the direction of view. (B) Comparison of A-B inner Junctions in the BB’s proximal and central core regions. FAP52 binds to B-tubule at different locations in the two structures. The proximal region structures are on the left, and the central core region structures are on the right. (C) Upper: a composite map showing the proximal region’s A-B and B-C inner Junctions. The A-B and B-C inner ladders crosslinking pfs A13-B10 and B7-C10 are highlighted green and indicated by red arrowhead. A schematic diagram of TMT is on the right. The pfs shown in the structure are highlighted in yellow. Arrows indicate the directions of view in the bottom panels. Bottom: longitudinal cross-section views of the A-B and B-C inner Junctions. The A-B inner ladder and B-C inner ladder are colored green.
