Abstract
Collagen is the most abundant protein in mammals; it exhibits a hierarchical organization and provides structural support to a wide range of soft tissues, including blood vessels. The architecture of collagen fibrils dictates vascular stiffness and strength, and changes therein can contribute to disease progression. While transmission electron microscopy (TEM) is routinely used to examine collagen fibrils under normal and pathological conditions, computational tools that enable fast and minimally subjective quantitative assessment remain lacking. In the present study, we describe a novel semi-automated image processing and statistical modeling pipeline for segmenting individual collagen fibrils from TEM images and quantifying key metrics of interest, including fibril cross-sectional area and aspect ratio. For validation, we show first-of-their-kind illustrative results for adventitial collagen in the thoracic aorta from three different mouse models.
Keywords: Collagen, extracellular matrix, image segmentation, transmission electron microscopy
Introduction
Collagen, the most abundant protein in mammals, provides critical mechanical support and strength to a wide range of soft tissues, including cartilage, ligaments, skin, and blood vessels (Kadler et al., 2007). The multiscale structure of collagen is complex, consisting of a hierarchical assembly of molecules, fibrils, fibers, and ultimately fiber bundles (Humphrey, 2002). From a biomechanical perspective, the architectural characteristics are important at nano-, micro-, meso-, and macro-scales, giving rise to the all-important properties of the collagen network (e.g., distributions of fiber orientation, undulation, and cross-links) that are most frequently considered in both empirical and computational studies (Zeinali-Davarani et al., 2015; Pierce et al., 2016; Rego et al., 2016; Rego and Sacks, 2017; Howsmon et al., 2020; Cavinato et al., 2020, 2021). For instance, the diameter of collagen fibrils correlates directly with tensile stiffness and strength in connective tissues (Parry et al., 1978). Within blood vessels specifically, the architecture of collagen fibrils, including their size, organization, alignment, and spatial density, has been shown to be tightly coupled to the tissue-level mechanical behavior and thus function (Stehbens and Martin, 1993; Huang et al., 2016; Kawamura et al., 2021). Collagen fibril density, diameter, and cross-sectional shape, as well as cross-linking, also influence the development and progression of various vascular pathologies, such as aneurysms, dissections, and ruptures (Brandt et al., 1998; Grond-Ginsbach et al., 2002; Morais et al., 2011; Martufi and Gasser, 2013; Jones et al., 2020; Weiss et al., 2021). In addition to affecting mechanical integrity and function, fibril architecture plays a critical mechanobiological role in the vasculature. The mechanical loads acting on blood vessels, namely blood pressure-induced intramural stresses and flow-induced shear stresses, have been shown to regulate various cellular processes, including proliferation, differentiation, and apoptosis (Shi and Tarbell, 2011), and the collagen fibril architecture within the vessel wall modulates these mechanobiological responses through its impact on cell–matrix interactions (Perumal et al., 2008; Jones et al., 2020).
Experimentally, transmission electron microscopy (TEM) has proven to be a powerful technique to study the architecture of collagen fibrils in various tissues (Starborg et al., 2013; Huang et al., 2016; Jones et al., 2020; Kawamura et al., 2021). The high resolution and contrast of TEM images enables detailed analysis of the cross-sectional geometry, spatial density, and organization of collagen fibrils, all of which relate directly to mechanical properties and mechanobiological metrics of interest. Despite the value of TEM as an imaging modality, there is a lack of computational tools for processing TEM images—each of which typically contains hundreds of collagen fibrils—to quickly, objectively, and quantitatively assess fibril architecture across experimental groups with moderate-to-high sample sizes (e.g., dozens). Importantly, therefore, there are currently no reliable approaches for TEM-based collagen fibril segmentation in high-throughput applications; previous efforts to quantify fibril metrics of interest have been limited to small sample sizes since they rely heavily on subjective tuning of image processing parameters, interactive tracing of the individual fibril boundaries, and/or manual direct measurement (Vogel et al., 1979; Birk et al., 1990; Herchenhan et al., 2015; Kawamura et al., 2021), which takes several hours. While computational image analysis protocols have the potential to reduce processing times significantly, no fully automated algorithms have yet proven to be robust for architectures that involve substantially variable fibril cross-sectional geometries (Starborg et al., 2013). Since pathological tissues, in particular, often contain collagen fibrils that vary widely in terms of size, boundary shape, and distribution as well as their overall visual appearance in TEM images (e.g., non-uniform intensity) (Stehbens and Martin, 1993; Kawamura et al., 2021), there is a pressing need to leverage and extend automatic image segmentation techniques (which enable high throughput) within an interactive software package that allows user guidance and verification (to ensure accurate segmentation and analysis results).
In the present study, we developed a novel semi-automated pipeline to segment individual fibrils from TEM images. Building from well-established image processing and advanced statistical modeling methods, we present a first-of-its-kind workflow specialized for this microstructural application. While the proposed combination of algorithms mostly execute automatically, our approach is implemented within a graphical interface, thus allowing user supervision and interactive correction when necessary. Focusing on vascular applications, we validated our pipeline using TEM images of the thoracic aorta from both wild-type and diseased mice, whose collagen fibril characteristics vary considerably in terms of size, shape, spatial arrangement, and visual appearance.
Methods
Illustrative data set
We applied our approach via thoracic aorta specimens excised from adult (8–14 weeks of age) male mice having a C57BL/6J genetic background to verify and validate our TEM image segmentation and analysis pipeline in the specific context of vascular applications. To test our methodology against substantially different collagen fibril architectures, we show results for one wild-type control ascending thoracic aorta (ATA denoted as WT; see Bersi et al. (2019) for details), one descending thoracic aorta (DTA) with disrupted TGF-β signaling (denoted as Tgfbr1r2; see Kawamura et al. (2021) for details), and one ATA representative of Marfan syndrome (denoted as Fbn1C1041G/+; see Weiss et al. (2023) for details). All live animal care and use conformed to national guidelines and was approved by the Institutional Animal Care and Use Committee (IACUC) of Yale University. Specimen excision and preparation as well as image acquisition methods have been described previously (Kawamura et al., 2021; Weiss et al., 2023). Briefly, segments were fixed in 2.5% glutaraldehyde/2% paraformaldehyde in sodium cacodylate buffer first at room temperature for 30 min and then at 4°C for 2 h. Samples were rinsed in sodium cadodylate buffer before post-fixation in 1% osmium tetraoxide for 1 h and subsequent staining using 2% uranyl acetate for 1 h. Afterward, samples were washed and embedded in resin, then sections of the adventitial layer were imaged using a FEI Tecnai BioTwin transmission electron microscope.
Image processing and analysis
The fibril segmentation pipeline presented herein was implemented as a graphical user interface in MATLAB (MathWorks, Natick, MA, USA) that combines automated image processing algorithms with periodic queries that allow the user to supervise and interactively correct intermediate outputs. This approach was chosen with the simultaneous objectives of maximizing efficiency while minimizing errors in the final results. Below, we summarize step by step both the user involvement and the processing methodologies employed to analyze an individual image. All code associated with the pipeline’s software implementation is freely available (see Supplementary Materials).
As an initial preprocessing step, the user interactively selects regions of the image to exclude from the analysis—for example, perivascular areas containing adipose tissue rather than collagen fibrils (Figure 1). The image is then smoothed using a Gaussian filter with bandwidth equal to 0.3% of the smallest dimension (height or width) of the image (Figure 2a,b). To regularize the intensity field of the image as a whole, a bivariate quadratic function
| (1) |
is first fit to the intensity values , where () are pixel coordinates. To minimize the influence of spurious bright/dark pixels that deviate substantially from their average regional intensity, the coefficient values are optimized using robust iteratively reweighted least-squares regression with a Cauchy weight function,
| (2) |
for
| (3) |
and
| (4) |
where are the ordinary least-squares residuals, are the least-squares fit leverage values, is a robust estimator of the standard deviation of the residuals based on their median absolute deviation, is the inverse of the standard normal cumulative distribution function, and is a tuning constant whose value yields 95% asymptotic efficiency for normally distributed data (Rey, 2012).
Fig. 1.
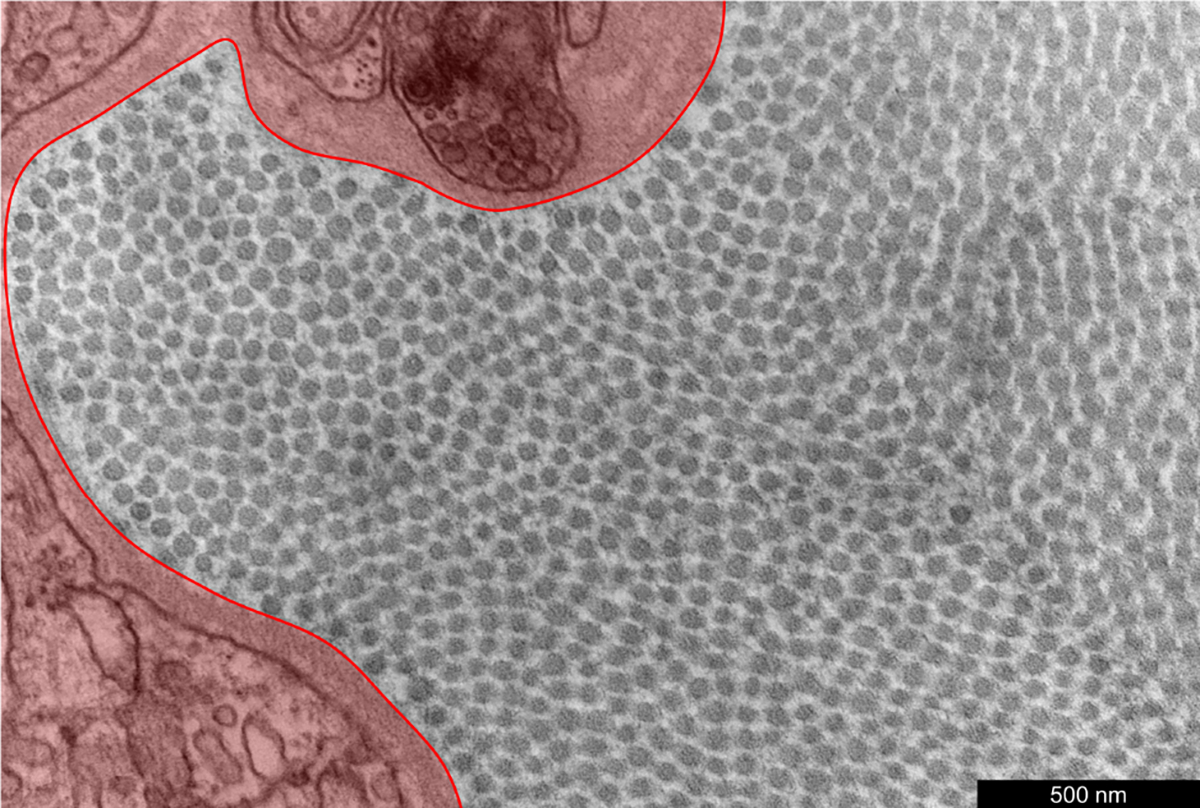
An illustrative TEM image of the adventitial portion of the ATA from a WT control mouse. The perivascular region highlighted in red has been interactively outlined to be excluded from analysis, since it does not contain collagen fibrils.
Fig. 2.
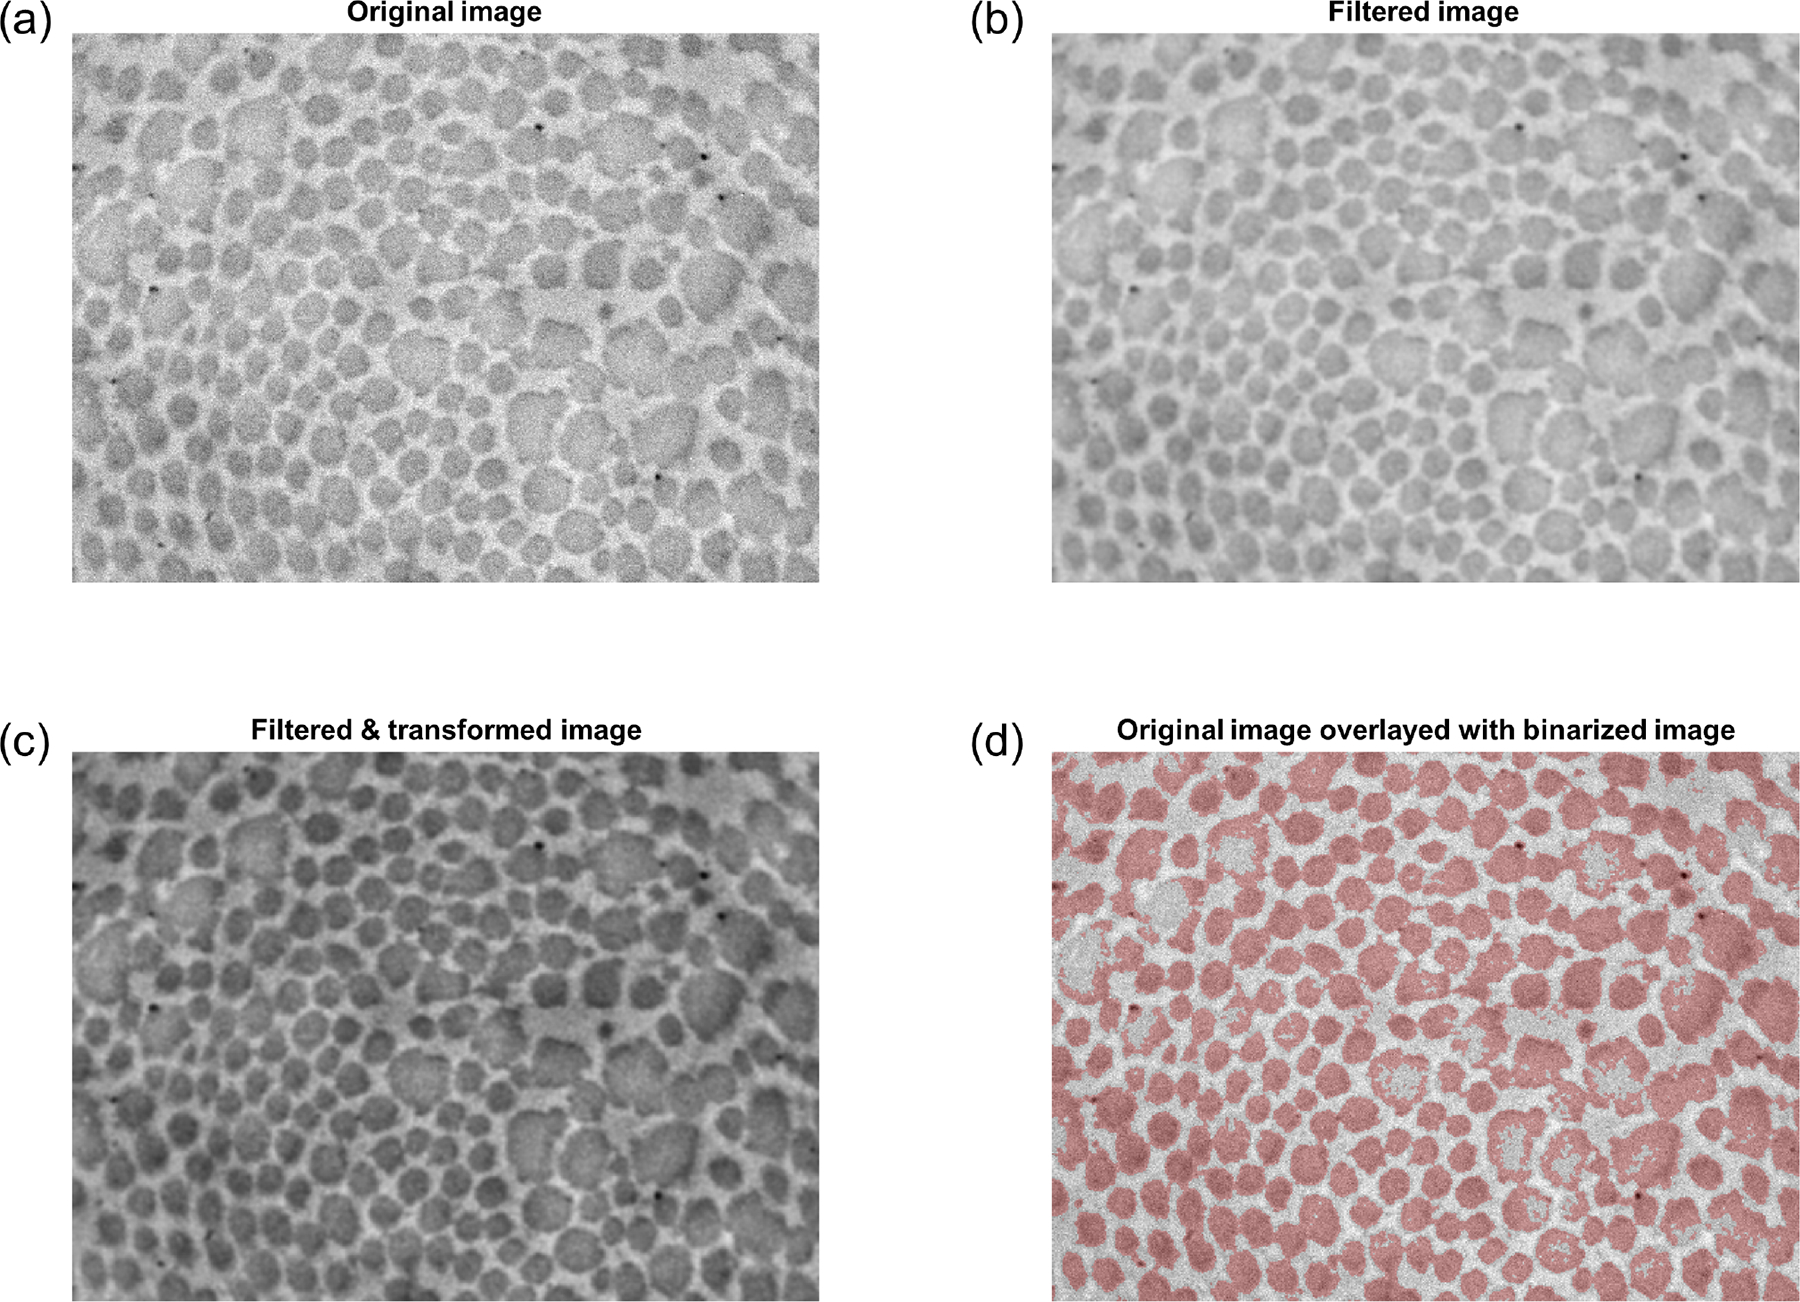
Filtering and binarization pipeline. (a) Original TEM image (Tgfbr1r2 DTA). Note the moderate but perceptible variations in intensity across the image, with regions near the corners generally appearing darker than the middle. (b) Image after Gaussian filtering. (c) Image after subsequent power transformation via Equation 5, which attenuates regional variations in intensity. (d) Overlay of the original image (grayscale) with the binarized image (red). Note that in images of pathological vessels (such as the one shown), this first binarization attempt performs poorly in larger fibrils that have uneven intensity.
The modeled intensity values are adopted as a local adjustment factor, and the intensity values of the filtered image are adjusted using
| (5) |
such that pixels with intensity are mapped to 0.5. This spatially heterogeneous (yet smooth) adjustment attenuates the influence of regional variations in image intensity (e.g., due to non-uniform lighting) during the binarization step (Figure 2c). Using Otsu’s method (Otsu, 1979), the transformed image is then binarized () according to an optimal threshold, with dark pixels categorized as fibrils (Figure 2d).
For each pixel in , the Euclidean distance to the nearest non-fibrillar pixel is computed, producing a distance field with the same dimensions as . Then, for different values of the Gaussian filter bandwidth (ranging from 0.5 to 10 pixels, in steps of 0.5 pixels), the number of local peaks in —taken to be the number of “detected” fibrils—is computed (Figure 3a). A 5th-degree polynomial is fit to the resulting data (Figure 3b), from which the optimal bandwidth is considered to be the lowest positive where reaches a local minimum (Figure 3c). This filter bandwidth corresponds to the lowest positive where the slope of is locally the nearest to 0, meaning that the number of detected fibrils is minimally sensitive to the filter bandwidth at this point. Because is also a polynomial, it is straightforward to compute the roots of its derivative (one of which is ), thus rendering iterative minimization of unnecessary.
Fig. 3.
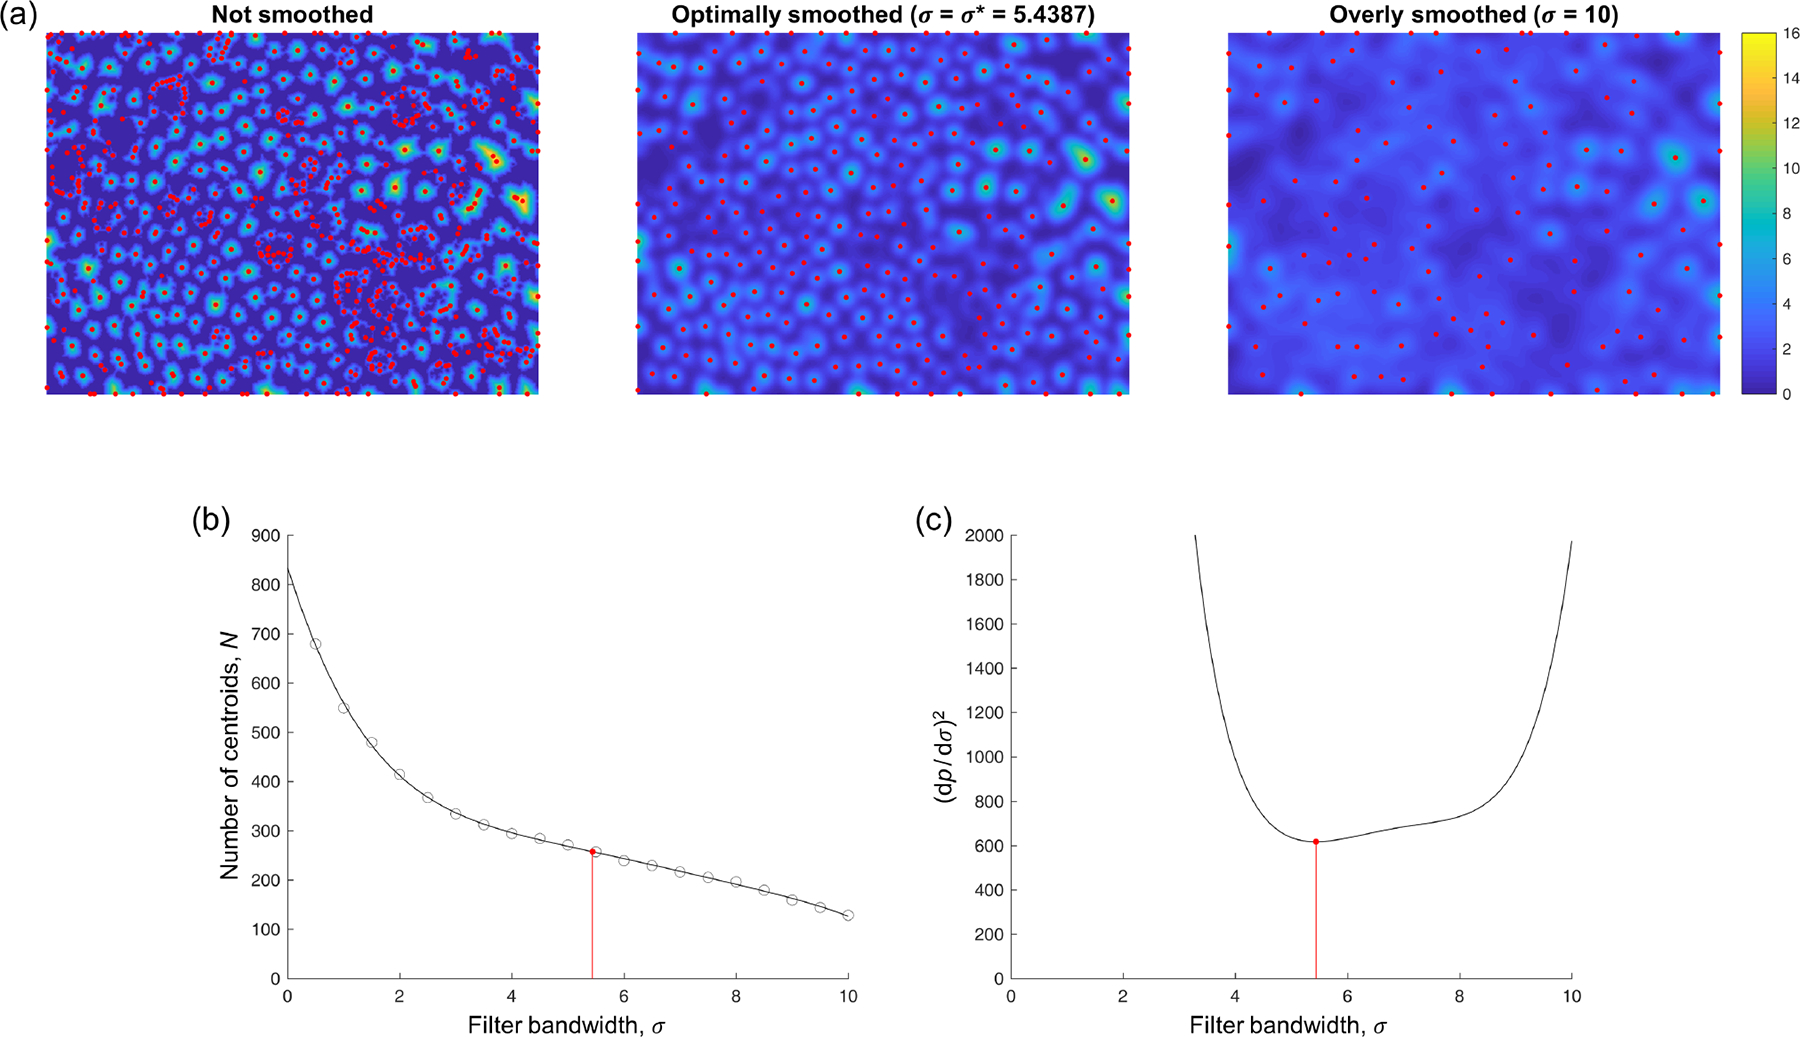
Fibril centroid detection. In (a), the color scale displays the distance field (unsmoothed) or (smoothed with the indicated bandwidths ). Local peaks in the field, plotted in red, are treated as candidate locations for the centroids of all the collagen fibrils in the image. (b) The number of centroids detected with different filter bandwidths . Circles denote actual results, while the plotted curve corresponds to the 5th-degree polynomial fit . The optimal filter bandwidth (red) corresponds to the point at which is least sensitive (locally) to . (c) Equivalently, the optimal filter bandwidth corresponds to the lowest positive where reaches a local minimum, which is straightforward to compute.
The first estimates of the centroid coordinates are thus the locations of the local peaks in , with the corresponding Voronoi tessellation defining a first estimate of the fibril “neighborhoods” (Figure 4a). At this stage, the user may interactively add, remove, or modify fibril centroids that were undetected, erroneously detected, or poorly estimated, respectively, if needed (Figure 4b,c). For each Voronoi cell, if any of the cell’s vertices are either outside of the image area or within a previously excluded region, the corresponding fibril is labeled as a “boundary fibril,” to be excluded from future analyses (e.g., cross-sectional area computations) since part of the fibril is most likely not visible. While small fibrils tend to have a uniformly dark intensity, the central region of relatively large fibrils (e.g., Figure 2a) is often lighter than the outer regions (and sometimes as light as the background). In these cases, the first binarization attempt tends to incorrectly classify the light central regions as non-fibrillar, thus necessitating a refinement to the binarization. To improve upon the initial image binarization, a “characteristic intensity” is defined for each Voronoi cell, equal to the mean intensity of pixels in that cell whose pixel-to-centroid distance is less than the 5th percentile of pixel-to-centroid distances within that cell.
Fig. 4.
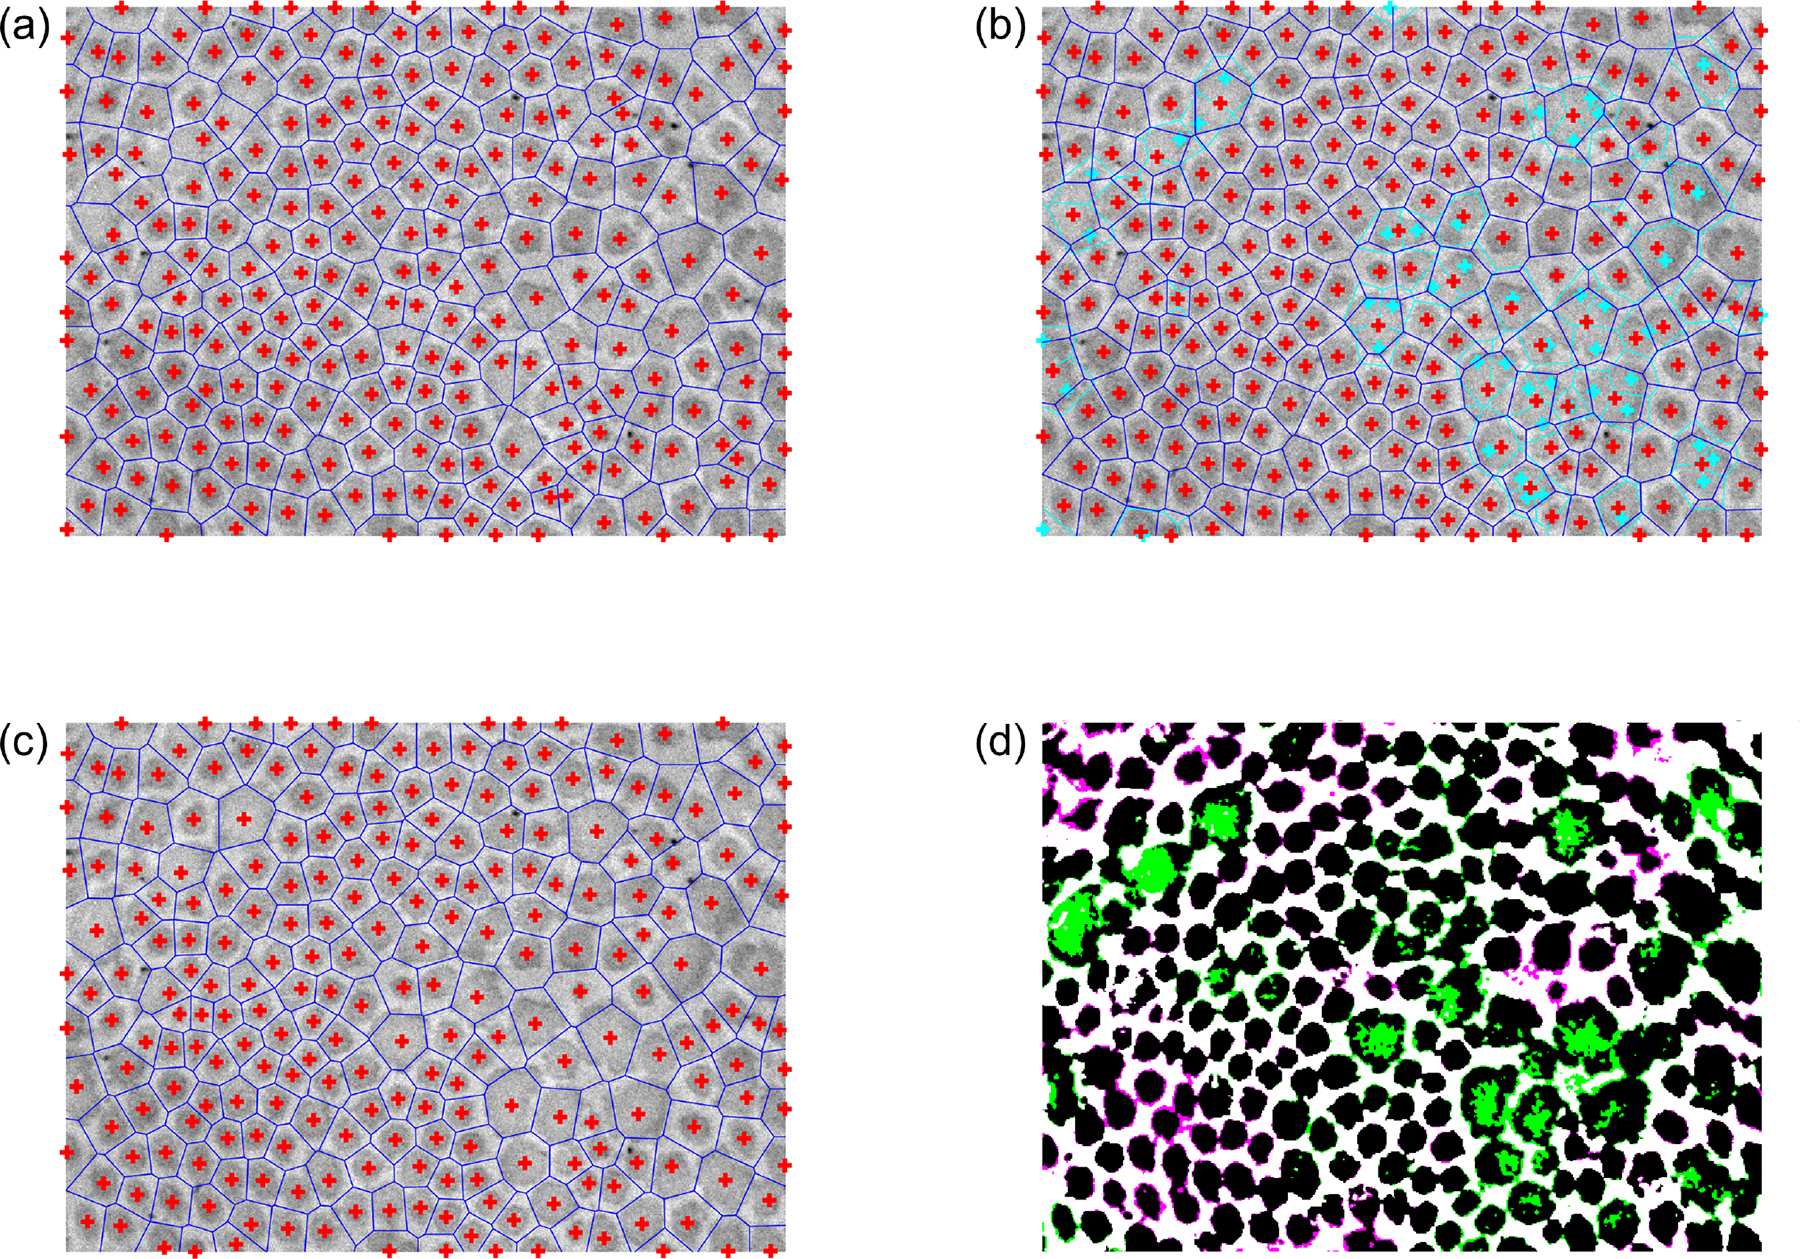
Fibril neighborhoods based on Voronoi tesselation. (a) Initial guess for the fibril neighborhood boundaries (blue) using centroids (red crosses) based on the local peaks in the optimally smoothed . (b) Subsequent interactive correction of the centroid locations. New centroids and boundaries are shown in red and blue, respectively, while the initial guess centroids and boundaries are now shown in cyan for comparison. (c) The final user-approved centroid locations and corresponding Voronoi tesselation. (d) Improved binarization based on the corrected centroid locations and neighborhood boundaries, using a smooth heterogeneous transformation of the intensity field based on characteristic neighborhood intensities that account for intrafibrillar intensity variations. Regions whose categorization changed from non-fibrillar to fibrillar are colored green, while regions whose categorization changed from fibrillar to non-fibrillar are colored magenta. The categorizations of black and white regions are unchanged (fibrillar and non-fibrillar, respectively).
A smooth interpolant of the characteristic intensities (defined at the centroids for the purposes of interpolation) is then computed. To ensure continuity, a natural neighbor area-based local weighting scheme that is determined directly from the above Voronoi tessellation is used to compute the value of the interpolant at each pixel location (Sibson, 1981; Amidror, 2002). The adjusted image is then readjusted using
| (6) |
and is binarized (again using Otsu’s method (Otsu, 1979)) to yield (Figure 4d). To summarize the overall presence of fibrillar collagen, it is trivial to compute the collagen fibril area fraction as the percentage of consisting of fibrillar pixels.
While the Voronoi tessellation provides a necessary platform from which to refine the image binarization (thereby improving the categorization of fibrillar and non-fibrillar regions), the Voronoi cells do not generally yield a precise delineation of the neighborhood boundaries surrounding each fibril. In particular, when adjacent fibrils differ substantially in size, the shared edge of their Voronoi cells tends to pass through the larger fibril, since the Voronoi tessellation is based only on the fibril centroids (Figure 4c). A more sophisticated approach to determine the true fibril boundaries is thus needed to avoid errors when computing fibril-specific metrics of interest, such as cross-sectional area and aspect ratio. To overcome this limitation of the Voronoi tessellation, the newly segmented fibrillar pixels are therefore clustered by fitting a two-dimensional Gaussian mixture model to the fibrillar pixel coordinates (McLachlan et al., 2019). Note that clustering via the Voronoi tessellation (i.e., -means clustering) is a special case of clustering with a Gaussian mixture model, under the constraint that the component covariance matrices must all be equal and proportional to the identity matrix. Using the Voronoi centroid locations as an initial guess for the cluster means and the Voronoi cell memberships as initial cluster assignments, fitting is performed via an expectation–maximization algorithm (Hastie et al., 2001; McLachlan et al., 2019), wherein computation of the posterior membership probabilities conditional on the current distribution parameters (“E step”) is alternated with an update of the distribution parameters based on the membership probabilities (“M step”). To avoid convergence onto solutions that include rank-deficient component covariance matrices, the component means and proportions are first optimized conditional on the covariance matrices , then the covariance matrices and proportions are optimized conditional on the means. In practice, an additional benefit of this sequential approach is that it tends to bias the adjusted cluster means to remain close to their initial (i.e., post-Voronoi, user-approved) locations.
After fitting the model, posterior membership probability fields are computed over the entire image for each cluster (i.e., each fibril) , using
| (7) |
where is the normal probability density function. The fibril neighborhood boundaries are then redefined implicitly as (Figures 5 and 6a). The cross-sectional area of each fibril is computed by summing the areas of all fibrillar pixels within the corresponding neighborhood boundary. At the group level, distributions of fibril area are computed via kernel density estimation (Botev et al., 2010) of log-transformed area values to enforce a strictly positive support. Under the approximation that fibrillar pixel coordinates belonging to a particular fibril are uniformly distributed within an ellipse, the marginal density of fibrillar pixels along the ellipse’s major axis direction relative to its centroid is
| (8) |
where is the major radius of the ellipse. Therefore, the variance of fibrillar pixel locations along the major axis is
| (9) |
while the variance along the minor axis is analogously . The major and minor radii of the ellipse can thus be computed as and respectively (Rego, 2019), where and are the maximum and minimum eigenvalues of the covariance matrix for those pixels’ coordinates (Figure 6b). Likewise, the ellipse’s orientation is taken from the eigenvectors of the covariance matrix. As a final correction step, the user may interactively remove any ellipses that fit the actual fibril boundary poorly.
Fig. 5.
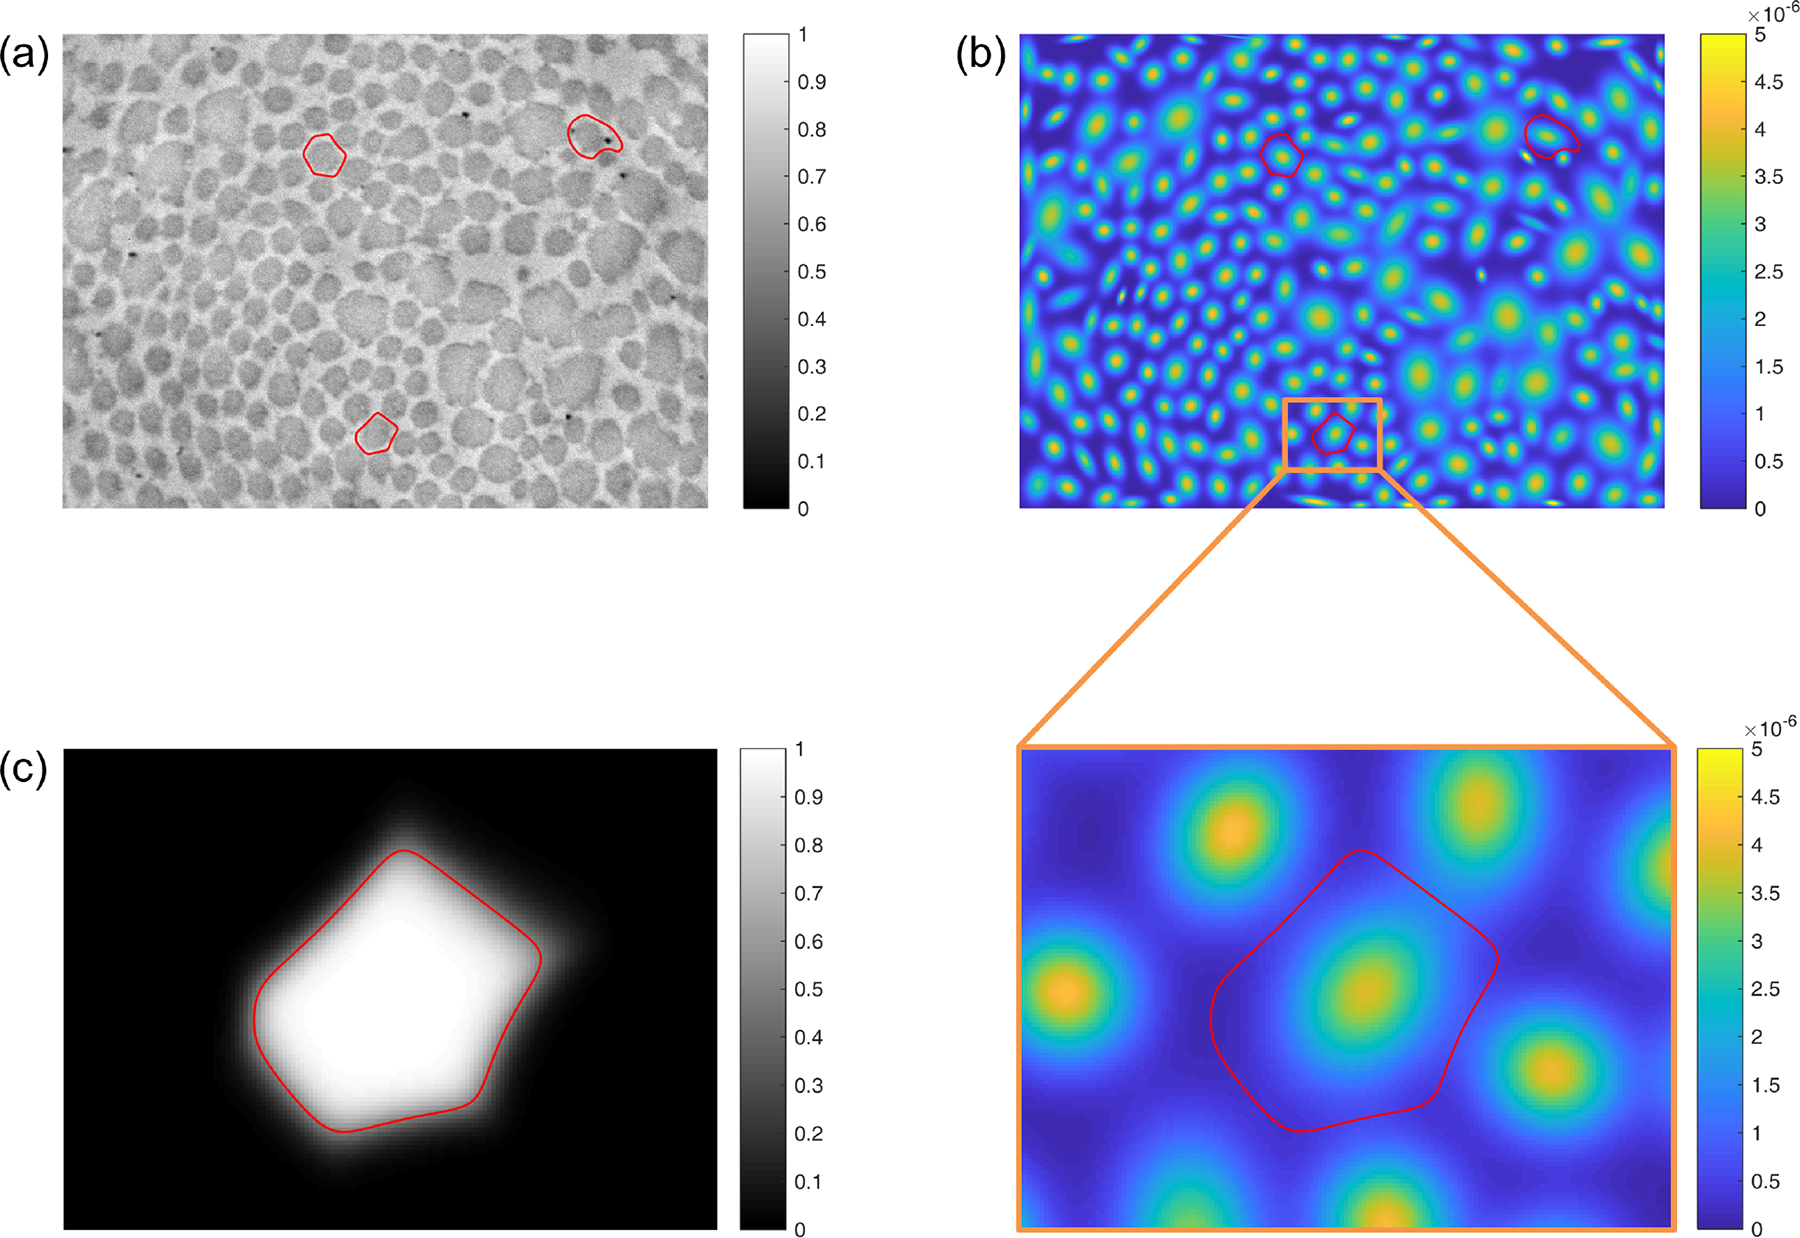
(a) A TEM image, showing improved fibril neighborhood boundaries (red) for three representative fibrils. These boundaries are computed based on fitting an -component Gaussian mixture model to all fibrillar pixel locations. (b) The same three neighborhood boundaries, plotted together with the probability density function of the resultant Gaussian mixture model. A region of interest surrounding one of the representative fibrils is enlarged for clarity. (c) The posterior membership probability field for the Gaussian component (i.e., fibrillar pixel population) centered in the region of interest. The final neighborhood boundary, defined implicitly as the contour at which , represents that largest -based region that is guaranteed not to overlap with any adjacent fibril neighborhoods, which are defined in the same way.
Fig. 6.
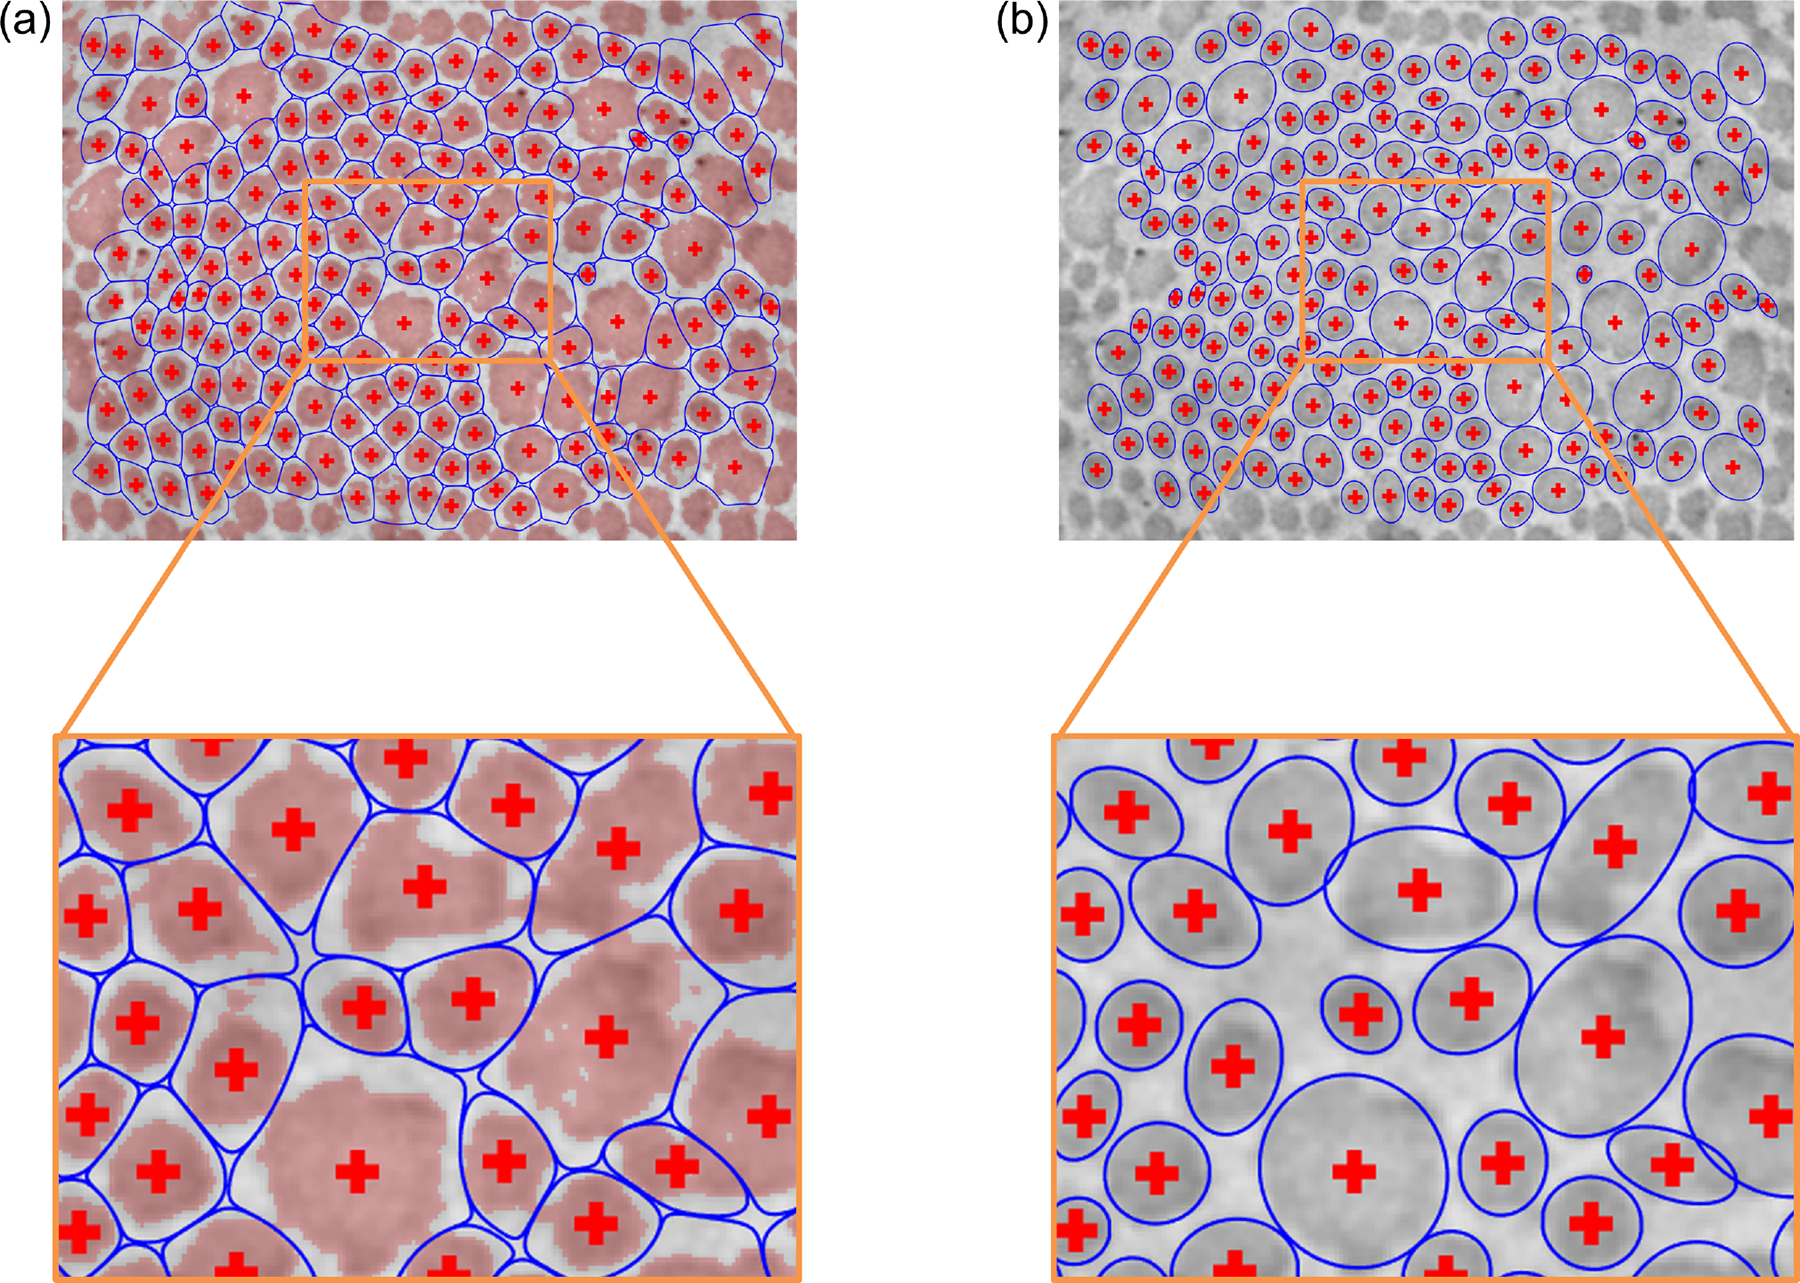
(a) Neighborhood boundaries based on Gaussian mixture modeling for all the fibrils in the image shown. Pixels categorized as fibrillar are overlayed in red. (b) Subsequent approximation of the fibril cross sections, under the simplifying assumption that pixels belonging to each fibril are uniformly distributed within an ellipse.
Illustrative Results
Our semi-automated TEM image segmentation and analysis pipeline performed well across the diverse illustrative data set included in the present study. In particular, we were able to distinguish fibrillar and non-fibrillar regions with minimal user guidance, which enabled efficient extraction of fibril centroid locations and fibril neighborhood boundaries, as well as associated metrics of interest, including fibril cross-sectional area and aspect ratio distributions. Illustrative segmentation and analysis results are shown in Figure 7. Comparing across these images, we found that the different mouse models varied substantially in terms of fibril cross-sectional areas (Figure 8). Specifically, WT control fibrils were smaller than both the Tgfbr1r2 and Fbn1C1041G/+ fibrils, on average. The three area distributions were also substantially different in terms of their variance, with WT fibrils being the least variable in size and Fbn1C1041G/+ fibrils being the most variable (Figure 8a). With regard to geometry, the larger fibrils in the Tgfbr1r2 specimen often had a more irregular shape. Despite this, overall differences in shape as quantified by the fibril aspect ratios were minimal at the population level (Figure 8b). Note that we present these results merely to illustrate our image segmentation and analysis pipeline for a variety of microarchitectures; these findings are not meant to be conclusive or to suggest broader implications.
Fig. 7.
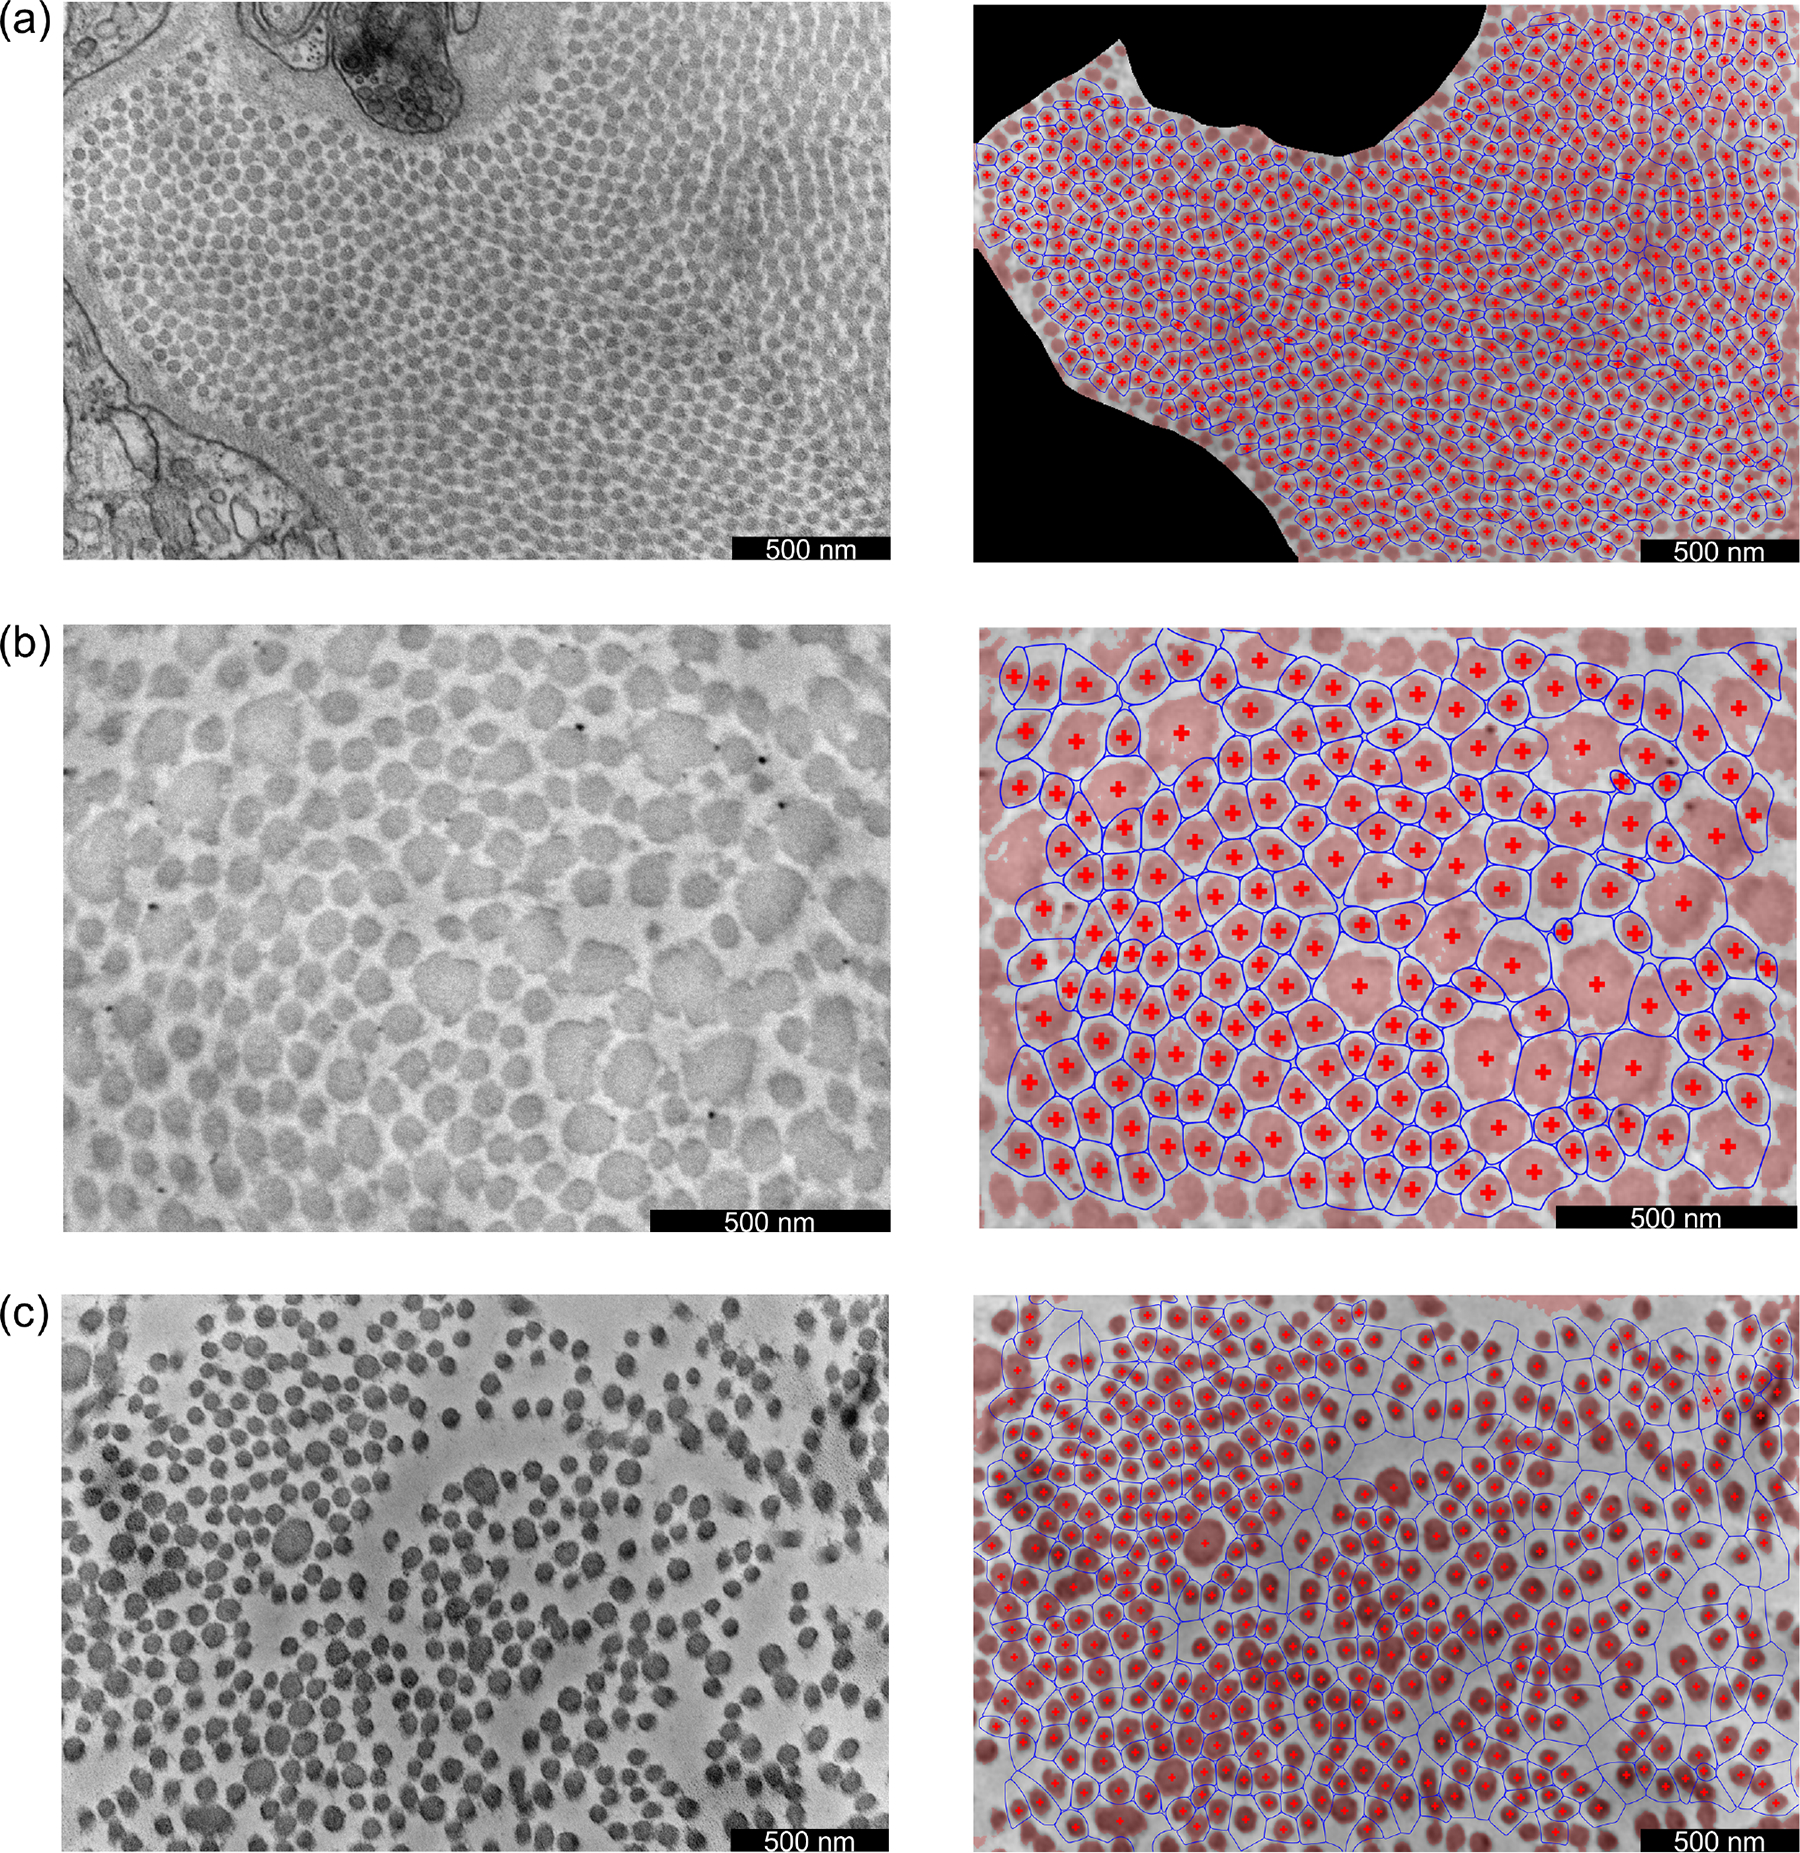
Illustrative results for (a) a WT control ATA, (b) a DTA with postnatal disruption of Tgfbr1r2, and (c) a Fbn1C1041G/+ ATA. Acquired TEM images are shown in the left column, while corresponding results are shown in the right column. In the results, pixels categorized as fibrillar have a light red overlay, the fibril centroids are denoted by red crosses, and the fibril neighborhoods are denoted by blue curves.
Fig. 8.
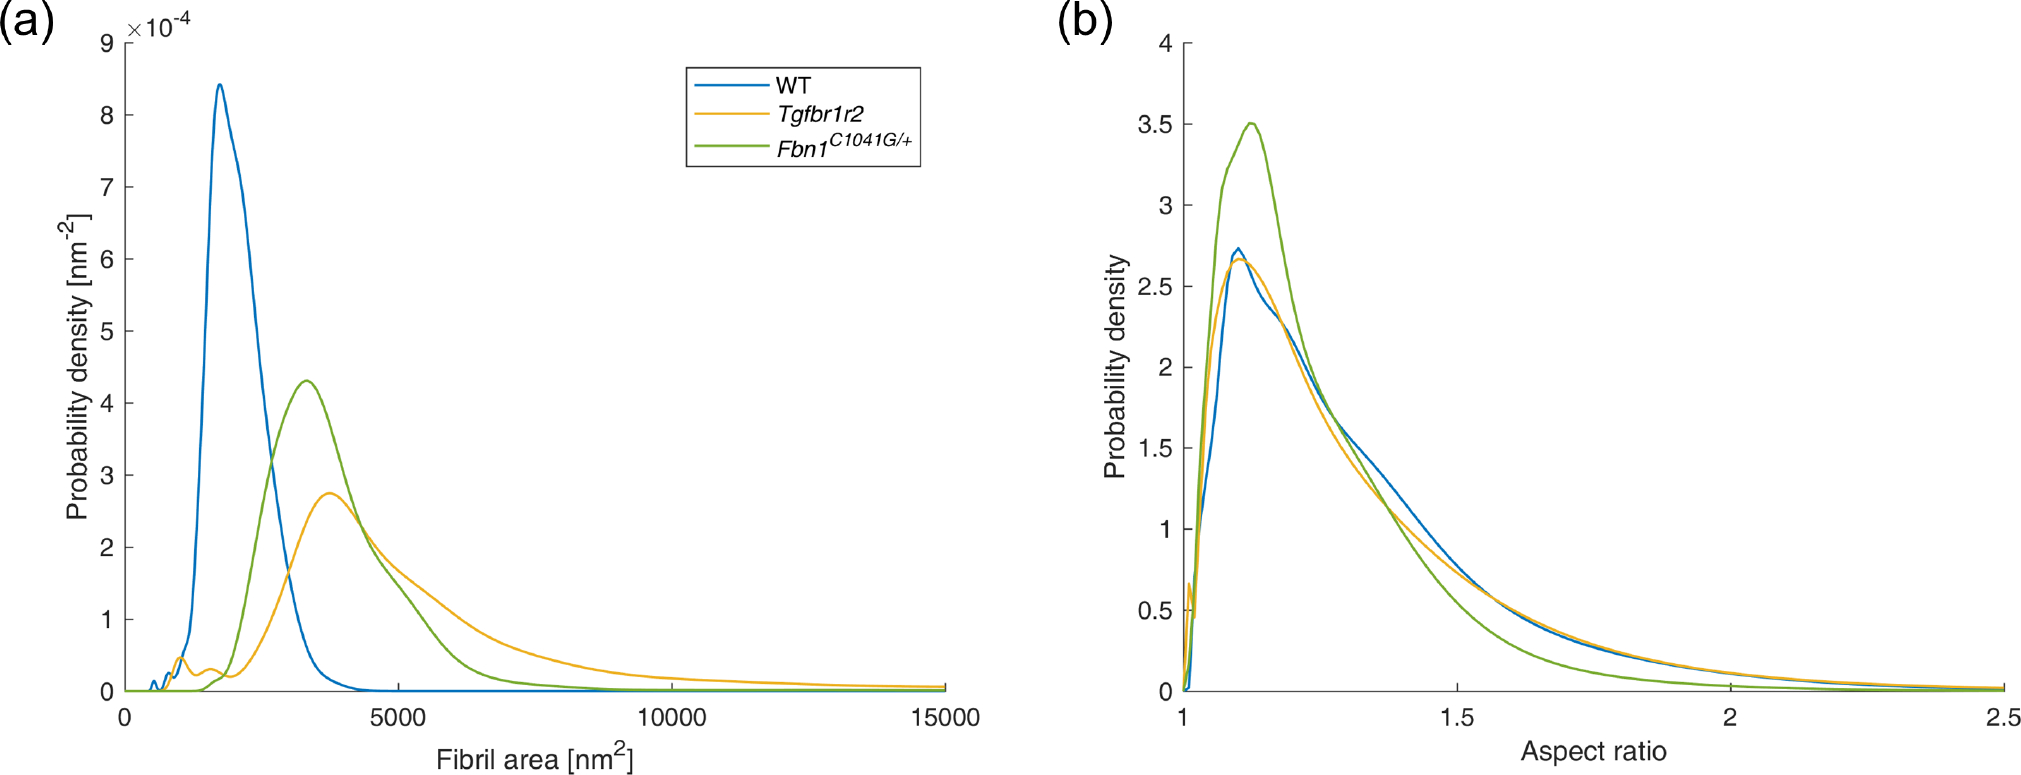
Distributions of (a) fibril cross-sectional area and (b) fibril aspect ratio for the three images shown in Figure 7.
Discussion
Quantitative analysis of collagen architecture is critical in biomechanical and mechanobiological studies, particularly given the important role of collagen in soft tissue development, homeostasis, adaptation, and disease progression (i.e., via mechanosensing/mechanotransduction and subsequent cellular production and removal of tissue constituents). In the present study, we introduce a novel semi-automated pipeline developed to segment individual fibrils from TEM images, which can be used to quickly and robustly quantify geometric characteristics of interest, including fibril cross-sectional area and aspect ratio (a measure of circularity). Focusing on vascular applications, we illustrated the pipeline by applying it to images of the thoracic aorta from three different mouse models: WT control, Tgfbr1r2, and Fbn1C1041G/+.
Development of this pipeline was motivated by the practical limitations of currently available methods to extract collagen fibril characteristics reliably from TEM images. Since rudimentary thresholding/binarization approaches perform poorly under various circumstances (e.g., Figure 2d), prior studies have relied on interactive tracing of the cross section boundaries and directly measuring metrics of interest for all fibrils in each acquired image (Vogel et al., 1979; Birk et al., 1990; Herchenhan et al., 2015; Kawamura et al., 2021). While dependent on tissue characteristics and image magnification, each acquired TEM image typically contains hundreds of fibrils. Precise interactive tracing and measurement thus requires several hours per image, which has severely limited the sample sizes included in previous multi-group analyses. By contrast, segmentation of fibrils across an entire image can be performed in less than 15 minutes with our novel pipeline, even by a user with no prior training. We found the pipeline to be robust against multiple pathological architectures, namely (1) Tgfbr1r2, in which fibril sizes are remarkably variable and larger fibrils exhibit non-uniform image intensity within their cross sections (Figure 7b), and (2) Fbn1C1041G/+, in which the spatial distribution of fibrils was substantially heterogeneous (Figure 7c). With few exceptions, the segmentation of all individual fibrils was successful, despite several simplifying modeling assumptions. For example, while the distributions of fibrillar pixels are nearly uniform (rather than Gaussian) within each fibril’s cross section, we found that a Gaussian mixture model performed well for the purposes of defining fibril neighborhood boundaries across the entire image. This high accuracy can be attributed primarily to two factors: (1) although some pairs of fibrils are in direct contact, adjacent fibril boundaries are generally well separated, even in samples where the fibril population density is high (Figure 7a); (2) because the cross sections for the vast majority of fibrils are close to elliptical, their boundaries are well-captured by level sets of their corresponding Gaussian distributions, which are also ellipses.
While the current pipeline has performed well across our validation data set, some limitations remain and should be addressed in future extensions of our approach, particularly in the post-segmentation analysis of the results. Most notably, that aspect ratio distributions were similar across the three specimens (Figure 8b) despite remarkable qualitative differences in fibril cross-sectional shape (Figure 7) suggests that there is a need to explore alternative shape comparison metrics, including various measures of deviation between the actual fibril boundary shape and the ellipse approximation (Montero and Bribiesca, 2009). Moreover, while outside the scope of this initial proof-of-concept study, it remains important to apply and assess the pipeline presented herein to substantially larger image sets, which in practice are acquired within application studies focused on specific pathologies (Weiss et al., 2023). Future evaluation should also be performed with non-vascular samples to examine the broader applicability of this pipeline, and to modify it as needed for different tissues. We emphasize that the current version of the pipeline is only intended for analysis of images that are acquired perpendicular to the preferred fiber direction, so that the cross sections of the individual fibrils can be consistently imaged. Therefore, while application of this pipeline is straightforward for sections of tissues that exhibit aligned fiber populations (e.g., vasculature, tendons, ligaments), examination of tissues with more dispersed fibers (e.g., skin, cartilage) will require modifying the post-processing and analysis to account for the variability in fiber orientations. We note also that other features of collagen, including the length, banding pattern, and packing of the fibers, all of which are not discernible from the images considered herein, should be measured to comprehend the collagen fibrils’ morphological characteristics fully; indeed, insights enabled by the present pipeline are meant to complement, not replace, such information.
From a scientific and clinical perspective, there remains a pressing need to explore how collagen fibril architecture differs across various physiological and pathological conditions, as well as to elucidate the mechanisms through which collagen fibril architecture impacts tissue development, maintenance, and adaptation. While it is well established that fibril architecture contributes significantly to the mechanical behavior of blood vessels (Parry et al., 1978; Stehbens and Martin, 1993; Huang et al., 2016; Kawamura et al., 2021), much remains unknown about the ways in which this architecture influences mechanosensing and mechanotransduction by vascular cells (Perumal et al., 2008; Jones et al., 2020). These processes are the ultimate drivers of growth and remodeling of the extracellular matrix, including the collagen network itself, in response to (patho)physiological mechanical and biological perturbations. The pipeline presented herein, which enables TEM-based quantitative analyses of fibril architecture to be incorporated more ubiquitously in structural investigations of collagenous soft tissues, will facilitate continued progress in these longer-term endeavors.
Supplementary Material
Acknowledgments
This work was supported by the National Institutes of Health under awards U01-HL142518 and P01-HL134605.
Footnotes
Competing interests
The authors declare that they have no conflict of interest, financial or otherwise.
Supplementary materials
All scripts used in this study are openly accessible through https://github.com/brunorego7/TEM-analysis.
References
- Amidror I. Scattered data interpolation methods for electronic imaging systems: a survey. Journal of Electronic Imaging, 11(2):157–176, 2002. [Google Scholar]
- Bersi MR, Bellini C, Humphrey JD, and Avril S. Local variations in material and structural properties characterize murine thoracic aortic aneurysm mechanics. Biomechanics and Modeling in Mechanobiology, 18:203–218, 2019. [DOI] [PMC free article] [PubMed] [Google Scholar]
- Birk DE, Fitch JM, Babiarz JP, Doane KJ, and Linsenmayer TF. Collagen fibrillogenesis in vitro: interaction of types I and V collagen regulates fibril diameter. Journal of Cell Science, 95(4):649–657, 1990. [DOI] [PubMed] [Google Scholar]
- Botev ZI, Grotowski JF, and Kroese DP. Kernel density estimation via diffusion. The Annals of Statistics, 38(5):2916–2957, 2010. [Google Scholar]
- Brandt T, Hausser I, Orberk E, Grau A, Hartschuh W, Anton-Lamprecht I, and Hacke W. Ultrastructural connective tissue abnormalities in patients with spontaneous cervicocerebral artery dissections. Annals of Neurology, 44 (2):281–285, 1998. [DOI] [PubMed] [Google Scholar]
- Cavinato C, Badel P, Krasny W, Avril S, and Morin C. Experimental characterization of adventitial collagen fiber kinematics using second-harmonic generation imaging microscopy: similarities and differences across arteries, species and testing conditions. In Multi-scale Extracellular Matrix Mechanics and Mechanobiology, pages 123–164. Springer, 2020. [Google Scholar]
- Cavinato C, Chen M, Weiss D, Ruiz-Rodríguez MJ, Schwartz MA, and Humphrey JD. Progressive microstructural deterioration dictates evolving biomechanical dysfunction in the Marfan aorta. Frontiers in Cardiovascular Medicine, 8:1904, 2021. [DOI] [PMC free article] [PubMed] [Google Scholar]
- Grond-Ginsbach C, Schnippering H, Hausser I, Weber R, Werner I, Steiner HH, Lüttgen N, Busse O, Grau A, and Brandt T. Ultrastructural connective tissue aberrations in patients with intracranial aneurysms. Stroke, 33(9):2192–2196, 2002. [DOI] [PubMed] [Google Scholar]
- Hastie T, Tibshirani R, and Friedman J. The EM algorithm. In The Elements of Statistical Learning: Data Mining, Inference, and Prediction, pages 236–242. Springer; New York, 2001. [Google Scholar]
- Herchenhan A, Uhlenbrock F, Eliasson P, Weis M, Eyre D, Kadler KE, Magnusson SP, and Kjaer M. Lysyl oxidase activity is required for ordered collagen fibrillogenesis by tendon cells. Journal of Biological Chemistry, 290(26):16440–16450, 2015. [DOI] [PMC free article] [PubMed] [Google Scholar]
- Howsmon DP, Rego BV, Castillero E, Ayoub S, Khalighi AH, Gorman RC, Gorman III JH, Ferrari G, and Sacks MS. Mitral valve leaflet response to ischaemic mitral regurgitation: from gene expression to tissue remodelling. Journal of the Royal Society Interface, 17(166):20200098, 2020. [DOI] [PMC free article] [PubMed] [Google Scholar]
- Huang AH, Balestrini JL, Udelsman BV, Zhou KC, Zhao L, Ferruzzi J, Starcher BC, Levene MJ, Humphrey JD, and Niklason LE. Biaxial stretch improves elastic fiber maturation, collagen arrangement, and mechanical properties in engineered arteries. Tissue Engineering Part C: Methods, 22(6):524–533, 2016. [DOI] [PMC free article] [PubMed] [Google Scholar]
- Humphrey JD. Cardiovascular Solid Mechanics: Cells, Tissues, and Organs. Springer Science & Business Media, 2002. [Google Scholar]
- Jones B, Tonniges JR, Debski A, Albert B, Yeung DA, Gadde N, Mahajan A, Sharma N, Calomeni EP, Go MR, et al. Collagen fibril abnormalities in human and mice abdominal aortic aneurysm. Acta Biomaterialia, 110:129–140, 2020. [DOI] [PMC free article] [PubMed] [Google Scholar]
- Kadler KE, Baldock C, Bella J, and Boot-Handford RP. Collagens at a glance. Journal of Cell Science, 120(12):1955–1958, 2007. [DOI] [PubMed] [Google Scholar]
- Kawamura Y, Murtada SI, Gao F, Liu X, Tellides G, and Humphrey JD. Adventitial remodeling protects against aortic rupture following late smooth muscle-specific disruption of TGFβ signaling. Journal of the Mechanical Behavior of Biomedical Materials, 116:104264, 2021. [DOI] [PMC free article] [PubMed] [Google Scholar]
- Martufi G and Gasser TC. The role of biomechanical modeling in the rupture risk assessment for abdominal aortic aneurysms. Journal of Biomechanical Engineering, 135(2), 2013. [DOI] [PubMed] [Google Scholar]
- McLachlan GJ, Lee SX, and Rathnayake SI. Finite mixture models. Annual Review of Statistics and Its Application, 6:355–378, 2019. [Google Scholar]
- Montero RS and Bribiesca E. State of the art of compactness and circularity measures. International Mathematical Forum, 4(27):1305–1335, 2009. [Google Scholar]
- Morais P, Mota A, Eloy C, Lopes JM, Torres F, Palmeiro A, Tavares P, and Azevedo F. Vascular Ehlers–Danlos syndrome: a case with fatal outcome. Dermatology Online Journal, 17(4), 2011. [PubMed] [Google Scholar]
- Otsu N. A threshold selection method from gray-level histograms. IEEE Transactions on Systems, Man, and Cybernetics, 9(1):62–66, 1979. [Google Scholar]
- Parry DAD, Barnes GRG, and Craig AS. A comparison of the size distribution of collagen fibrils in connective tissues as a function of age and a possible relation between fibril size distribution and mechanical properties. Proceedings of the Royal Society of London. Series B. Biological Sciences, 203 (1152):305–321, 1978. [DOI] [PubMed] [Google Scholar]
- Perumal S, Antipova O, and Orgel JPRO. Collagen fibril architecture, domain organization, and triple-helical conformation govern its proteolysis. Proceedings of the National Academy of Sciences, 105(8):2824–2829, 2008. [DOI] [PMC free article] [PubMed] [Google Scholar]
- Pierce DM, Unterberger MJ, Trobin W, Ricken T, and Holzapfel GA. A microstructurally based continuum model of cartilage viscoelasticity and permeability incorporating measured statistical fiber orientations. Biomechanics and Modeling in Mechanobiology, 15:229–244, 2016. [DOI] [PubMed] [Google Scholar]
- Rego BV. Remodeling of the mitral valve: an integrated approach for predicting long-term outcomes in disease and repair. PhD thesis, The University of Texas at Austin, 2019. [Google Scholar]
- Rego BV and Sacks MS. A functionally graded material model for the transmural stress distribution of the aortic valve leaflet. Journal of Biomechanics, 54:88–95, 2017. [DOI] [PMC free article] [PubMed] [Google Scholar]
- Rego BV, Wells SM, Lee C-H, and Sacks MS. Mitral valve leaflet remodelling during pregnancy: insights into cell-mediated recovery of tissue homeostasis. Journal of the Royal Society Interface, 13(125):20160709, 2016. [DOI] [PMC free article] [PubMed] [Google Scholar]
- Rey WJJ. Introduction to robust and quasi-robust statistical methods. Springer Science & Business Media, 2012. [Google Scholar]
- Shi Z-D and Tarbell JM. Fluid flow mechanotransduction in vascular smooth muscle cells and fibroblasts. Annals of Biomedical Engineering, 39:1608–1619, 2011. [DOI] [PMC free article] [PubMed] [Google Scholar]
- Sibson R. A brief description of natural neighbour interpolation. Interpreting Multivariate Data, 1981. [Google Scholar]
- Starborg T, Kalson NS, Lu Y, Mironov A, Cootes TF, Holmes DF, and Kadler KE. Using transmission electron microscopy and 3View to determine collagen fibril size and three-dimensional organization. Nature Protocols, 8(7):1433–1448, 2013. [DOI] [PMC free article] [PubMed] [Google Scholar]
- Stehbens WE and Martin BJ. Ultrastructural alterations of collagen fibrils in blood vessel walls. Connective Tissue Research, 29(4):319–331, 1993. [DOI] [PubMed] [Google Scholar]
- Vogel A, Holbrook KA, Steinmann B, Gitzelmann R, and Byers PH. Abnormal collagen fibril structure in the gravis form (type I) of Ehlers-Danlos syndrome. Laboratory Investigation, 40(2):201–206, 1979. [PubMed] [Google Scholar]
- Weiss D, Latorre M, Rego BV, Cavinato C, Tanski BJ, Berman AG, Goergen CJ, and Humphrey JD. Biomechanical consequences of compromised elastic fiber integrity and matrix cross-linking on abdominal aortic aneurysmal enlargement. Acta Biomaterialia, 134:422–434, 2021. [DOI] [PMC free article] [PubMed] [Google Scholar]
- Weiss D, Rego BV, Cavinato C, Li DS, Kawamura Y, Emuna N, and Humphrey JD. Effects of age, sex, and extracellular matrix integrity on aortic dilatation and rupture in a mouse model of Marfan syndrome. Arteriosclerosis, Thrombosis, and Vascular Biology, 43(9):e358–e372, 2023. [DOI] [PMC free article] [PubMed] [Google Scholar]
- Zeinali-Davarani S, Wang Y, Chow M-J, Turcotte R, and Zhang Y. Contribution of collagen fiber undulation to regional biomechanical properties along porcine thoracic aorta. Journal of Biomechanical Engineering, 137(5):051001, 2015. [DOI] [PMC free article] [PubMed] [Google Scholar]
Associated Data
This section collects any data citations, data availability statements, or supplementary materials included in this article.


