

Abstract
The present study aimed to summarize and report data on errors related to treatment planning, which were collected by medical physicists. The following analyses were performed based on the 10-year error report data: (1) listing of high-risk errors that occurred and (2) the relationship between the number of treatments and error rates, (3) usefulness of the Automated Plan Checking System (APCS) with the Eclipse Scripting Application Programming Interface and (4) the relationship between human factors and error rates. Differences in error rates were observed before and after the use of APCS. APCS reduced the error rate by ~1% for high-risk errors and 3% for low-risk errors. The number of treatments was negatively correlated with error rates. Therefore, we examined the relationship between the workload of medical physicists and error occurrence and revealed that a very large workload may contribute to overlooking errors. Meanwhile, an increase in the number of medical physicists may lead to the detection of more errors. The number of errors was correlated with the number of physicians with less clinical experience; the error rates were higher when there were more physicians with less experience. This is likely due to the lack of training among clinically inexperienced physicians. An environment to provide adequate training is important, as inexperience in clinical practice can easily and directly lead to the occurrence of errors. In any environment, the need for additional plan checkers is an essential factor for eliminating errors.
Keywords: radiation therapy, human error, treatment planning system, medical incident, medical accident, error detection
INTRODUCTION
The number of patients receiving radiotherapy (RT) has been increasing annually in Japan [1]. In 2013, 1600 patients received RT and 2100 treatments were performed at our institution. However, in 2022, the number of patients increased by a factor of 1.4 to reach 2200, and the number of treatments increased by a factor of 1.7 to reach 3500. Such a large-scale hospital must continue its efforts to eliminate even small errors in the RT process that can lead to a medical accident. RT involves many steps from reception to irradiation and depends on collaboration among many medical professions. In such a complex workflow, it is inadequate to simply check whether each medical professional has performed their tasks in each step; in addition, it is necessary to check the tasks in the previous step that were performed by another professional. This is because each step is a process for implementing the next step, and when an error occurs, it affects all subsequent processes. In fact, medical accidents related to RT can occur at various stages in the process [2–5]. These medical accidents are rarely caused by a single serious error alone; they are more often the result of a series of minor errors. Therefore, to control medical accidents, it is important to understand the types of errors that can potentially occur and how to build a system to detect these errors.
‘The Application of Risk Analysis in Quality Management of Radiotherapy: TG-100’ was published by the American Association of Physicists in Medicine (AAPM) [6]. The AAPM TG-100 guidelines provide a method for the risk analysis of the RT process. This method can be used to organize the risks throughout the process. Many risk analyses of RT based on the TG-100 guidelines have been reported, providing insights into the potential risks and errors associated with the overall treatment as well as the quality control and device implementation process [7–13].
Even before the publication of guidelines for risk and error analysis, such as TG-100, our institution conducted monthly meetings (known as Errors Debrief Meetings [EDMs]) to share information on errors and incidents as well as developing countermeasures with the entire radiotherapy department. Our institution has established its own error countermeasure system that includes incident learning [14–16] and hazard prediction training [17–19]. At EDMs, radiation technologists collect and analyze the errors that occurred during computed tomography (CT) and irradiation process, and medical physicists collect and analyze the errors that occurred during treatment planning and educate all medical professionals involved in RT. The implementation of EDMs is important to improve medical safety awareness and risk management skills in RT.
This study presents our analysis of 10 years of data on errors related to treatment planning that were collected by medical physicists at our institution for EDMs. Although the errors collected at our institution are diverse, those collected by medical physicists are limited to errors related to treatment plans, and other errors cannot be used in the analysis. However, because many medical accidents occur owing to undetected treatment planning errors, conducting an error analysis focused on treatment planning is imperative. Therefore, this report uses only errors related to treatment plans. As the results reported in this study are based on the collection and analysis of actual errors that occurred, we believe that the results are almost complete in terms of errors that can be noticed during treatment planning. We expect that this study will be especially useful for persons who are in charge of managing errors and incidents related to treatment planning.
MATERIALS AND METHODS
Infrastructure and staff
Overall, >2000 patients are treated annually at our institution using various equipment. Our institution has three CT systems for external-beam radiation therapy (EBRT), one CT system for brachytherapy, six EBRT machines (four general-purpose linear accelerators [linac], CyberKnife [Accuray, Inc., Sunnyvale, CA], MRIdian Linac [ViewRay Inc., Cleveland, OH]) and high-dose rate (HDR) brachytherapy system (Flexitron, Elekta AB, Stockholm, Sweden). In addition, we employ many treatment planning systems (TPSs) (10 Eclipse [Varian Medical Systems, Palo Alto, CA], four Multiplan [Accuray, Inc., Sunnyvale, CA] and two Oncentra [Elekta AB, Stockholm, Sweden]). Currently, 14 physicians (nine physicians and five resident physicians), 9 medical physicists (six medical physicists, one part-time medical physicist and two resident medical physicists), 21 radiological technologists and 7 nurses are employed as medical professionals involved in radiation therapy. The main operations during treatment planning by physicians include treatment planning for 3D conformal RT (3D-CRT) and delineation for high precision RT (HPR), such as intensity-modulated RT (IMRT), stereotactic RT (SRT) and stereotactic radiosurgery (SRS). The physician performs the abovementioned operations for each patient alone or with a resident. Medical physicists are responsible for performing treatment planning for HPR and assessing all treatment plans and policies. Radiation technologists are responsible for performing CT, checking the treatment plan before irradiation and performing irradiation. Three to four technologists, led by a chief technologist, are assigned to operate each treatment machine. Two technologists are assigned to perform CT. The device used for an overwhelmingly large number of treatments is the general-purpose linac, followed by brachytherapy, CyberKnife and MRIdian linac.
Treatment planning workflow
Supplementary Fig. 1 shows the EBRT workflow at our institution. The qualified personnel involved in each operation is presented in a process map format.
The 3D-CRT treatment plan is generated by a physician, and the plan is assessed by two medical physicists and two radiation technologists. Treatment planning for HPR such as IMRT, SRT and SRS (including MRIdian linac as well as general-purpose linac) is performed by a medical physicist. For an HPR plan, the first plan check is performed by a treatment planner themselves, and the second plan check is performed by another medical physicist. In treatment planning using Eclipse, the treatment planner themselves and plan checker must always run the Automated Plan Checking System (APCS) using an Eclipse Scripting Application Programming Interface (ESAPI) after the completion of treatment planning. For 3D-CRT planning, a physician performs APCS once, the two medical physicists perform APCS once each and the two radiological technologists perform APCS once each (total of five times APCS performing). For HPR planning, after a medical physicist (who is a treatment planner) performs APCS, one medical physicist (who is a plan checker) performs APCS once and two radiology technicians perform APSC once each (total of four times APCS performing). As the process maps for treatment planning using CyberKnife, MRIdian linac and general-purpose linac are almost identical, the EBRT process map in this study is presented as a representative process map. Supplementary Fig. 2 depicts the HDR brachytherapy workflow in a process map format.
We have two Oncentra TPS instruments for HDR brachytherapy, wherein delineation by a physician and treatment planning (catheter reconstruction, offset, indexer length and prescription dose settings) by a medical physicist are performed simultaneously. After completion of delineation by a physician, the RT structure data in Digital Imaging and Communications in Medicine (DICOM) format are exported from one Oncentra instrument to another. The RT structure DICOM data are imported into the second Oncentra. In the second Oncentra, catheter reconstructions, offset, indexer length and prescription dose settings are already performed by medical physicists. Therefore, imported RT structure DICOM data can be used for dose evaluation and dose distribution adjustment to complete the final treatment plan. After the treatment plan is accepted by the physician, the first plan check is performed by a medical physicist who worked with the physician on the treatment plan and the second plan check is performed by another medical physicist. After the data are transferred to the treatment device, to verify that the data transferred are the same as the generated treatment plan, a plan check is performed again before irradiation by the medical physicist who performed the second plan check and the radiation technologist in charge.
Automated plan checking system using an eclipse scripting application programming interface
At our institution, treatment plans established via Eclipse are assessed using an APCS developed via ESAPI. ESAPI allows users to access treatment plan information using the C# language and Eclipse proprietary classes. APCS can automatically assess the plans for the contents listed in Table 1, and planners and plan checkers can efficiently check plans based on the output obtained from this system. At our institution, after the completion of the treatment plan by a physician, they check the plan using APCS to easily determine whether any problems associated with their treatment plan. The medical physicists and radiation technologists then conduct plan checks using APCS in addition to the plan checks conducted according to the plan check protocol. Because APCS is executed by the ESAPI, the execution of APCS can be assigned to any key as a keyboard shortcut. At our hospital, the contents of Table 1 can be checked in <1 s by pressing the F2 key.
Table 1.
Contents of a plan check via the APCS using the ESAPI
| Primary item | Detectable item | Display | Display timing | Display attention |
|---|---|---|---|---|
| Last calculation | Is the plan calculated? | Content | Only detected | Error |
| Final dose calculation time for treatment planning under check | Value | Always | – | |
| Plan ID | Misconfigured course ID | Content | Only detected | Error |
| Misconfigured plan ID | Content | Only detected | Error | |
| CT-related | If the CT used for treatment planning does not use the most recently taken treatment planning CT | Content | Only detected | Warning |
| Body position is not ‘Head-First Supine’ at the time of planning CT scan and treatment planning. | Content | Only detected | Warning | |
| The CT image ID does not include the date (‘YYMMDD’) on which the CT was taken. | Value | Only detected | Warning | |
| Display CT scan date | Value | Always | – | |
| CT origin is not (x,y,z) = (0,0,0) | Value | Only detected | Error | |
| Display CT value—electron density transfer table | Value | Always | – | |
| CT origin is outside the body. | Content | Only detected | Warning | |
| Distance between CT origin and isocenter too high (>500 mm). | Content | Only detected | Warning | |
| Discrepancy between image orientation and treatment orientation | Content | Only detected | Error | |
| Display of the body position at the time of imaging registered in the CT | Content | Always | – | |
| Structure | When there is a contour with a small area in the axial cross section (<0.001 mm2, structure type: GTV, CTV, PTV, OAR) | Content | Only detected | Warning |
| Machine | Display machine ID | Content | Always | – |
| Treatment planning using old machines | Content | Only detected | – | |
| Selected a noncommissioned treatment machine and created a treatment plan. | Content | Only detected | – | |
| A treatment plan is generated using multiple machines in one plan. | Content | Only detected | Error | |
| Couch setting | Forgot to use a couch. | Content | Only detected | Warning |
| Displays the x-axis position of the center of the couch. | Value | Always | – | |
| Wrong type of couch | Content | Only detected | Warning | |
| Lateral coordinates of the linear accelerator treatment position are displayed. | Value | Only detected | – | |
| Lack of a couch | Content | Only detected | Error | |
| Dose fraction | Dose fraction not entered | Content | Only detected | Error |
| Unusually high number of irradiations for the plan (>49 fr) | Value | Only detected | Error | |
| Low dose (<100 cGy/fr) | Value | Only detected | Error | |
| Display dose in fraction | Value | Always | – | |
| Display fraction | Value | Always | – | |
| Display prescribed dose | Value | Always | – | |
| Reference point | Primary reference point is placed too close to the edge of the irradiation field (<5 mm). | Content | Only detected | Error |
| Primary reference point is located outside the irradiation field. | Content | Only detected | Error | |
| CT value of the primary reference point location is too low (<−300 HU). | Content | Only detected | Warning | |
| Prescribed dose does not match the dose at the primary reference point. | Content | Only detected | Error | |
| No reference point on the plan | Content | Only detected | Warning | |
| No primary reference point on the plan | Content | Only detected | Warning | |
| No dose prescription at the reference point in 3D-CRT. | Content | Only detected | Error | |
| Isocenter and primary reference point location are not the same. | Content | Only detected | Warning | |
| Primary reference point has location information in IMRT/SBRT/electron plans. | Content | Only detected | Warning | |
| Specify the isocenter of particular field to normalize | Content | Only detected | Error | |
| Dose calculation | Display the dose calculation algorithm. | Content | Always | – |
| Displays ON/OFF for the heterogeneity correction. | Content | Always | – | |
| Error indication when the heterogeneity correction is OFF. | Content | Only detected | Error | |
| Field setting | Mismatch between the largest aperture at the leaf collimator and jaw size (within 0.3 mm is acceptable) | Content | Only detected | Error |
| Field weight is 0. | Value | Only detected | Warning | |
| Field is <5 MU. | Value | Only detected | Error | |
| MU/deg below the lower limit in dynamic-arc CRT | Content | Only detected | Error | |
| Using the jaw-tracking mode with VMAT plans | Content | Only detected | Warning | |
| Default dose rate is not used. | Value | Only detected | Warning | |
| MLC is not used. | Content | Only detected | – | |
| Virtual bolus is not linked to each field. | Content | Only detected | Warning | |
| Indication that bolus is linked to all fields | Content | Only detected | – | |
| Two or more isocenters in one treatment plan | Content | Only detected | Warning | |
| FFF is not used when exceeding 800 cGy in fraction (excluding 3DCRT and electron beam). | Content | Only detected | Warning | |
| The joints of both A and B bank leaf collimators when the leaf collimator is completely closed are set within the irradiation field. | Content | Only detected | Error | |
| Dose distribution | D98% of GTVs are < 90% of the prescribed dose. | Value | Only detected | Warning |
| Display the global maximum dose (maximum dose of the external ROI is detected). | Value | Always | – | |
| Electron beam related | Misconfigured SSD | Content | Only detected | Error |
| Misconfigured normalization method | Content | Only detected | Warning | |
| Multiple fields are set. | Content | Only detected | Error | |
| Indication of an electron beam field | Content | Only detected | – | |
| No applicator for the electron beam is inserted in the field. | Content | Only detected | Error | |
| Applicator with a specific name is not used. | Content | Only detected | Error |
Error collection
When errors are detected during plan checks by medical physicists and radiologists, they are noted on a special form and reported to the person in charge of error checking. This person will tally report each month and also be responsible for the final analysis. The mission of the person in charge is presenting analysis results to the medical professionals involved. This report describes the errors (related to treatment planning) that are collected and analyzed by medical physicists. The treatment plan is checked for the contents listed in Table 2. Errors related to treatment planning identified during these checks are classified into frequent and rare errors. The system then distinguishes the errors that can be detected by medical physicists and radiologists from those that cannot be detected; moreover, it assigns a risk level to all errors. Medical awareness is created by presenting this information to the medical professional involved, along with the trends in errors and percentage of errors per number of treatments.
Table 2.
This table shows what the medical physicists and the radiological technologist at our institution check, categorized by each TPS. A ‘〇’ is an item to be checked and a ‘-’ is an item not to be checked
| Check item | Eclipse | Multiplan | MRIdian | Oncentra | |
|---|---|---|---|---|---|
| RTP and plan report consistency | 〇 | 〇 | 〇 | 〇 | |
| Patient and plan information | 〇 | 〇 | 〇 | 〇 | |
| Prescribed dose / Fraction | 〇 | 〇 | 〇 | 〇 | |
| Scheduling | 〇 | 〇 | 〇 | 〇 | |
| RIS/HIS information | 〇 | 〇 | 〇 | 〇 | |
| Radiotherapy treatment history | 〇 | 〇 | 〇 | 〇 | |
| CT image coordinates | 〇 | 〇 | 〇 | 〇 | |
| Targets | 〇 | 〇 | 〇 | 〇 | |
| PTV margin | 〇 | 〇 | 〇 | – | |
| OARs and other structures | 〇 | 〇 | 〇 | 〇 | |
| Density override | 〇 | 〇 | 〇 | – | |
| Plan optimization | 〇 | 〇 | 〇 | 〇 | |
| Plan normalization | 〇 | 〇 | 〇 | 〇 | |
| Dose evaluation and verification of statistics | 〇 | 〇 | 〇 | 〇 | |
| Primary image / secondary image | 〇 | 〇 | 〇 | – | |
| Registration accuracy | 〇 | 〇 | 〇 | – | |
| Couch | 〇 | 〇 | 〇 | – | |
| CT-ED table | 〇 | 〇 | 〇 | – | |
| Beam direction | 〇 | 〇 | 〇 | – | |
| Calculation settings | 〇 | 〇 | 〇 | 〇 | |
| Calculation algorithms | 〇 | 〇 | 〇 | – | |
| Bram energy | 〇 | – | – | – | |
| Dose rate | 〇 | – | – | – | |
| SAD / SSD | 〇 | – | – | – | |
| Field sizes | 〇 | 〇 | – | – | |
| MLC shapes | 〇 | – | – | – | |
| Collision with the patient couch | 〇 | – | – | – | |
| Wedge | 〇 | – | – | – | |
| Bolus | 〇 | – | – | – | |
| Electron block and tray | 〇 | – | – | – | |
| DRR | 〇 | 〇 | – | ||
| Cine | – | – | 〇 | – | |
| MU | 〇 | 〇 | – | – | |
| Isocenter | 〇 | – | 〇 | – | |
| Tracking methods | 〇 | 〇 | 〇 | – | |
| Consistency of rules | – | – | 〇 | – | |
| Treatment time | – | 〇 | 〇 | 〇 | |
| Delivery setting | – | – | 〇 | – | |
| Plan code | – | – | – | 〇 | |
| Data/source strength | – | – | – | 〇 | |
| Applicator coordinate | – | – | – | 〇 | |
| A-points | – | – | – | 〇 | |
| Catheter plot | – | – | – | 〇 | |
| Catheter ID | – | – | – | 〇 | |
| Activation | – | – | – | 〇 | |
| Dwell time | – | – | – | 〇 | |
| Applicator usage | – | – | – | 〇 | |
| Decay time | – | – | – | 〇 | |
| Offset | – | – | – | 〇 | |
Classification and analysis of errors
The errors reported in treatment plan checks from 2012 to 2022 were tabulated and analyzed. These errors were classified into ‘common errors (low-risk error)’ and ‘rare errors (high-risk error)’. Low-risk errors are those that have occurred frequently in previous plan checks. High-risk errors are those that have occurred only 0 to a few times in a year and may be difficult to detect. The errors were listed using the treatment planning device along with their details, total number of occurrences, time period, cause and impact.
These errors were plotted to visualize the change in the quality of errors over the 10-year period. To evaluate whether the introduction of APCS in 2015 influenced the error rates, we determined the mean error rates between 2012 and 2014 and between 2015 and 2022 by performing the Wilcoxon rank-sum test. The causes of errors were explored by dividing and ranking them into the following categories: ‘Operational mistakes’, ‘Lack of plan confirmation’, ‘Lack of knowledge’, ‘Omission’, ‘Lack of information sharing’, ‘Forgetfulness’, ‘Preconception’ and ‘Lack of ability’.
With regard to the relationship between the number of treatments and error rates, the 10-year error reports were examined to check for any correlation between the number of treatments and the rate of errors using Pearson correlation coefficient. In addition, to determine whether there was any periodicity in the occurrence of errors, the mean and standard deviation of the error rate were calculated for each month over the 10-year period.
Analysis of human resources
We analyzed whether the number of treatments and number of physicians and medical physicists (i.e. headcount factors) in each year affected the occurrence of errors in treatment planning from 2016 to 2022, i.e. the period during which APCS was implemented. The roles of physicians and medical physicists in treatment planning are shown in Figs 1 and 2. We evaluated whether the number of years of clinical experience and the number of physicians were related to the occurrence of errors. For this purpose, we examined the correlation between the number of physicians with 1, 2, 3, 4 and more years of clinical experience and the percentage of errors that occurred in each year.
Fig. 1.
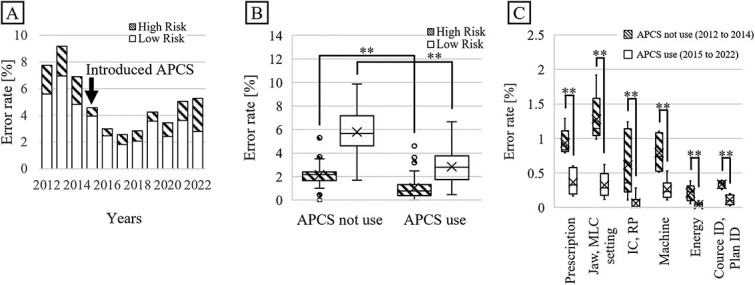
(A) Trend of error rates for each year from 2012 to 2022. (B) Comparison of error rates before and after introduction of APCS. (C) Comparison of the number of errors for error items that significantly decreased with the introduction of APCS. **: p-value < 0.05.
Fig. 2.
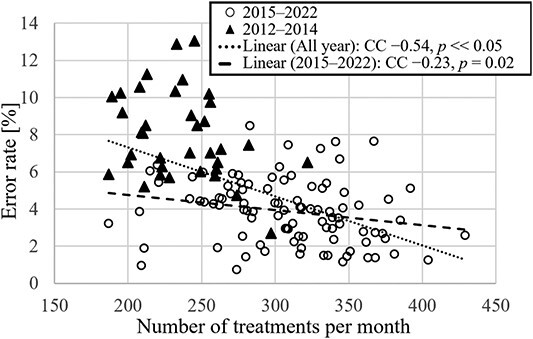
Error rate vs the number of treatments for all months in the analysis period. ▲ indicates data for 2012–2014; 〇 indicates data for 2015–2022. The solid line indicates the approximate line for the 2015–2022 data, and the dotted line indicates the approximate line for the 2012–2022 data.
We examined whether the number of medical physicists is related to the occurrence of errors. The correlation between error rates and number of medical physicists was analyzed, counting a full-time medical physicist as 1 and a part-time medical physicist (who worked 2–3 days per week) as 0.5. Similarly, the relationship between the number of treatments per medical physicist and error rates was analyzed.
Although the sample size was small because the mean error rate was compared with the number of physicians and medical physicists on a yearly basis, Spearman’s rank correlation analysis was performed as there may be significant differences if the correlation coefficient is sufficiently large.
RESULTS
Classification and analysis of errors
Table 3 lists the errors in treatment planning occurred between 2012 and 2022. For each item, the details of the errors classified as high-risk are described. The errors that are not classified as high-risk but have newly emerged or seem to be important are also listed. Figure 1A presents the trend of high- and low-risk error rates for each year from 2012 to 2022. After the introduction of APCS in 2015, the number of both high- and low-risk errors decreased. Figure 1B shows the comparison of the high- and low-risk error rates for before and after introducing APCS. For 2012–2014 and 2015–2022, the mean percentages of high-risk errors were 2.2% and 1.0%, whereas those of low-risk errors were 5.8% and 2.8%, respectively. Figure 1C presents the error item decreased by introducing APCS. Based on the Wilcoxon rank-sum test, the P-values for both types of errors were well below 0.05 (**P<0.01). This indicates that the introduction of APCS can reduce the error rate. Figure 2 shows the relationship between the error rate per month and number of treatments per month for the 10-year period. The correlation coefficient for all plots from 2012 to 2022 was −0.54, with a significant difference (P<0.05). From 2015, when the APCS was introduced, the correlation coefficient increased to −0.23, with a significant difference (P=0.02). Figure 3 shows the causes of the errors that occurred from 2012 to 2022. The errors caused by operational mistakes were the most common, followed by errors caused by the lack of knowledge, including clinical aspects and facility rules. In contrast, only a few errors were caused by human factors such as lack of ability or omission.
Table 3.
List of high-risk errors in our institution. Causes: OM = operational mistakes; LoPC = lack of plan confirmation; LoK = lack of knowledge; Omi = omission; LoIS = lack of information sharing; Fgf = forgetfulness; Pre = preconception; LoA = lack of ability
| Types of TPS | Error items | Details | No. of occurrences | Period [years] | Cause | Influences |
|---|---|---|---|---|---|---|
| Eclipse | Dose in fraction | Error examples are listed below. | 94 | 10 | – | – |
| 1. The prescription dose was set to an equivalent dose of 2 Gy (EQD2). | Pre | 1. Patient detriment due to overdose or underdose prescriptions. | ||||
| Delineation | Error examples are listed below. | 80 | 10 | – | – | |
| 2. ITV did not include some GTV phases. | LoK Pre |
2. The dose to GTV will be insufficient. | ||||
| 3. Forgot delineation and mistakes in delineation (OAR, GTV and CTV). | OM LoK Omi Pre |
3. Patient detriment due to errors in dose evaluation and reduction in treatment effect due to an insufficient irradiation field. | ||||
| 4. Lack of CTV. | LoK LoA |
4. Reduction in treatment effect due to an insufficient irradiation field. | ||||
| 5. The CTV is unnecessarily spacious. | LoK Pre |
5. Wasteful exposure to radiation. | ||||
| 6. Forgetting to delineate the PET integration area. | Fgf | 6. Reduction in treatment effect due to insufficient irradiation coverage. | ||||
| 7. The dose escalation area is delineated incorrectly. | Pre | 7. Reduced therapeutic effect due to low dose. | ||||
| 8. During the replanning process, the contours of the CTV/GTV differed significantly from the original plan. | LoPC Pre |
8. Reduced therapeutic effect due to low dose; wasteful exposure to radiation. | ||||
| 9. Created PTV from the wrong CTV. | Pre | 9. Patient detriment due to irradiation errors. | ||||
| 10. Very small volume (<0.01 cc) contours. | 83 | 6 | OM | 10. Patient disadvantage due to the expansion of PTV. | ||
| 11. The ITV did not contain the GTV of all phases, even though the treatment was scheduled under free breathing. | LoK | 11. Reduction in treatment effect due to insufficient irradiation coverage. | ||||
| 12. Contouring work was performed on CT images (enhanced and SEMAR CT images) that were not used for treatment planning. | OM | 12. Reduced treatment efficacy due to incorrect dose calculations. | ||||
| 13. The subclinical region was not drawn in two-step head and neck IMRT. | LoK LoIS Pre |
13. Wrong medical practice. | ||||
| Inserted couch | – | 79 | 8 | LoK Fgf |
– | |
| Reference point | Error examples are listed below. | 60 | 10 | – | – | |
| 14. Misconfiguration of reference point of type. | 25 | 2 | Fgf | 14. Delay of treatment due to warning indication before irradiation. | ||
| 15. Reference point misplaced. | OM | 15. Patient detriment due to uncertain dose prescription. | ||||
| 16. Wrong choice of reference point. | Pre | 16. Patient detriment due to uncertain dose prescription. | ||||
| 17. Forgot to set up the reference point. | OM Fgf |
17. Patient detriment due to uncertain dose prescription. | ||||
| 18. The dose limit in the reference point is in cGy notation, but I mistakenly entered the value in the Gy notation. | LoK LoIS |
18. Patient detriment due to uncertain dose prescription. | ||||
| Course and plan ID | – | 48 | 10 | – | – | |
| Irradiation | Error examples are listed below. | 122 | 10 | – | – | |
| fields | 19. In whole-brain irradiation, the lower edge of the irradiation field was set to C1 or C3, even though it was supposed to extend up to C2 of the spine. | LoPC LoK LoIS |
19. Reduction in treatment effect and unnecessary exposure to radiation due to wrong irradiation range. | |||
| 20. In the treatment plan for gynecological lesions, a plan with a center shield in two fields should have been made, but it was made in four fields. | Pre | 20. Under-irradiation of the target or unnecessary exposure. | ||||
| 21. The irradiation field was not reset even though the isocenter was moved after setting the irradiation field. | Fgf | 21. Under-irradiation of the target or unnecessary exposure | ||||
| 22. In the treatment plan for gynecological lesions, the width of the center shield was incorrect. | OM | 22. Under-irradiation of the target or unnecessary exposure. | ||||
| 23. The irradiation area was insufficient for mammary gland irradiation. | LoK | 23. Reduced therapeutic effect due to low dose. | ||||
| 24. The lower edge of one of the irradiation fields in the mammary irradiation plan was not aligned. | Fgf | 24. Unnecessary exposure. | ||||
| 25. The child irradiation field was larger than the parent field in the field-in-field plan. | OM | 25. Wrong dose distribution. | ||||
| 26. The MLC was fitted to a CTV that was not interpolated. | LoPC | 26. Under-irradiation of the target or unnecessary exposure. | ||||
| 27. The maximum irradiation field was not optimized in VMAT and was wide relative to the PTV. | OM LoK |
27. Unnecessary exposure. | ||||
| HIS, RIS | Error examples are listed below. | 49 | 3 | – | – | |
| 28. Even though the right leg was to be irradiated, the RIS and HIS comment boxes stated that the left leg was to be irradiated. | OM LoPC |
28. Mistakes in treatment. | ||||
| 29. The prescribed doses listed in the RIS, HIS and Plan differed. | Omi | 29. Patient detriment due to uncertain dose prescription. | ||||
| Beam | Error examples are listed below. | 25 | 10 | – | – | |
| arrangement | 30. The gantry angle of the field is wrong in the breast treatment plan. | OM LoPC |
30. Unnecessary exposure. | |||
| 31. The weights of the parent and child fields were reversed in the field-in-field plan. | OM LoPC |
31. Mistakes in treatment. | ||||
| 32. The arrangement was such that the cone contacted the patient for the electron beam plan. | LoPC LoK |
32. Physical harm to the patient. | ||||
| 33. The irradiation field was far beyond the midline in the breast treatment plan. | LoPC Fgf |
33. Unnecessary exposure. | ||||
| 34. The gantry angles of the parent and child fields differed in the field-in-field plan. | OM | 34. Wrong dose distribution. | ||||
| 35. Incorrect couch rotation. | OM | 35. Mistakes in treatment. | ||||
| 36. Wrong weight of the field. | Pre | 36. Under-irradiation of the target or unnecessary exposure. | ||||
| 37. In the VMAT, a plan was made where the couch and gantry interfered with each other. | LoK Fgf |
37. Physical harm to the patient. | ||||
| 38. In the 3DCRT plan for whole-brain and whole-spinal cord irradiation, the vertical of the field was off by 1 mm only for the whole-brain plan. | OM | 38. Over-irradiation and under-irradiation of the target or unnecessary exposure. | ||||
| 39. The applicator selection for the electron beam plan was incorrect. | LoK | 39. Treatment cannot be implemented. | ||||
| 40. The isocenter was too deep, and the gantry did not rotate. | LoK | 40. Physical harm to the patient. | ||||
| Machine ID | – | 23 | 10 | – | – | |
| Lack of confirmation of radiation therapy history | Error examples are listed below. | 24 | 4 | – | – | |
| 41. The overlap between the past and present dose distributions was not confirmed. | LoPC LoIS |
41. Excessive irradiation of normal tissue. | ||||
| Bolus | – | 19 | 10 | – | – | |
| Isocenter | Error examples are listed below. | 16 | 10 | – | – | |
| 42. The isocenter was set outside the body. | OM | 42. Treatment cannot be implemented. | ||||
| 43. The isocenter was not set to monoisocentric in treating the breast and supraclavicular lymph. | OM LoK |
43. Over-irradiation and under-irradiation of the target. | ||||
| Energy | – | 11 | 10 | – | – | |
| Dose rate | – | 9 | 10 | – | – | |
| PTV margin | Error examples are listed below. | 8 | 10 | – | – | |
| 44. The PTV was not made again, even though the CTV was redrawn after the PTV was made. | Fgf | 44. Under-irradiation of the target. | ||||
| 45. The irradiation field was made for the wrong margin PTV. | Fgf | 45. Under-irradiation to the target. | ||||
| Normalize | – | 6 | 10 | – | – | |
| Wedge | – | 3 | 10 | – | – | |
| Dose calculation algorithm | – | 2 | 10 | – | – | |
| Patient name | – | 0 | 10 | – | – | |
| Patient ID | – | 0 | 10 | – | – | |
| Images | Error examples are listed below. | 33 | 10 | – | – | |
| 46. CT image orientation error. | OM LoK |
46. The irradiated area could be incorrect. | ||||
| 47. In principle, the contour should be delineated on the expiratory image; however, it was delineated on the inspiratory image. | OM | 47. The plan will differ from the actual irradiation. | ||||
| 48. Planning using old CT images. | OM LoPC |
48. Mistakes in treatment. | ||||
| 49. CT images were imported to a different patient. | OM | 49. Possibility of irradiating different patients. | ||||
| 50. Contours were delineated on SEMAR images when, in principle, they should have been delineated on expiratory images. | OM | 50. Possibility of incorrect dose distribution. | ||||
| 51. The registration of simple CT and contrast-enhanced CT was out of alignment. | LoA | 51. Dose errors due to misdelineated targets or OARs. | ||||
| 52. Misregistration between CT and PET images. | LoA | 52. Dose errors due to misdelineated targets or OARs. | ||||
| 53. CT and MR images were out of registration. | LoA | 53. Dose errors due to misdelineated targets or OARs. | ||||
| 54. Although it was known that 3D-CRT would be started first and then changed to IMRT in the middle of the procedure, CT was not taken with the high-precision protocol. | LoIS | 54. Errors in treatment due to reduced irradiation accuracy. | ||||
| 55. The CT was taken after setting up the patient without setting the CT origin to 0. | OM Fgf |
55. It might not be possible to irradiate. | ||||
| 56. A simple CT should have been taken, but only a contrast CT was taken. | Fgf Pre |
56. Incorrect dose distribution calculation. | ||||
| 57. Treatment planning was done using SEMAR images when simple CT images should have been used. | OM LoPC Pre |
57. Incorrect dose distribution calculation. | ||||
| 58. The electron beam boost plan was planned using inhaling images. | OM LoPC Pre |
58. The plan will differ from the actual irradiation. | ||||
| 59. Deep-inspiration images were not taken, even though they were ordered. | LoIS Pre |
59. The plan will differ from the actual irradiation. | ||||
| And so forth | Error examples are listed below. | 23 | – | – | ||
| 60. Error in the CT-to-ED conversion table used. | OM | 60. Error in dose calculation. | ||||
| 61. Wrong breast to be irradiated on the left or right. | LoIS Pre |
61. Mistakes in treatment. | ||||
| 62. Wrong left-to-right irradiation site due to a misunderstanding between the head-first and feet-first spines. | LoIS Pre |
62. Mistakes in treatment. | ||||
| 63. Wrong femur to be irradiated on the left or right. | LoIS Pre |
63. Mistakes in treatment. | ||||
| 64. There was no tongue-restraining part on the mouthpiece when irradiating the root of the tongue. | LoK LoIS |
64. Over-irradiation and under-irradiation of the target. | ||||
| 65. In irradiating the cervical spine, the irradiation site was wrong for one vertebra. | LoPC | 65. Mistakes in treatment. | ||||
| 66. The resident and staff physicians disagreed on the treatment plan, and the treatment plan was redesigned. | LoIS | 66. Possible progression of the disease due to delay in treatment. | ||||
| 67. The vertebral irradiation location listed in the HIS and RIS differed from the location in the treatment plan. | LoPC Pre |
67. Mistakes in treatment. | ||||
| 68. When the replan was made, a GTV was drawn that was not in the initial plan. | LoPC | 68. Over-irradiation and under-irradiation of the target or unnecessary exposure. | ||||
| 69. No one took over the treatment plan of the doctor, who took a leave of absence due to COVID-19 infection and 1 day before the treatment date, it was found that the treatment plan was not drawn up. | LoIS | 69. Possible progression of the disease due to delay in treatment. | ||||
| Multiplan | 70. Contour correction was not turned on. | 4 | OM Fgf |
70. Error in dose calculation. | ||
| 71. Insufficient GTV delineation. | LoPC | 71. Under-irradiation of the target. | ||||
| 72. Excessive GTV delineation. | 1 | LoPC | 72. Unnecessary exposure. | |||
| 73. Wrong setting of fusion ROI on CT and MRI images. | 1 | OM LoK |
73. Under-irradiation of the target or unnecessary exposure due to GTV delineation error. | |||
| 74. Wrong delineation of OAR. | 1 | OM | 74. Wrong evaluation in OAR. | |||
| 75. The lens was not set to avoidance. | 1 | OM | 75. Might cause cataracts. | |||
| 76. The align center was not symmetrical. | 1 | LoK | 76. It might cause failures in image-matching. | |||
| 77. The collimator size was large, and dose distribution was spread unnecessarily. | 3 | OM LoA |
77. Unnecessary exposure. | |||
| 78. Old CT and MRI images were used for planning. | 1 | LoPC | 78. Mistakes in treatment. | |||
| 79.]CT and MRI images were planned without registration. | 1 | Pre | 79. Under-irradiation of the target or unnecessary exposure. | |||
| 80. The irradiation date and prescribed dose differed between the plan and RIS. | 1 | LoIS | 80. Mistakes in treatment. | |||
| MRIdian | 81. The registration between the MRI and CT images was misaligned. | 1 | LoA | 81. Mistakes in treatment. | ||
| 82. Wrong selection of CT-to-ED table. | 1 | OM | 82. Error in dose calculation. | |||
| 83. The dose constraint was set to D0.5% instead of D0.5cc. | 1 | OM | 83. Mistakes in treatment due to wrong dose normalization and evaluation. | |||
| 84. The tracking target was set to PTV. | 1 | OM | 84. The targets cannot be adequately tracked. | |||
| 85. The boundary was incorrectly set. | 1 | OM | 85. The targets cannot be adequately tracked. | |||
| 86. The cine image used to confirm the treatment position was accidentally erased. | 1 | OM | 86. Re-imaging will be required. | |||
| 87. Incorrect couch position. | 1 | OM | 87. Error in dose calculation. | |||
| 88. The water ROI was incorrectly delineated. | 1 | LoPC | 88. Error in dose calculation. | |||
| 89. Forgot to delineate air ROI. | 1 | OM | 89. Error in dose calculation. | |||
| Oncentra | 90. A CT image was obtained with a marker in the catheter; however, the marker was slightly out of the catheter, and the tip of the catheter was misplaced. | 1 | LoK | 90. Error in dose calculation. | ||
| 91. Patient selection error in scout imaging. | 2 | OM | 91. Inconsistencies in patient information. | |||
| 92. Incorrect reconstruction and transfer tube numbers on the treatment plan. | 1 | OM | 92. Mistakes in treatment. | |||
| 93. Incorrect oncosmart connection. | 1 | OM | 93. Mistakes in treatment. | |||
| 94. Incorrect offset value. | 3 | LoPC | 94. Error in dose calculation. | |||
| 95. Incorrect indexer value. | 2 | OM | 95. Mistakes in treatment. | |||
| 96. The ovoid moved by ~2 cm when connecting the transfer tube. | 1 | OM | 96. Mistakes in treatment. |
Fig. 3.
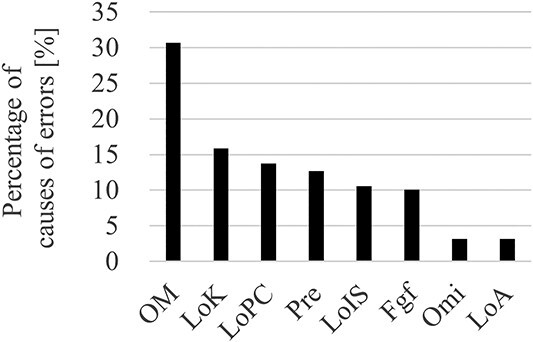
Bar graph of causes of errors that occurred between 2012 and 2022. OM = operational mistaken; LoK = lack of knowledge; LoPC = lack of plan confirmation; Pre = preconception; LoIS = lack of information sharing; Fgf = forgetfulness; Omi = omission; LoA = lack of ability.
Analysis of human resource errors
We evaluated whether the number of years of clinical experience and number of physicians are related to the occurrence of errors by examining the correlation between the number of physicians with 1, 2, 3, 4 and more years of clinical experience and the percentage of errors that occurred in each year. Significant correlations were noted between the number of physicians with <1 year of clinical experience and error rates and between the number of physicians with ≥1 year (1 year or more) of clinical experience and error rates. Figure 4 shows the relationship between the number of physicians with <1 year and ≥ 1 year of experience and the error rate for a given year between 2015 and 2022. We observed a trend of lower error rates in years when there were more physicians with more experience and higher error rates in years when there were more physicians with less years of experience. Although the sample size was small because this analysis was performed using annual data, we obtained a correlation coefficient of 0.73 between the error rate and the number of physicians with <1 year of experience and a correlation coefficient of −0.92 between the error rate and the number of physicians with ≥1 year of experience. Both calculated correlation coefficients were high.
Fig. 4.
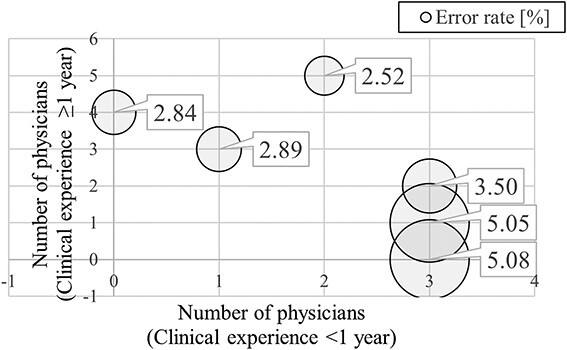
Relationship between the number of physicians with <1 year and ≥1 year of experience and the error rate for each year. The horizontal axis represents the number of physicians with <1 year of clinical experience, the vertical axis represents the number of physicians with ≥1 year of clinical experience and the size of the bubble represents the magnitude of the error rate.
Figure 5 shows the relationship between the number of detected high-risk errors per medical physicist and the number of detected high-risk errors per number of treatments per medical physicist. The number of detected high-risk errors increased with an increasing number of medical physicists. The correlation coefficient was 0.88. When the number of treatments per medical physicist increased, the number of errors decreased, and the correlation coefficient was −0.82. Both of these correlation coefficients are very high, with P-values being well below 0.05 (high-risk error: P<0.05, low-risk error: P<0.05), indicating significant differences. This result shows that although an increase in the number of medical physicists improves the ability to detect errors, an increase in the workload of medical physicists results in an inability to detect high-risk errors.
Fig. 5.
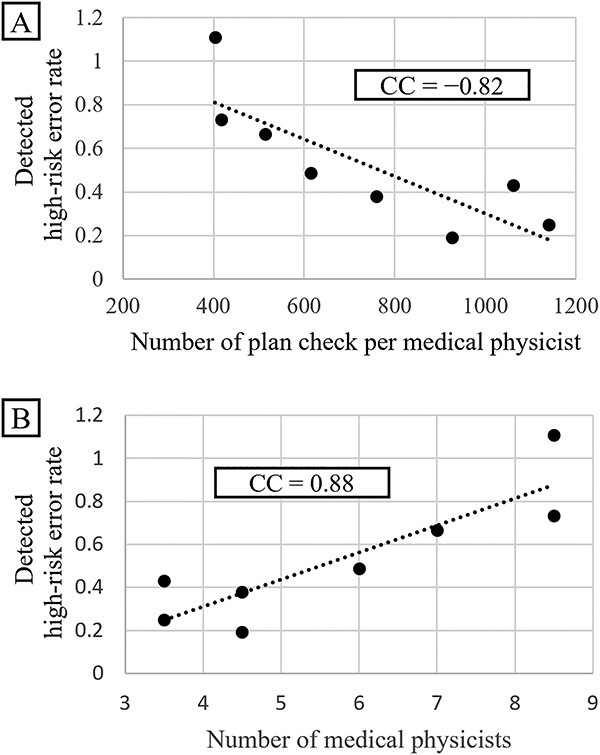
Relationship of the high-risk error rates with the number of treatment per medical physicist (A) and with the number of medical physicists (B).
DISCUSSION
We investigated the causes of errors in the treatment planning for RT from various perspectives based on the 10-year error reports. We also examined the usefulness of APCS using ESAPI as a substitute for assessment by humans.
Table 3 lists the errors (especially high-risk errors) that occurred in our clinic over the past decade. This list includes errors that occurred only with certain versions of the equipment many years ago, which have now been addressed by the manufacturers. Any incidents that occurred despite error checking were not included in the list.
The automation of treatment planning checks and automated treatment planning checks using ESAPI have been widely reported [20–22]. In general, the literature has described the usefulness of such automated treatment plan checking, and the current study showed similar usefulness of automation. After incorporating APCS using ESAPI, the error rate corresponding to the number of treatments decreased by ~1% for high-risk errors and ~3% for low-risk errors (Fig. 1). Forty-two items were determined to be suitable for automating treatment planning checks using ESAPI [21]. However, in this study, we used 62 APCS check items (Table 1). These items were added to the ESAPI when errors actually occurred and could be solved by ESAPI. Thus, these 62 items are more in line with the errors that occur in clinical practice. The automated plan check tool can assess 89 items, and there is scope for further exploring whether ESAPI can detect more errors [21]. The results of the present study revealed a reduction in error rates by a small percentage, which corresponds to a substantial number of treatments (3000 treatments per year) for a large hospital, demonstrating that APCS can improve the medical safety and efficiency of the treatment plan checking process.
The analysis of the relationship between the number of treatments and error rate showed that the error rate decreased with increasing number of treatments (Fig. 2). The negative correlation and significant difference between the number of treatments and error rates regardless of the introduction of APCS suggest that they are closely related statistically. As we considered human factors as the main reason for this relationship, we focused on human factors and found that the detected high-risk error rate decreased with an increase in the number of treatments per medical physicist performing HPR planning and treatment plan checking (Fig. 5A, correlation coefficient = −0.82, P<0.05). This increase in the number of treatments directly translated into an increase in the number of planned checks and HPR plans per medical physicist. This finding revealed that a very large workload per medical physicist may be a factor affecting the overlooking of errors. In contrast, an increase in the number of medical physicists increased the number of detected high-risk errors (Fig. 5B, correlation coefficient = −0.88, P<0.05). This is probably due to several factors, including the fact that the availability of more medical physicists can reduce the workload, allowing them to check for errors appropriately and that more medical physicists with various backgrounds and opinions are aware of errors that were previously overlooked.
The American Society for Radiation Oncology report ‘Safety is no accident’ recommends 250 treatments per treatment planner per year [23], and the number of treatments per planner at our institution greatly exceeds this value. As shown in Fig. 5A, the workload per medical physicist can be further reduced to detect more errors. Hence, examination of the appropriate workload is crucial from the perspective of medical safety, and efforts are needed to maintain the appropriate workload. The relationship between the increase in error rate, number of medical physicists and number of residencies discussed above is also shown in Fig. 1, where the error rate increases each year in the high-risk error graph from 2019 to 2022. The number of physician residents and medical physicists increased yearly between 2019 and 2022, with the highest number of residents and medical physicists in their first year in 2022.
Figure 4 shows the relationship of error rates with the number of years of clinical experience and the number of physicians who are planners. It can be observed that the greater the number of physicians with <1 year of clinical experience, the higher the error rate. In contrast, the fewer the number of physicians with <1 year of clinical experience, the lower the error rate. Additionally, the graph shows that the fewer the number of physicians with ≥1 year of clinical experience, the higher the error rate, and the more the number of physicians with ≥1 year of clinical experience, the lower the error rate. It can also be seen that even if some physicians have <1 year of clinical experience, the error rate will be lower if more physicians have ≥1 year of clinical experience. This finding shows that planners with less clinical experience can cause errors and that sufficient experience (including not only clinical experience but also training against errors) will reduce errors.
The most common cause of errors was operational mistakes, followed by insufficient knowledge and confirmation of plan information (Fig. 3). Operational mistakes include the following events: when the dose rate was assumed to be changed to 600 MU/min, but it was not changed, or when the gantry angle was operated by mistake after planning, and the user did not notice it. Although these mistakes could lead to fatal incidents, most of them were noticed effectively during normal checks. The next most common cause is a lack of knowledge, which includes a lack of clinical knowledge or knowledge regarding the rules of the institution. Such errors can be missed easily if planners and checkers have insufficient knowledge. These two causal errors can occur more frequently when the healthcare providers are inexperienced. This makes to believe that the key to reducing error rates is to accelerate the learning of causes and effects of errors and incidents by inexperienced treatment planners and plan checkers. To this end, incident learning [14–16] and hazard prediction training [17–19] are extremely robust error reduction strategies. Moreover, APCSs are effective tools for such cases [20]. However, because of the limitations of automated plan checks (i.e. some functions are unavailable as variables in ESAPI even though they are used in the treatment plan), efficient and adequate education of the healthcare professionals is necessary to ensure medical safety.
This study has certain limitations. It is based on error reports from a single facility; therefore, the study results are not necessarily accurate. Furthermore, although institutional rules exist regarding the criteria of errors to be reported, the reporters, being human, may forget to report errors. The APCS results also include other factors such as equipment upgrades, changes in staffing, experience and treatment techniques. These factors should be eliminated to determine the effect of APCS alone; however, they were not eliminated in this study. The results of this study cannot be considered all-inclusive as many other factors are involved in the occurrence of errors. However, these results were sufficiently comprehensive, conformed to the guidelines of the AAPM (e.g. TG-275 and TG-100 report [6, 24]) and their related reports and included the relevant data to further interpolate these guidelines. To the best of our knowledge, no other report has analyzed and summarized such a large number of errors over a decade. There may be a few reports that provide statistical evidence regarding the relationship among the number of treatments, human factors of treatment planners and treatment plan checkers and error reporting rates in treatment planning. We believe that this study can provide important data for safe RT.
In conclusion, the introduction of APCS using ESAPI can reduce the number of errors permanently. An increase in the number of treatment planners with limited clinical experience may be a factor contributing to the occurrence of errors. Furthermore, an increase in the number of treatments and an increase in the workload of the plan checkers may be factors that reduce the error-detecting rate. Increasing the number of medical physicists working as plan checkers can be the first step to identifying more high-risk errors. Furthermore, measures to rapidly and efficiently communicate the importance of medical safety to medical personnel with less clinical experience and constant consideration of the appropriate workload of the personnel involved are critical factors for medical safety, and efforts are needed to implement such measures.
CONFLICT OF INTEREST
The authors declare that there is no conflict of interest that could be perceived as prejudicing the impartiality of the research reported.
FUNDING
This study was partially supported by the JSPS KAKENHI Grant Number JP22K15872 and the National Cancer Center Research and Development Fund (2022-A-18).
DATA AVAILABILITY
The authors confirm that the data supporting the findings of this study are available within the article.
Supplementary Material
Contributor Information
Kotaro Iijima, Section of Radiation Safety and Quality Assurance, National Cancer Center Hospital, 5-1-1 Tsukiji, Chuo-ku, Tokyo 104-0045, Japan; Department of Radiation Oncology, Juntendo University Graduate School of Medicine, 2-1-1 Hongo, Bunkyo-ku, Tokyo 113-8421, Japan.
Hiroki Nakayama, Section of Radiation Safety and Quality Assurance, National Cancer Center Hospital, 5-1-1 Tsukiji, Chuo-ku, Tokyo 104-0045, Japan; Department of Radiological Sciences, Graduate School of Human Health Sciences, Tokyo Metropolitan University, 7-2-10 Higashi-ogu, Arakawa-ku, Tokyo 116-8551, Japan.
Satoshi Nakamura, Section of Radiation Safety and Quality Assurance, National Cancer Center Hospital, 5-1-1 Tsukiji, Chuo-ku, Tokyo 104-0045, Japan.
Takahito Chiba, Section of Radiation Safety and Quality Assurance, National Cancer Center Hospital, 5-1-1 Tsukiji, Chuo-ku, Tokyo 104-0045, Japan; Department of Radiological Sciences, Graduate School of Human Health Sciences, Tokyo Metropolitan University, 7-2-10 Higashi-ogu, Arakawa-ku, Tokyo 116-8551, Japan.
Yasunori Shuto, Department of Radiological Technology Radiological Oncology, National Cancer Center Hospital, 5-1-1 Tsukiji, Chuo-ku, Tokyo 104-0045, Japan; Department of Medical and Dental Sciences, Graduate School of Biomedical Sciences, Nagasaki University, 1-12-4 Sakamoto, Nagasaki city, Nagasaki, 852-8523, Japan.
Yuka Urago, Section of Radiation Safety and Quality Assurance, National Cancer Center Hospital, 5-1-1 Tsukiji, Chuo-ku, Tokyo 104-0045, Japan; Department of Radiological Sciences, Graduate School of Human Health Sciences, Tokyo Metropolitan University, 7-2-10 Higashi-ogu, Arakawa-ku, Tokyo 116-8551, Japan.
Shuka Nishina, Section of Radiation Safety and Quality Assurance, National Cancer Center Hospital, 5-1-1 Tsukiji, Chuo-ku, Tokyo 104-0045, Japan; Department of Radiological Technology Radiological Oncology, National Cancer Center Hospital, 5-1-1 Tsukiji, Chuo-ku, Tokyo 104-0045, Japan.
Hironori Kishida, Section of Radiation Safety and Quality Assurance, National Cancer Center Hospital, 5-1-1 Tsukiji, Chuo-ku, Tokyo 104-0045, Japan.
Yuta Kobayashi, Section of Radiation Safety and Quality Assurance, National Cancer Center Hospital, 5-1-1 Tsukiji, Chuo-ku, Tokyo 104-0045, Japan.
Jun Takatsu, Department of Radiation Oncology, Juntendo University Graduate School of Medicine, 2-1-1 Hongo, Bunkyo-ku, Tokyo 113-8421, Japan.
Junichi Kuwahara, Department of Radiological Technology Radiological Oncology, National Cancer Center Hospital, 5-1-1 Tsukiji, Chuo-ku, Tokyo 104-0045, Japan.
Ako Aikawa, Department of Radiological Technology Radiological Oncology, National Cancer Center Hospital, 5-1-1 Tsukiji, Chuo-ku, Tokyo 104-0045, Japan.
Tomonori Goka, Department of Radiological Technology Radiological Oncology, National Cancer Center Hospital, 5-1-1 Tsukiji, Chuo-ku, Tokyo 104-0045, Japan.
Tomoya Kaneda, Department of Radiation Oncology, National Cancer Center Hospital, 5-1-1 Tsukiji, Chuo-ku, Tokyo 104-0045, Japan.
Naoya Murakami, Department of Radiation Oncology, Juntendo University Graduate School of Medicine, 2-1-1 Hongo, Bunkyo-ku, Tokyo 113-8421, Japan; Department of Radiation Oncology, National Cancer Center Hospital, 5-1-1 Tsukiji, Chuo-ku, Tokyo 104-0045, Japan.
Hiroshi Igaki, Department of Radiation Oncology, National Cancer Center Hospital, 5-1-1 Tsukiji, Chuo-ku, Tokyo 104-0045, Japan.
Hiroyuki Okamoto, Section of Radiation Safety and Quality Assurance, National Cancer Center Hospital, 5-1-1 Tsukiji, Chuo-ku, Tokyo 104-0045, Japan.
References
- 1. Japanese Structure Survey of Radiation Oncology in 2019 [First Report]. https://www.jastro.or.jp/medicalpersonnel/data_center/JASTRO_NSS_2019-01.pdf.
- 2. Fraass BA. Impact of complexity and computer control on errors in radiation therapy. Ann ICRP 2012;41:188–96. 10.1016/j.icrp.2012.06.011. [DOI] [PubMed] [Google Scholar]
- 3. Williams MV. Improving patient safety in radiotherapy by learning from near misses, incidents and errors. Br J Radiol 2007;80:297–301. 10.1259/bjr/29018029. [DOI] [PubMed] [Google Scholar]
- 4. Huang G, Medlam G, Lee J et al. Error in the delivery of radiation therapy: results of a quality assurance review. Int J Radiat Oncol Biol Phys 2005;61:1590–5. 10.1016/j.ijrobp.2004.10.017. [DOI] [PubMed] [Google Scholar]
- 5. Walker GV, Johnson J, Edwards T et al. Factors associated with radiation therapy incidents in a large academic institution. Pract Radiat Oncol 2015;5:21–7. 10.1016/j.prro.2014.03.005. [DOI] [PubMed] [Google Scholar]
- 6. Huq MS, Fraass BA, Dunscombe PB et al. The report of task group 100 of the AAPM: application of risk analysis methods to radiation therapy quality management. Med Phys 2016;43:4209–62. 10.1118/1.4947547. [DOI] [PMC free article] [PubMed] [Google Scholar]
- 7. Ford EC, Gaudette R, Myers L et al. Evaluation of safety in a radiation oncology setting using failure mode and effects analysis. Int J Radiat Oncol Biol Phys 2009;74:852–8. 10.1016/j.ijrobp.2008.10.038. [DOI] [PMC free article] [PubMed] [Google Scholar]
- 8. Denny DS, Allen DK, Worthington N, Gupta D. The use of failure mode and effect analysis in a radiation oncology setting: the cancer treatment Centers of America experience. J Healthc Qual 2014;36:18–28. 10.1111/j.1945-1474.2011.00199.x. [DOI] [PubMed] [Google Scholar]
- 9. Cantone MC, Ciocca M, Dionisi F et al. Application of failure mode and effects analysis to treatment planning in scanned proton beam radiotherapy. Radiat Oncol 2013;8:127. 10.1186/1748-717X-8-127. [DOI] [PMC free article] [PubMed] [Google Scholar]
- 10. Nealon KA, Balter PA, Douglas RJ et al. Using failure mode and effects analysis to evaluate risk in the clinical adoption of automated contouring and treatment planning tools. Pract Radiat Oncol 2022;12:e344–53. 10.1016/j.prro.2022.01.003. [DOI] [PubMed] [Google Scholar]
- 11. Takemori M, Nakamura S, Sofue T et al. Failure modes and effects analysis study for accelerator-based boron neutron capture therapy. Med Phys 2023;50:424–39. 10.1002/mp.16104. [DOI] [PubMed] [Google Scholar]
- 12. Roles SA, Hepel JT, Leonard KL et al. Quantifying risk using FMEA: an alternate approach to AAPM TG-100 for scoring failures and evaluating clinical workflow. Brachytherapy 2021;20:922–35. 10.1016/j.brachy.2021.02.005. [DOI] [PubMed] [Google Scholar]
- 13. Nishioka S, Okamoto H, Chiba T et al. Identifying risk characteristics using failure mode and effect analysis for risk management in online magnetic resonance-guided adaptive radiation therapy. Phys Imaging Radiat Oncol 2022;23:1–7. 10.1016/j.phro.2022.06.002. [DOI] [PMC free article] [PubMed] [Google Scholar]
- 14. Ford EC, Smith K, Harris K, Terezakis S. Prevention of a wrong-location misadministration through the use of an intradepartmental incident learning system. Med Phys 2012;39:6968–71. 10.1118/1.4760774. [DOI] [PubMed] [Google Scholar]
- 15. Ford EC, de LosF, Santos L et al. Consensus recommendations for incident learning database structures in radiation oncology. Med Phys 2012;39:7272–90. 10.1118/1.4764914. [DOI] [PubMed] [Google Scholar]
- 16. Evans SB, Ford EC. Radiation oncology incident learning system: a call to participation. Int J Radiat Oncol Biol Phys 2014;90:249–50. 10.1016/j.ijrobp.2014.05.2671. [DOI] [PubMed] [Google Scholar]
- 17. Murai Y, Sato M, Yamaguchi H et al. Introducing hazard prediction training “KYT” to undergraduate pharmacy education on patient safety. Yakugaku Zasshi J Pharm Soc Jpn 2009;129:1367–73. 10.1248/yakushi.129.1367. [DOI] [PubMed] [Google Scholar]
- 18. Šeibokaitė L, Endriulaitienė A, Markšaitytė R, Slavinskienė J. Improvement of hazard prediction accuracy after training: moderation effect of driving self-efficacy and road safety attitudes of learner drivers. Saf Sci 2022;151:105742. 10.1016/j.ssci.2022.105742. [DOI] [Google Scholar]
- 19. Sato Y, Okamoto S, Kayaba K et al. Effectiveness of role-play in hazard prediction training for nursing students: a randomized controlled trial. J Nurs Educ Pract 2018;8:1–7. [Google Scholar]
- 20. Halabi T, Lu HM. Automating checks of plan check automation. J Appl Clin Med Phys 2014;15:1–8. 10.1120/jacmp.v15i4.4889. [DOI] [PMC free article] [PubMed] [Google Scholar]
- 21. Liu S, Bush KK, Bertini J et al. Optimizing efficiency and safety in external beam radiotherapy using automated plan check (APC) tool and six sigma methodology. J Appl Clin Med Phys 2019;20:56–64. 10.1002/acm2.12678. [DOI] [PMC free article] [PubMed] [Google Scholar]
- 22. Halabi T, Lu HM, Bernard DA et al. Automated survey of 8000 plan checks at eight facilities. Med Phys 2016;43:4966–72. 10.1118/1.4959999. [DOI] [PubMed] [Google Scholar]
- 23. American Society for Therapeutic Radiology and Oncology . Safety Is no Accident: A Framework for Quality Radiation Oncology and Care. America: American Society for Radiation Oncology, 2019. https://www.astro.org/uploadedFiles/Main_Site/Clinical_Practice/Patient_Safety/Blue_Book/SafetyisnoAccident.pdf.
- 24. Ford E, Conroy L, Dong L et al. Strategies for effective physics plan and chart review in radiation therapy: report of AAPM task group 275. Med Phys 2020;47:e236–72. 10.1002/mp.14030. [DOI] [PMC free article] [PubMed] [Google Scholar]
Associated Data
This section collects any data citations, data availability statements, or supplementary materials included in this article.
Supplementary Materials
Data Availability Statement
The authors confirm that the data supporting the findings of this study are available within the article.