

Abstract
Background
Several abdominal obesity indices including waist circumference (WC), waist–hip ratio (WHR), visceral adiposity index (VAI), lipid accumulation product (LAP), and Chinese visceral adiposity index (CVAI) were considered effective and useful predictive markers for cardiovascular disease (CVD) in general populations or diabetic populations. However, studies investigating the associations between these indices among postmenopausal women are limited. Our study aimed to investigate the associations of the five indices with incident CVD and compare the predictive performance of CVAI with other abdominal obesity indices among postmenopausal women.
Methods
A total of 1252 postmenopausal women without CVD at baseline were analyzed in our investigation based on a 10-year follow-up prospective cohort study. Link of each abdominal obesity index with CVD were assessed by the Cox regression analysis and the Kaplan–Meier curve. The receiver operating characteristic (ROC) curves were drawn to compare the predictive ability for CVD.
Results
During the median follow-up of 120.53 months, 121 participants newly developed CVD. Compared to quartile 1 of LAP and CVAI, quartile 4 had increased risk to develop CVD after fully adjusted among postmenopausal women. When WC, VAI and CVAI considered as continuous variables, significant increased hazard ratios (HRs) for developing CVD were observed. The areas under the curve (AUC) of CVAI (0.632) was greatly higher than other indices (WC: 0.580, WHR: 0.538, LAP: 0.573, VAI: 0.540 respectively).
Conclusions
This study suggested that the abdominal obesity indices were associated with the risk of CVD excluded WHR and highlighted that CVAI might be the most valuable abdominal obesity indicator for identifying the high risk of CVD in Chinese postmenopausal women.
Supplementary Information
The online version contains supplementary material available at 10.1186/s12967-024-05665-y.
Keywords: Abdominal obesity indices, Cardiovascular disease, Chinese postmenopausal women, Chinese visceral adiposity index
Background
Cardiovascular disease (CVD) is the leading cause of morbidity and mortality in women worldwide, with a proportion of 35% of all death causes [1]. Since 1990, China showed a steady increase in the prevalence of CVD among women [2]. However, women cardiovascular health and cardiovascular risk were underemphasized during the past decade [3, 4]. As a result, it is essential to explore effective influencing factors for CVD in order to better predict cardiovascular disease and provide valuable strategies for women. Previous study evidenced that the fatality rate of CVD had increased largely among women at midlife (40–65 years), the same time as menopause [5]. Menopause, with the reduction and even disappearing of estrogen levels, is considered a turning point for women’s cardiometabolic change [5]. Women after menopause were found to have a notably higher probability to develop CVD, identifying that menopausal transition relates to increased cardiovascular risk [6] and preventive strategies required [7].
Former studies indicated that close relationship may exist between the menopause transition and the occurrence of obesity among women [8, 9]. Obesity has been considered as an important cardiovascular risk factor by accumulative evidence. Although body mass index (BMI) is frequently utilized to classify overweight or obesity, it cannot neither distinguish the lean mass and total fat mass nor capture the distribution of body fat [10]. Furthermore, menopause transition lead to an increased abdominal fat deposition compared to peripheral fat deposition [11, 12], and accumulative evidence demonstrated that adipose tissue distribution rather than overall adiposity is more critical in determining CVD risk [13].
Radiological imaging techniques can accurately assess abdominal adiposity, however, the expensive cost, time consuming and radiation hazards restrict its application in large-scale clinical investigation [14]. Thus, simple, effective, non-invasive, and easily accessible markers closely associated with abdominal fat required to be established. Electrocardiogram (ECG) and coronary angiography are important methods to diagnose coronary heart disease (CHD). Nevertheless, ECG and coronary angiography may be normal at baseline in healthy population. Screening high risk population for CVD is very useful for early intervention and treatment. Considering the low detection rate of ECG at baseline and the high cost and complex operation of coronary angiography, we aimed to discover a surrogate marker for predicting CVD. As is known to all, waist circumference (WC) is considered as a traditional abdominal fat index. Recently, several newly established indicators were found to have independently predictive values for CVD incidence in general population, including waist–hip ratio (WHR), lipid accumulation product (LAP), visceral adiposity index (VAI) and Chinese visceral adiposity index (CVAI) [15, 16]. However, there is still unclear about the longitudinal association of these indices with CVD risk in postmenopausal women. Thus, it is necessary to examine further which abdominal obesity index is the optimal predictor of CVD in postmenopausal women. The present study aimed to investigate the association between the abdominal fat indicators with CVD incidence and compared their risk prediction performances in a prospective cohort study.
Methods
Study population
The present study launched during the period from 2005 to 2006, enrolled participants aged 35–70 from 12 communities in Eastern China and conducted a 10-year follow-up. To obtain perfectly representative sample of the general Eastern China populations against area variations interference, participants were required to have resided in the specific community for a minimum of 5 years, selected by a random, multi-stage and cluster sampling.
From 2005 to 2006, a total of 2112 postmenopausal women participants were included in our research. After excluding participants with CVD history at baseline (n = 268), with missing data of the baseline information (n = 139), with abnormal menopausal age (< 45 years or > 55 years, n = 279), there were 1426 postmenopausal women participants available included in our investigation.
With the rapid economic development and unprecedented urbanization, the migration flow in China over the past two decades has rapidly increased [17]. After a median follow-up period of 120.53 months, 174 postmenopausal women were lost to follow-up with a shedding rate of 12.2%. Totally, 1252 participants eventually took part in the present analysis (Fig. 1).
Fig. 1.

Flow diagram of patient selection. CVD cardiovascular disease
The study was approved by the Ethics Review committee of the Shandong Academy of Medical Sciences (Approval Number: 202111120194) and conducted in conformity with the Declarations of Helsinki. Written informed consent were provided from all participants.
Baseline survey and definitions
Participants were asked to carry out the standardized questionnaire investigations on their baseline information face to face established by professional and well-trained staffs, contained with socio-demographic information (age, sex, menopausal information, number of children and education level), life styles (smoking status, alcohol drinking status, physical activity and energy intake percentage from fat and carbohydrate), individual histories of diseases (diabetic mellitus, hypertension and CVD) and taking medication (antihypertensive, antidiabetic and antilipemic drugs). The menopausal information involved the menarcheal age, the menstrual cycles, having gone through menopause or not and age at menopause. The number of children was categorized into 5 groups, including 0, 1, 2, 3, and ≥ 4. Education level was divided into three categories, inclusive of pre-secondary school, secondary school and post-secondary school. Smoking and alcohol drinking status were both defined as never, former or current. Physical activity was self-reported, based on the International Physical Activity Questionnaire (IPAQ) in 1998, the most widely used instrument applicable across countries for monitoring and assessing population physical activity level [18]. Low physical activity was defined as < 600 metabolic equivalent task (MET) × minutes per week or < 150 min per week of moderate intensive physical activity. Energy intake percentage from fat and carbohydrate were divided into three according to the tertiles. The diagnostic criteria for diabetic mellitus (DM) was fasting plasma glucose > 6.9 mmol/L, a self-reported history of DM or the utilization of antidiabetic drugs [19]. Similarly, hypertension was defined as systolic blood pressure (SBP) > 140 mmHg or diastolic blood pressure (DBP) > 90 mmHg, having been diagnosed with hypertension or the use of antihypertensive drugs [20].
Clinical laboratory results were obtained by experienced physicians collecting participants’ venous blood samples of the anterior elbow after an overnight fast for a minimum of 8 h and next testing. Professional experimental staffs in the laboratory were in charge of measuring the biochemical indexes using standardized autoanalyzers, including total cholesterol (TC), triglyceride (TG), fasting plasma glucose (FPG), high-density lipoprotein cholesterol (HDL-C) and low-density lipoprotein cholesterol (LDL-C).
The regularly calibrated sphygmomanometer was applied to estimate participants’ blood pressure by professional physicians complying with standard steps repeatedly and the mean of the three measurements was computed. In order to get an accurate blood pressure reading, participants should be required to empty their bladders, with no food or drink for at least 30 min and sit comfortably for a minimum of 5 min before measuring, put both feet flat on the ground and rest their arms on the table with the cuff at chest height against bare skin without talking during the measurement.
Anthropometric indices such as height, weight, waist circumference and hip circumference were measured twice by well-trained clinicians following standardized protocols and then the averages calculated were applied for further analysis. When measuring, the participants were required to stand straight without shoes, heels together, look straight ahead and take only minimal clothes. The waist circumference was measured at the level of the umbilicus around the abdomen using tapes. The WHR was calculated by dividing WC (cm) by hip circumference (cm). As for the values of other abdominal obesity indices, the formulas for estimation were shown by sex as follows according to previous published researches [21].
Males:
Females:
Follow-up for outcomes
After 10-year follow-up, we collected the information of outcomes, including CVD, CHD and stroke. CVD was defined as CHD (myocardial infarction, angina pectorals or angiography-proven CHD) or stroke (ischemic, hemorrhagic or unspecified stroke) according to the hospital record documents or the imaging evidence.
Statistical analysis
All reported p-values in the tables and figures were two-sided and p value < 0.05 was considered statistically significant. All statistical analyses and figures were completed with R software version 4.2.0 (R Foundation for Statistical Computing). Baseline characteristics of eligible study participants were displayed according to the presence of outcomes. Continuous variables distributed normally were summarized as means and standard deviations (SD) while non-normal distribution data were expressed as medians and interquartile ranges. As for categorical variables, frequencies and percentages were calculated. To compare the differences at baseline with and without CVD, the t-test and the Wilcoxon rank-sum test were applied for analyzing continuous data while the Pearson chi-square for categorical data. The five abdominal obesity indices at baseline were grouped by the quartiles, named quartile 1 (Q1), quartile 2 (Q2), quartile 3 (Q3) and quartile 4 (Q4). The cumulative rates of CVD of each abdominal obesity indices were compared among groups categorized by the quartiles using the Kaplan–Meier curves and the log-rank test. Hazard ratios (HRs) and 95% confidence intervals (CIs) of CVD were obtained using univariate and multivariate Cox regression to assess the associations between the incident CVD and the five abdominal obesity indices, with Q1 as reference. HRs (95% CIs) for per Unit and per SD increase of the five abdominal obesity indices were separately calculated. We performed the cox.zph() function with R software to confirm the proportional hazards assumption. The results show that there is no significant deviation from the proportional hazards assumption for all independent variates with all p-values > 0.05, and an associated global significant test gives a p value (> 0.05) which means good fit of the proportional hazard Cox regression models. To explore the independent predictive performance of five abdominal obesity indices, four Cox regression models based on the cardiovascular risk factors were established. Model 1 was only adjusted by age. Model 2 was adjusted by age, education, smoking, drinking and physical activity. Model 3 was adjusted by age, education, number of children, smoking, drinking, physical activity, TC, LDL-C, utilization of antihypertensive drugs, antidiabetic drugs and antilipemic drugs, energy intake percentage of fat and carbohydrates, and diagnosed with DM and hypertension at baseline. Considering that the present study focused on postmenopausal women, Model 4 was adjusted for variables in Model 3 plus age at menopause. Subgroup analyses stratified by age at menopause (< 48 years, 48–50 years or > 50 years), diagnosed with DM and hypertension at baseline (yes or no) were performed to evaluate the robustness of the results, with p for interaction calculated. Additionally, to compare the predictive performance of the five abdominal obesity indices for CVD, we drew the receiver operating characteristic (ROC) curve and calculated the area under ROC (AUC). P for comparison was used to confirm the differences of predictive performance statistically significantly. To further evaluate the improvement in discrimination and risk reclassification for CVD, with the addition of the five abdominal obesity indices, C-statistic, the net reclassification index (NRI) and the integrated discrimination improvement (IDI) were performed. Moreover, given that CVD was the composition of CHD and stroke in our study, sensitive analyses regarding the predictive value of the five indices for CHD and stroke, and the associations of CVAI with the incident CHD and stroke among postmenopausal women were also conducted by the AUC values, the ROC curves and the Cox regression analyses.
Results
Baseline characteristics
The subject characteristics of the participants divided by the presence of incident CVD are shown in Table 1. During the median follow-up of 120.53 months, 121 participants (9.66%) newly developed CVD. The mean age and mean age at menopause of the 1252 participants included were 57.79 years and 49.45 years respectively. Compared to participants without CVD, participants newly developing CVD during follow-up tend to be older, current smokers, with higher values of SBP, DBP and BMI, with utilization of antihypertensive drugs and antilipemic drugs and with hypertension at baseline (all p < 0.05). Statistically significant differences of the energy intake from carbohydrate were observed in the two groups stratified by the presence of CVD (p = 0.046). Additionally, participants with CVD seemed to be with increased levels of the four abdominal obesity indices, including WC, LAP and CVAI (all p < 0.05) (Table 1).
Table 1.
Baseline characteristics of the study population by the CVD status at follow-up
| Variables | Total (n = 1252) | Non-CVD (n = 1131) | Incident CVD (n = 121) | P-value |
|---|---|---|---|---|
| Age (years) | 57.79 ± 5.70 | 57.65 ± 5.68 | 59.10 ± 5.72 | 0.008 |
| Age at menopause (years) | 49.45 ± 2.35 | 49.42 ± 2.34 | 49.74 ± 2.38 | 0.157 |
| SBP (mmHg) | 144.78 ± 24.07 | 143.77 ± 23.71 | 154.31 ± 25.35 | < 0.001 |
| DBP (mmHg) | 85.45 ± 12.99 | 85.02 ± 13.00 | 89.51 ± 12.19 | < 0.001 |
| TC (mmol/L) | 5.05 ± 0.95 | 5.04 ± 0.96 | 5.14 ± 0.89 | 0.283 |
| TG (mmol/L) | 1.42 (1.06) | 1.39 (1.04) | 1.51 (1.12) | 0.100 |
| LDL-C (mmol/L) | 2.91 ± 0.80 | 2.89 ± 0.80 | 3.03 ± 0.76 | 0.081 |
| HDL-C (mmol/L) | 1.38 ± 0.32 | 1.38 ± 0.31 | 1.34 ± 0.35 | 0.180 |
| WC (cm) | 84.18 ± 9.41 | 83.93 ± 9.36 | 86.55 ± 9.62 | 0.003 |
| BMI (kg/m2) | 24.93 ± 3.59 | 24.78 ± 3.54 | 26.38 ± 3.76 | < 0.001 |
| WHR | 0.86 ± 0.05 | 0.86 ± 0.05 | 0.86 ± 0.05 | 0.497 |
| LAP | 36.11 (36.66) | 35.21 (35.57) | 44.10 (47.39) | 0.008 |
| VAI | 2.00 (1.68) | 1.97 (1.58) | 2.06 (2.10) | 0.148 |
| CVAI | 101.78 ± 30.84 | 100.43 ± 30.29 | 114.42 ± 33.17 | < 0.001 |
| Smoking, n (%) | ||||
| Former | 5 (0.4) | 5 (0.4) | 0 (0) | 0.048 |
| Current | 24 (1.9) | 18 (1.6) | 6 (5) | |
| Never | 1223 (97.7) | 1108 (98) | 115 (95) | |
| Drinking, n (%) | ||||
| Former | 8 (0.6) | 6 (0.5) | 2 (1.7) | 0.227 |
| Current | 16 (1.3) | 15 (1.3) | 1 (0.8) | |
| Never | 1228 (98.1) | 1110 (98.1) | 118 (97.5) | |
| Education, n (%) | ||||
| Secondary | 777 (62.1) | 713 (63) | 64 (52.9) | 0.058 |
| Pre-secondary | 430 (34.3) | 380 (33.6) | 50 (41.3) | |
| Post-secondary | 45 (3.6) | 38 (3.4) | 7 (5.8) | |
| Percent energy intake from fat, n (%) | ||||
| Tertile 1 | 418 (33.4) | 386 (34.1) | 32 (26.4) | 0.228 |
| Tertile 2 | 417 (33.3) | 371 (32.8) | 46 (38) | |
| Tertile 3 | 417 (33.3) | 374 (33.1) | 43 (35.5) | |
| Percent energy intake from carbohydrate, n (%) | ||||
| Tertile 1 | 418 (33.4) | 366 (32.4) | 52 (43.0) | 0.046 |
| Tertile 2 | 417 (33.3) | 379 (33.5) | 38 (31.4) | |
| Tertile 3 | 417 (33.3) | 386 (34.1) | 31 (25.6) | |
| Antihypertensive drugs, n (%) | 223 (17.8) | 184 (16.3) | 39 (32.2) | < 0.001 |
| Antidiabetic drugs, n (%) | 49 (3.9) | 42 (3.7) | 7 (5.8) | 0.318 |
| Antilipemic drugs, n (%) | 54 (4.3) | 40 (3.5) | 14 (11.6) | < 0.001 |
| Low physical activity, n (%) | 183 (14.6) | 170 (15) | 13 (10.7) | 0.225 |
| Number of children, n (%) | ||||
| 0 | 5 (0.4) | 4 (0.4) | 1 (0.8) | 0.297 |
| 1 | 322 (25.7) | 299 (26.4) | 23 (19) | |
| 2 | 537 (42.9) | 479 (42.4) | 58 (47.9) | |
| 3 | 248 (19.8) | 222 (19.6) | 26 (21.5) | |
| ≥ 4 | 140 (11.2) | 127 (11.2) | 13 (10.7) | |
| Hypertension, n (%) | 750 (59.9) | 657 (58.1) | 93 (76.9) | < 0.001 |
| Diabetic mellitus, n (%) | 117 (9.3) | 103 (9.1) | 14 (11.6) | 0.410 |
Continuous variables distributed normally were summarized as mean ± SD while non-normal distribution data were expressed as medians and interquartile ranges. Categorical variables were given by frequency and percentage as n(%)
p values in bold are < 0.05
CVD cardiovascular disease, SBP systolic blood pressure, DBP diastolic blood pressure, TC total cholesterol, TG triglyceride, LDL-C low-density lipoprotein-cholesterol, HDL-C high-density lipoprotein-cholesterol, WC waist circumference, BMI body mass index, WHR waist–hip ratio, LAP lipid accumulation product, VAI visceral adiposity index, CVAI Chinese visceral adiposity index, SD standard deviation
Correlations between abdominal obesity indices and CVD incidence among postmenopausal women
The correlations between abdominal obesity indices and CVD incidence were shown in Additional file 1: Table S1 and Table 2 using the Cox regression analyses. Compared to lowest group of LAP and CVAI at baseline, the fully adjusted HRs (95% CIs) for CVD in the highest quartile group were 1.747 (1.013, 3.012) and 1.893 (1.078, 3.323) respectively. In addition, the corresponding HRs (95% CIs) for per SD increase in WC, VAI and CVAI were 1.210 (1.002, 1.460), 1.143 (1.029, 1.269) and 1.407 (1.147, 1.726) respectively. Similarly, significant associations of CVD with WC, VAI and CVAI when estimated as continuous variables. However, no significant correlation between WHR and CVD was found when WHR was estimated as a continuous or a categorical variable (Additional file 1: Table S1 and Table 2).
Table 2.
Correlations of baseline abdominal obesity indices with incident CVD among postmenopausal women after fully adjusted using Model 4
| HR (95% CI) | Indices | ||||
|---|---|---|---|---|---|
| WC | WHR | LAP | VAI | CVAI | |
| Per unit increase | 1.020 (1.000, 1.041)* | 1.009 (0.033, 31.233) | 1.002 (0.999, 1.005) | 1.053 (1.011, 1.096)* | 1.011 (1.004, 1.018)** |
| Per SD increase | 1.210 (1.002, 1.460)* | 1.000 (0.831, 1.204) | 1.097 (0.947, 1.270) | 1.143 (1.029, 1.269)* | 1.407 (1.147, 1.726)** |
| Quartiles | |||||
| Q1 | 1.00 | 1.00 | 1.00 | 1.00 | 1.00 |
| Q2 | 1.072 (0.596, 1.929) | 0.678 (0.383, 1.201) | 0.804 (0.448, 1.442) | 0.760 (0.443, 1.304) | 0.663 (0.353, 1.244) |
| Q3 | 1.350 (0.771, 2.361) | 0.993 (0.595, 1.656) | 1.053 (0.603, 1.838) | 0.821 (0.478, 1.412) | 0.881 (0.484, 1.605) |
| Q4 | 1.673 (0.973, 2.877) | 1.182 (0.718, 1.944) | 1.747 (1.013, 3.012)* | 1.317 (0.787, 2.203) | 1.893 (1.078, 3.323)* |
Model 4: adjusted by age, education, number of children, smoking, drinking, physical activity, TC, LDL-C, utilization of antihypertensive drugs, antidiabetic drugs and antilipemic drugs, energy intake percentage of fat and carbohydrates, diagnosed with DM and hypertension at baseline and age at menopause
CVD cardiovascular disease, HR hazard ratio, CI confidence interval, WC waist circumference, WHR waist–hip ratio, LAP lipid accumulation product, VAI visceral adiposity index, CVAI Chinese visceral adiposity index, SD standard deviation, TC total cholesterol, LDL-C low-density lipoprotein-cholesterol, DM diabetic mellitus
*p < 0.05
**p < 0.01
As shown in Fig. 2, the Kaplan–Meier curves and the log-rank test during the follow-up time further confirmed the significantly elevated risk of incident CVD in the highest group of WC, LAP and CVAI among postmenopausal women (Fig. 2).
Fig. 2.

Kaplan–Meier curves of CVD by abdominal obesity indices quartiles. The cumulative incidence of CVD during follow-up grouped by the abdominal obesity indices quartiles was described using Kaplan–Meier curves, with p value calculated using the log-rank test. The abdominal obesity indices are contained with WC (A), WHR (B), LAP (C), VAI (D) and CVAI (E). CVD cardiovascular disease, WC waist circumference, WHR waist–hip ratio, LAP lipid accumulation product, VAI visceral adiposity index, CVAI Chinese visceral adiposity index
Subgroup analyses
Subgroup analyses stratified by age at menopause, hypertension and DM in Model 4 are demonstrated in Fig. 3. However, we did not find statistically significant differences in the association between the five indices and CVD incidence across the subgroups according to the interaction tests. (all P > 0.05) (Fig. 3).
Fig. 3.

Correlations of baseline abdominal obesity indices with incident CVD among postmenopausal women in prespecified subgroups. HR are adjusted for age, education, number of children, smoking, drinking, physical activity, TC, LDL-C, utilization of antihypertensive drugs, antidiabetic drugs and antilipemic drugs, energy intake percentage of fat and carbohydrates, and diagnosed with DM, hypertension and age at menopause at baseline. CVD cardiovascular disease, HR hazard ratio, CI confidence interval, WC waist circumference, WHR waist–hip ratio, LAP lipid accumulation product, VAI visceral adiposity index, CVAI Chinese visceral adiposity index, TC total cholesterol, LDL-C low-density lipoprotein-cholesterol, DM diabetic mellitus
Assessment of the predictive performance of abdominal obesity indices for incident CVD
The ROC curves and the AUC values exhibiting the predictive ability of abdominal obesity indices for incident CVD were shown in Fig. 4 and Table 3. CVAI showed superior performance to other four abdominal obesity indices for predicting the CVD incidence. Moreover, with the P for comparison calculated to explore the differences of the AUCs between CVAI and other indices significant or not, CVAI showed the largest AUC estimated significantly different from other AUCs (all p < 0.01). The AUCs (95% CIs) of WC, WHR, LAP, VAI and CVAI were 0.580 (0.526, 0.634), 0.538 (0.481, 0.595), 0.573 (0.519, 0.627), 0.540 (0.484, 0.596) and 0.632 (0.576, 0.688) respectively (Fig. 4 and Table 3).
Fig. 4.
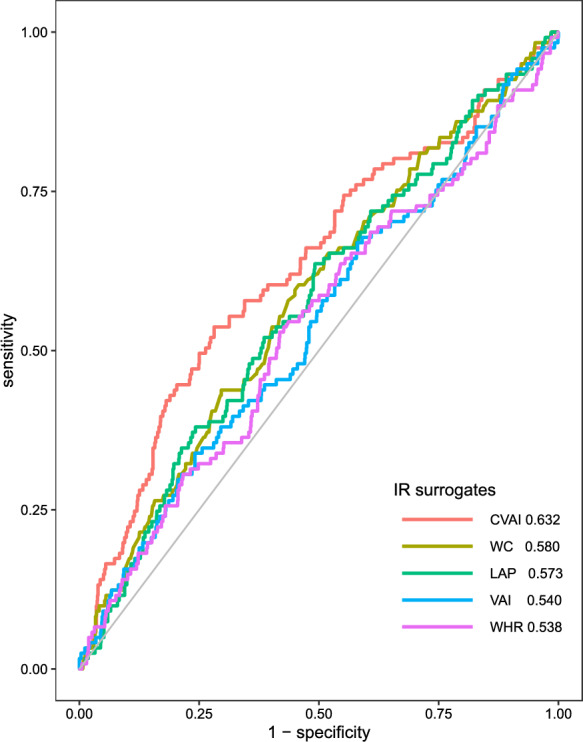
Receiver operating characteristic curves of CVD by abdominal obesity indices. The predictive performance of abdominal obesity indices for incident CVD was shown based on the receiver operating characteristic curves. The AUCs are as follows: CVAI: 0.632; WC: 0.580; LAP: 0.573; VAI: 0.540; WHR: 0.538. CVD cardiovascular disease, AUC area under the curve, CVAI Chinese visceral adiposity index, WC waist circumference, LAP lipid accumulation product, VAI visceral adiposity index, WHR waist–hip ratio
Table 3.
The predictive performance of abdominal obesity indices for incident CVD among postmenopausal women
| Indices | C-statistic (95% CI) | P-value | P for comparison |
|---|---|---|---|
| CVAI | 0.632 (0.576, 0.688) | < 0.001 | Ref. |
| LAP | 0.573 (0.519, 0.627) | 0.008 | < 0.001 |
| WC | 0.580 (0.526, 0.634) | 0.004 | 0.003 |
| WHR | 0.538 (0481, 0.595) | 0.148 | < 0.001 |
| VAI | 0.540 (0.484, 0.596) | 0.168 | < 0.001 |
p values in bold are < 0.05
CVD cardiovascular disease, CI confidence interval, CVAI Chinese visceral adiposity index, Ref. reference, LAP lipid accumulation product, WC waist circumference, WHR waist–hip ratio, VAI visceral adiposity index
Additional predictive value of abdominal obesity indices in the risk assessment of CVD among postmenopausal women
The additional predictive performance of abdominal obesity indices for CVD among postmenopausal women after adding these indices to the basic risk model 4 established by traditional cardiovascular risk are shown in Table 4. CVAI demonstrated significantly enhanced incremental predictive ability according to the estimation of C-statistics, IDI and NRI and corresponding P values. When CVAI added to the basic model including age, age at menopause, education, number of children, smoking, drinking, physical activity, TC, LDL-C, utilization of antihypertensive drugs, antidiabetic drugs and antilipemic drugs, percentage intake of fat and carbohydrates, and diagnosed with DM and hypertension at baseline, the C-statistics, IDI, continuous NRI and 95% CIs were 0.690 (0.641, 0.739), 0.0125 (0.005, 0.0201) and 0.3277 (0.1426, 0.5128) respectively (all p ≤ 0.001). However, no statistically significant additional predictive values of WHR, LAP and VAI were observed (Table 4).
Table 4.
The incremental predictive value of the abdominal obesity indices for CVD
| Model | C-statistic D-(95% CI) |
P-value | IDI (95% CI) | P-value | NRI (95% CI) | P-value |
|---|---|---|---|---|---|---|
| Basic model | 0.676 (0.630, 0.723) | Ref. | Ref. | Ref. | ||
| + WC | 0.679 (0.631, 0.727) | 0.043 | 0.0043 (2e−04, 0.0084) | 0.041 | 0.1353 (− 0.052, 0.3226) | 0.157 |
| + WHR | 0.676 (0.629, 0.722) | 0.810 | 2e−04 (− 3e−04, 6e−04) | 0.482 | 0.0409 (− 0.1464, 0.2282) | 0.669 |
| + LAP | 0.679 (0.632, 0.725) | 0.208 | 0.0017 (− 7e−04, 0.0041) | 0.168 | 0.0595 (− 0.1236, 0.2427) | 0.524 |
| + VAI | 0.681 (0.635, 0.728) | 0.010 | 0.0118 (− 0.0028, 0.0264) | 0.112 | 0.1155 (− 0.0666, 0.2976) | 0.214 |
| + CVAI | 0.690 (0.641, 0.739) | < 0.001 | 0.0125 (0.005, 0.0201) | 0.001 | 0.3277 (0.1426, 0.5128) | < 0.001 |
p values in bold are < 0.05
CVD cardiovascular disease, CI confidence interval, IDI integrated discrimination improvement, NRI net reclassification improvement, Ref. reference, WC waist circumference, WHR waist–hip ratio, LAP lipid accumulation product, VAI visceral adiposity index, CVAI Chinese visceral adiposity index
Sensitivity analyses for CVAI
As displayed in Additional file 1: Table S2, positive predictive performance of WC, LAP, CVAI for incident CHD were observed among postmenopausal women, among which CVAI had the largest AUC being 0.632 (0.567, 0.698). Moreover, significant differences existed in the comparison between CVAI and LAP. As for predicting the incident stroke, only CVAI showed significant predictive ability with the AUC being 0.613 (0.527, 0.700) (Additional file 1: Table S2).
Additional file 1: Table S3 and Figure S1 confirmed the positive correlations of CVAI with incident CHD but no significant associations with incident stroke, using the Cox regression analyses and the Kaplan–Meier curves. After adjusted in Model 4, the HRs (95% CIs) for the Q4 group of CHD and stroke were 1.985 (1.018, 3.872) and 2.451 (0.894, 6.717) respectively (Additional file 1: Table S3 and Figure S1).
Discussion
In this prospective cohort study of postmenopausal women conducted in China, we observed and compared the predictive power of five abdominal obesity indices for the CVD incidence. Positive association were found between these indices and the risk of future CVD among postmenopausal women excluding WHR. Furthermore, CVAI exhibited the greatest power in predicting CVD incidence comparing with WC, WHR, VAI and LAP. Additionally, when adding the five abdominal obesity indices to the conventional risk model, CVAI exhibited significant additional predictive ability for the incident CVD.
The continuing rise in obesity prevalence to date has posed a major public health challenge globally. According to the Global Burden of Disease Study, the prevalence of obesity has doubled in more than 70 countries [22]. Obesity associated with the risk of numerous chronic diseases, such as diabetic mellitus, cancers and cardiovascular disease and lower life expectancy [23]. However, BMI is imperfect in the evaluation of abdominal body fat accumulation, which can neither distinguish body fat distribution with overall adiposity, nor distinguish fat mass with lean muscle mass [10, 24]. Investigations demonstrated that taking body fat distribution into consideration when measuring may improve the predictive ability of diseases [25]. Abdominal obesity was evidenced to have higher risk to develop CVD than overall obesity [26, 27]. In comparison with subcutaneous adipose tissue, visceral adiposity tissue is evidenced to be metabolically more active and secrete cytokines, adipokines and hormones at a higher speed that biologically associated with chronic diseases by the insulin/insulin-like growth factor (IGF) axis and chronic low-grade inflammation [28]. However, WC, a traditional index related to abdominal obesity, is hard to tell visceral obesity from subcutaneous obesity. Hence, besides WC, we introduced other four indices, WHR, CVAI, VAI, LAP to compare the predictive values for CVD in the present study. Postmenopausal women predispose to obesity and a closer relationship between CVD and postmenopausal women than general populations were found [6], due to the remarkable decrease of estrogen [29]. Previous researches have compared the five abdominal obesity indices and confirmed their close association with the development of CVD only in general populations or diabetic populations [15, 21]. As a result, our study was the first to focus on the five abdominal obesity indices in postmenopausal women and to fill in the gap.
The present study underscored that CVAI showed not only the most outstanding predictive performance for the development of CVD, but also the greatest incremental risk stratification when added to the conventional risk model among women after menopause. Considerable studies have emphasized the important effect of obesity on the cardiovascular risk and CVD. However, focusing on BMI or WC alone is a crude oversimplification of obesity. Additionally, postmenopausal women are prone to the accumulation of visceral adiposity for changes of physiology and life styles. Previous evidence found that higher abdominal fat was related to increased health risk irrespective of the value of BMI [30]. Abdominal fat is a composition of subcutaneous and visceral adipose tissue, among which visceral adiposity tissue showed closer relationship with the incident CVD and had more deleterious effect on cardiometabolic outcomes [31]. Furthermore, excess visceral adiposity tissue (VAT), defined as the amount of adiposity tissue located in the abdominal cavity, was found to increase the cardiometabolic risk and cardiovascular outcomes at any BMI level [30]. High level of plasma triglyceride were regarded as an effective and simple marker for evaluating excess visceral adiposity with a large waistline existing [32, 33]. CVAI incorporates anthropometric indices and lipid profiles including triglyceride and HDL, which is closely associated with visceral adiposity surpassing other traditional anthropometric indices in Chinese population [34]. Additionally, CVAI is the only index that takes age into account compared to other indexes in our study. A large number of previous studies have shown that age is an independent risk factor that promotes the occurrence and development of cardiovascular diseases. Previous study found that senescent cells secreted cytokines, chemokines, growth factors, and reactive oxygen species, so-called senescence-associated secretory phenotype (SASP), leading to the development and progression of cardiovascular diseases [35], which of course may not correspond to biological age, but should be considered in future study. In the previous studies with regard to the comparison of obesity indicators, CVAI showed the largest predictive value not only for cardiovascular risk factors such as DM [34], hypertension [36] and carotid plaque [37] but also for the development of CVD [15], CHD [38] and stroke [39]. Previous studies have focused on CVAI and different cardiovascular events among different populations. For example, CVAI is considered effective for risk stratification of stroke in middle-aged and elderly participants from the China Health and Retirement Longitudinal Study (CHARLS) [40]. Previous cohort studies also evidenced the association of CVAI with CHD and Risk of Carotid Plaque in large Chinese populations [37, 38]. Women who have occurred menopause were faced with increasing risk to develop cardiovascular disease, which made it meaningful to explore the effect of CVAI on cardiovascular disease among postmenopausal women. To our best knowledge, our current study is the first to focus on the association between CVAI and CVD risk among postmenopausal women. Similar with our findings, a study in Southwest China confirmed that CVAI was the strongest predictive indicator for the incident CVD among female subjects compared to other visceral adiposity indices [15]. As a result, the present findings proposed that CVAI could be adopted as a simple and easily available clinical accessing tool to identify postmenopausal women at high risk of CVD development. However, what should be pointed out is that the AUC of CVAI in our analysis was less than 0.70. Considering the complex pathogenesis of cardiovascular disease, it is difficult to discover a single index for risk prediction. In addition, abdominal obesity can only partially explain the onset of cardiovascular disease.
In the present study, no significant correlation between WHR and CVD was found when WHR was estimated as a continuous or a categorical variable. Similar to our results, WHR was found to have no significant association with CVD incidence in women population with DM or without after fully adjusted [41, 42]. One probable explanation could be postmenopausal women tend to have not only higher value of WHR [43], but also other increased cardiovascular risk, such as increased total cholesterol and LDL cholesterol [44], which in case may reflect weak or even no relationship between WHR and CVD incidence.
The subgroup analyses found the significant association between CVAI and the occurrence of CVD among postmenopausal women with age at menopause > 50 years, with the history of hypertension, with or without the history of DM. Post menopausal women tend to accumulate visceral fat. Moreover, cardiovascular risk remarkably increases in women with menopause occurring before age 50, compared with those after 50 [45, 46], which may obscure the effect of CVAI, leading to a higher link between CVAI and CVD among women with menopausal age > 50 years.
Although another study from Rural Chinese Cohort Study data found the excellent predictive ability for stroke of CVAI in general population [39], the sensitive analysis evidenced the association of CVAI with CHD but no significant relationship with stroke. More investigations focusing on postmenopausal women and the risk of stroke development were needed in the future.
However, several limitations should be mentioned in the study. Firstly, because the survey focused on the community population, we did not test the actual value of visceral adiposity by computed tomography (CT), dual-energy x-ray absorptiometry (DXA) or magnetic resonance imaging (MRI), and fat mass index (FMI), VAT were not available. Secondly, our study was conducted in Eastern China, and our findings might not be appropriate for other regions due to the differences of lifestyles and residential environment. Thirdly, despite adjusting for potential risk factors in multivariate analyses, some potential unknown confounding variables were not considered in our present investigation, such as the changes in estrogen and the number of pregnancies. Fourthly, the indices such as exercise, lifestyle and anthropometric indices are dynamic and changing, and we do not take into account the changes of these indices over the follow-up period. As a result, further multicenter, large-size, prospective studies focusing on imaging indicators and dynamic changes of covariables may strengthen our conclusion.
Conclusion
In summary, our results implied that the four abdominal obesity indicators (WC, LAP, VAI and CVAI) were associated with the increased risk for developing CVD among postmenopausal women. Especially, CVAI exhibited the best performance for predicting incident CVD. Our results suggested that CVAI might be a valuable abdominal obesity indicator for identifying the high risk of CVD incidence in postmenopausal women.
Supplementary Information
Additional file 1: Table S1. Correlations of baseline abdominal obesity indices with incident CVD among postmenopausal women after adjusted using Model 1, 2 and 3. Table S2. The predictive performance of abdominal obesity indices for incident CHD and stroke among postmenopausal women. Table S3. Correlations of baseline CVAI with incident CHD and stroke among postmenopausal women. Figure S1. Kaplan–Meier curves of CHD and stroke by CVAI quartiles.
Acknowledgements
Not applicable.
Abbreviations
- WC
Waist circumference
- WHR
Waist–hip ratio
- VAI
Visceral adiposity index
- LAP
Lipid accumulation product
- CVAI
Chinese visceral adiposity index
- CVD
Cardiovascular disease
- ROC
Receiver operating characteristic
- HR
Hazard ratio
- AUC
Area under the curve
- BMI
Body mass index
- ECG
Electrocardiogram
- CHD
Coronary heart disease
- IPAQ
International Physical Activity Questionnaire
- MET
Metabolic equivalent task
- DM
Diabetic mellitus
- SBP
Systolic blood pressure
- DBP
Diastolic blood pressure
- TC
Total cholesterol
- TG
Triglyceride
- FPG
Fasting plasma glucose
- HDL-C
High-density lipoprotein cholesterol
- LDL-C
Low-density lipoprotein cholesterol
- SD
Standard deviations
- CI
Confidence interval
- NRI
Net reclassification index
- IDI
Integrated discrimination improvement
- IGF
Insulin-like growth factor
- VAT
Visceral adiposity tissue
- SASP
Senescence-associated secretory phenotype
- CT
Computed tomography
- DXA
Dual-energy x-ray absorptiometry
- MRI
Magnetic resonance imaging
Author contributions
LL, JP, DZ, TZ and JY drafted, revised the manuscript and contributed to the conception and design of this article. LL, JP and DZ were responsible for the statistical analysis. JY, YZ, ZW and FL contributed to the case collection and database establishment. LL, JP, DZ, CS, SC, DG, TZ and JY interpreted the results. All authors approved the final manuscript.
Funding
This work was supported by the National Key Research and Development Program of China (No. 2021YFF0501403) and the Key Research and Development Plan of Shandong Province (No. 2021SFGC0503).
Availability of data and materials
The datasets used and/or analyzed during the current study are available from the corresponding author on reasonable request.
Declarations
Ethics approval and consent to participate
The study was approved by the Ethics Review committee of the Shandong Academy of Medical Sciences (Approval Number: 202111120194) and complied with the Declaration of Helsinki. All participants provided written informed consent.
Consent for publication
Not applicable.
Competing interests
The authors declare that they have no competing interests.
Footnotes
Publisher's Note
Springer Nature remains neutral with regard to jurisdictional claims in published maps and institutional affiliations.
Li Liu, Jie Peng and Dejin Zang contributed equally to this work.
Contributor Information
Tengfei Zheng, Email: ztf2009@126.com.
Jianmin Yang, Email: yangjianminsdu@163.com.
References
- 1.Virani SS, Alonso A, Benjamin EJ, Bittencourt MS, Callaway CW, Carson AP, et al. Heart disease and stroke statistics-2020 update: a report from the American heart association. Circulation. 2020;141(9):e139–596. [DOI] [PubMed] [Google Scholar]
- 2.Vogel B, Acevedo M, Appelman Y, Bairey Merz CN, Chieffo A, Figtree GA, et al. The Lancet women and cardiovascular disease Commission: reducing the global burden by 2030. Lancet. 2021;397(10292):2385–438. [DOI] [PubMed] [Google Scholar]
- 3.Bairey Merz CN, Andersen H, Sprague E, Burns A, Keida M, Walsh MN, et al. Knowledge, attitudes, and beliefs regarding cardiovascular disease in women: the women’s heart alliance. J Am Coll Cardiol. 2017;70(2):123–32. [DOI] [PubMed] [Google Scholar]
- 4.Cushman M, Shay CM, Howard VJ, Jiménez MC, Lewey J, McSweeney JC, et al. Ten-year differences in women’s awareness related to coronary heart disease: results of the 2019 American heart association national survey: a special report from the American heart association. Circulation. 2021;143(7):e239–48. [DOI] [PMC free article] [PubMed] [Google Scholar]
- 5.Nappi RE, Chedraui P, Lambrinoudaki I, Simoncini T. Menopause: a cardiometabolic transition. Lancet Diabetes Endocrinol. 2022;10(6):442–56. [DOI] [PubMed] [Google Scholar]
- 6.El Khoudary SR, Aggarwal B, Beckie TM, Hodis HN, Johnson AE, Langer RD, et al. Menopause transition and cardiovascular disease risk: implications for timing of early prevention: a scientific statement from the American heart association. Circulation. 2020;142(25):e506–32. [DOI] [PubMed] [Google Scholar]
- 7.Colpani V, Baena CP, Jaspers L, van Dijk GM, Farajzadegan Z, Dhana K, et al. Lifestyle factors, cardiovascular disease and all-cause mortality in middle-aged and elderly women: a systematic review and meta-analysis. Eur J Epidemiol. 2018;33(9):831–45. [DOI] [PubMed] [Google Scholar]
- 8.Mauvais-Jarvis F, Clegg DJ, Hevener AL. The role of estrogens in control of energy balance and glucose homeostasis. Endocr Rev. 2013;34(3):309–38. [DOI] [PMC free article] [PubMed] [Google Scholar]
- 9.Kohrt WM, Wierman ME. Preventing fat gain by blocking follicle-stimulating hormone. N Engl J Med. 2017;377(3):293–5. [DOI] [PubMed] [Google Scholar]
- 10.Chandramouli C, Tay WT, Bamadhaj NS, Tromp J, Teng TK, Yap J, et al. Association of obesity with heart failure outcomes in 11 Asian regions: a cohort study. PLoS Med. 2019;16(9): e1002916. [DOI] [PMC free article] [PubMed] [Google Scholar]
- 11.Kanaley JA, Sames C, Swisher L, Swick AG, Ploutz-Snyder LL, Steppan CM, et al. Abdominal fat distribution in pre- and postmenopausal women: the impact of physical activity, age, and menopausal status. Metabolism. 2001;50(8):976–82. [DOI] [PubMed] [Google Scholar]
- 12.Toth MJ, Tchernof A, Sites CK, Poehlman ET. Menopause-related changes in body fat distribution. Ann N Y Acad Sci. 2000;904:502–6. [DOI] [PubMed] [Google Scholar]
- 13.Koenen M, Hill MA, Cohen P, Sowers JR. Obesity, adipose tissue and vascular dysfunction. Circ Res. 2021;128(7):951–68. [DOI] [PMC free article] [PubMed] [Google Scholar]
- 14.Brahimaj A, Rivadeneira F, Muka T, Sijbrands E, Franco OH, Dehghan A, et al. Novel metabolic indices and incident type 2 diabetes among women and men: the Rotterdam study. Diabetologia. 2019;62(9):1581–90. [DOI] [PMC free article] [PubMed] [Google Scholar]
- 15.Wang Y, Zhao X, Chen Y, Yao Y, Zhang Y, Wang N, et al. Visceral adiposity measures are strongly associated with cardiovascular disease among female participants in Southwest China: a population-based prospective study. Front Endocrinol. 2022;13: 969753. [DOI] [PMC free article] [PubMed] [Google Scholar]
- 16.Huang YC, Huang JC, Lin CI, Chien HH, Lin YY, Wang CL, et al. Comparison of innovative and traditional cardiometabolic indices in estimating atherosclerotic cardiovascular disease risk in adults. Diagnostics. 2021;11(4):603. [DOI] [PMC free article] [PubMed] [Google Scholar]
- 17.He WC, Ju K, Gao YM, Zhang P, Zhang YX, Jiang Y, et al. Spatial inequality, characteristics of internal migration, and pulmonary tuberculosis in China, 2011–2017: a spatial analysis. Infect Dis Poverty. 2020;9(1):159. [DOI] [PMC free article] [PubMed] [Google Scholar]
- 18.Craig CL, Marshall AL, Sjöström M, Bauman AE, Booth ML, Ainsworth BE, et al. International physical activity questionnaire: 12-country reliability and validity. Med Sci Sports Exerc. 2003;35(8):1381–95. [DOI] [PubMed] [Google Scholar]
- 19.2. Classification and diagnosis of diabetes: standards of medical care in diabetes-2022. Diabetes Care. 2022;45(Suppl 1):S17–38. [DOI] [PubMed]
- 20.Chobanian AV, Bakris GL, Black HR, Cushman WC, Green LA, Izzo JL Jr, et al. Seventh report of the joint national committee on prevention, detection, evaluation, and treatment of high blood pressure. Hypertension. 2003;42(6):1206–52. [DOI] [PubMed] [Google Scholar]
- 21.Qiao T, Luo T, Pei H, Yimingniyazi B, Aili D, Aimudula A, et al. Association between abdominal obesity indices and risk of cardiovascular events in Chinese populations with type 2 diabetes: a prospective cohort study. Cardiovasc Diabetol. 2022;21(1):225. [DOI] [PMC free article] [PubMed] [Google Scholar]
- 22.Afshin A, Forouzanfar MH, Reitsma MB, Sur P, Estep K, Lee A, et al. Health effects of overweight and obesity in 195 countries over 25 years. N Engl J Med. 2017;377(1):13–27. [DOI] [PMC free article] [PubMed] [Google Scholar]
- 23.Whitlock G, Lewington S, Sherliker P, Clarke R, Emberson J, Halsey J, et al. Body-mass index and cause-specific mortality in 900 000 adults: collaborative analyses of 57 prospective studies. Lancet. 2009;373(9669):1083–96. [DOI] [PMC free article] [PubMed] [Google Scholar]
- 24.Silveira EA, Kliemann N, Noll M, Sarrafzadegan N, de Oliveira C. Visceral obesity and incident cancer and cardiovascular disease: an integrative review of the epidemiological evidence. Obes Rev. 2021;22(1): e13088. [DOI] [PMC free article] [PubMed] [Google Scholar]
- 25.Pischon T. Use of obesity biomarkers in cardiovascular epidemiology. Dis Mark. 2009;26(5–6):247–63. [DOI] [PMC free article] [PubMed] [Google Scholar]
- 26.Cornier MA, Després JP, Davis N, Grossniklaus DA, Klein S, Lamarche B, et al. Assessing adiposity: a scientific statement from the American heart association. Circulation. 2011;124(18):1996–2019. [DOI] [PubMed] [Google Scholar]
- 27.Yusuf S, Hawken S, Ounpuu S, Bautista L, Franzosi MG, Commerford P, et al. Obesity and the risk of myocardial infarction in 27,000 participants from 52 countries: a case–control study. Lancet. 2005;366(9497):1640–9. [DOI] [PubMed] [Google Scholar]
- 28.Galic S, Oakhill JS, Steinberg GR. Adipose tissue as an endocrine organ. Mol Cell Endocrinol. 2010;316(2):129–39. [DOI] [PubMed] [Google Scholar]
- 29.Ko SH, Jung Y. Energy metabolism changes and dysregulated lipid metabolism in postmenopausal women. Nutrients. 2021;13(12):4556. [DOI] [PMC free article] [PubMed] [Google Scholar]
- 30.Piché ME, Tchernof A, Després JP. Obesity phenotypes, diabetes, and cardiovascular diseases. Circ Res. 2020;126(11):1477–500. [DOI] [PubMed] [Google Scholar]
- 31.Powell-Wiley TM, Poirier P, Burke LE, Després JP, Gordon-Larsen P, Lavie CJ, et al. Obesity and cardiovascular disease: a scientific statement from the American heart association. Circulation. 2021;143(21):e984–1010. [DOI] [PMC free article] [PubMed] [Google Scholar]
- 32.Arsenault BJ, Lemieux I, Després JP, Wareham NJ, Kastelein JJ, Khaw KT, et al. The hypertriglyceridemic-waist phenotype and the risk of coronary artery disease: results from the EPIC-Norfolk prospective population study. CMAJ. 2010;182(13):1427–32. [DOI] [PMC free article] [PubMed] [Google Scholar]
- 33.Lemieux I, Pascot A, Couillard C, Lamarche B, Tchernof A, Alméras N, et al. Hypertriglyceridemic waist: a marker of the atherogenic metabolic triad (hyperinsulinemia; hyperapolipoprotein B; small, dense LDL) in men. Circulation. 2000;102(2):179–84. [DOI] [PubMed] [Google Scholar]
- 34.Wu J, Gong L, Li Q, Hu J, Zhang S, Wang Y, et al. A novel visceral adiposity index for prediction of type 2 diabetes and pre-diabetes in Chinese adults: a 5-year prospective study. Sci Rep. 2017;7(1):13784. [DOI] [PMC free article] [PubMed] [Google Scholar]
- 35.Mahoney SA, Dey AK, Basisty N, Herman AB. Identification and functional analysis of senescent cells in the cardiovascular system using omics approaches. Am J Physiol Heart Circ Physiol. 2023;325(5):H1039–58. [DOI] [PMC free article] [PubMed] [Google Scholar]
- 36.Han M, Qie R, Li Q, Liu L, Huang S, Wu X, et al. Chinese visceral adiposity index, a novel indicator of visceral obesity for assessing the risk of incident hypertension in a prospective cohort study. Br J Nutr. 2021;126(4):612–20. [DOI] [PubMed] [Google Scholar]
- 37.Bi H, Zhang Y, Qin P, Wang C, Peng X, Chen H, et al. Association of Chinese visceral adiposity index and its dynamic change with risk of carotid plaque in a large cohort in China. J Am Heart Assoc. 2022;11(1): e022633. [DOI] [PMC free article] [PubMed] [Google Scholar]
- 38.Xie Y, Zhang Y, Qin P, Ping Z, Wang C, Peng X, et al. The association between Chinese visceral adipose index and coronary heart disease: a cohort study in China. Nutr Metab Cardiovasc Dis. 2022;32(3):550–9. [DOI] [PubMed] [Google Scholar]
- 39.Zhao Y, Zhang J, Chen C, Qin P, Zhang M, Shi X, et al. Comparison of six surrogate insulin resistance indexes for predicting the risk of incident stroke: the rural Chinese cohort study. Diabetes Metab Res Rev. 2022;38(7): e3567. [DOI] [PubMed] [Google Scholar]
- 40.Zhang Z, Zhao L, Lu Y, Meng X, Zhou X. Association between Chinese visceral adiposity index and risk of stroke incidence in middle-aged and elderly Chinese population: evidence from a large national cohort study. J Transl Med. 2023;21(1):518. [DOI] [PMC free article] [PubMed] [Google Scholar]
- 41.Shen W, Cai L, Wang B, Wang Y, Wang N, Lu Y. Associations of relative fat mass, a novel adiposity indicator, with non-alcoholic fatty liver disease and cardiovascular disease: data from SPECT-China. Diabetes Metab Syndr Obes. 2023;16:2377–87. [DOI] [PMC free article] [PubMed] [Google Scholar]
- 42.Wan H, Wang Y, Xiang Q, Fang S, Chen Y, Chen C, et al. Associations between abdominal obesity indices and diabetic complications: Chinese visceral adiposity index and neck circumference. Cardiovasc Diabetol. 2020;19(1):118. [DOI] [PMC free article] [PubMed] [Google Scholar]
- 43.Dosi R, Bhatt N, Shah P, Patell R. Cardiovascular disease and menopause. J Clin Diagn Res. 2014;8(2):62–4. [DOI] [PMC free article] [PubMed] [Google Scholar]
- 44.Trémollières FA, Pouilles JM, Cauneille C, Ribot C. Coronary heart disease risk factors and menopause: a study in 1684 French women. Atherosclerosis. 1999;142(2):415–23. [DOI] [PubMed] [Google Scholar]
- 45.Ramirez MF, Honigberg M, Wang D, Parekh JK, Bielawski K, Courchesne P, et al. Protein biomarkers of early menopause and incident cardiovascular disease. J Am Heart Assoc. 2023;12(16): e028849. [DOI] [PMC free article] [PubMed] [Google Scholar]
- 46.Zhu D, Chung HF, Dobson AJ, Pandeya N, Giles GG, Bruinsma F, et al. Age at natural menopause and risk of incident cardiovascular disease: a pooled analysis of individual patient data. Lancet Public Health. 2019;4(11):e553–64. [DOI] [PMC free article] [PubMed] [Google Scholar]
Associated Data
This section collects any data citations, data availability statements, or supplementary materials included in this article.
Supplementary Materials
Additional file 1: Table S1. Correlations of baseline abdominal obesity indices with incident CVD among postmenopausal women after adjusted using Model 1, 2 and 3. Table S2. The predictive performance of abdominal obesity indices for incident CHD and stroke among postmenopausal women. Table S3. Correlations of baseline CVAI with incident CHD and stroke among postmenopausal women. Figure S1. Kaplan–Meier curves of CHD and stroke by CVAI quartiles.
Data Availability Statement
The datasets used and/or analyzed during the current study are available from the corresponding author on reasonable request.