Abstract
Cell growth and proliferation requires an intricate coordination between the stimulatory signals arising from nutrients and growth factors and the inhibitory signals arising from intracellular and extracellular stresses. Alteration of the coordination often causes cancer. In mammals, the mTOR (mammalian target of rapamycin) protein kinase is the central node in nutrient and growth factor signaling, and p53 plays a critical role in sensing genotoxic and other stresses. The results presented here demonstrate that activation of p53 inhibits mTOR activity and regulates its downstream targets, including autophagy, a tumor suppression process. Moreover, the mechanisms by which p53 regulates mTOR involves AMP kinase activation and requires the tuberous sclerosis (TSC) 1/TSC2 complex, both of which respond to energy deprivation in cells. In addition, glucose starvation not only signals to shut down mTOR, but also results in the transient phosphorylation of the p53 protein. Thus, p53 and mTOR signaling machineries can cross-talk and coordinately regulate cell growth, proliferation, and death.
Keywords: AMP-activated kinase, autophagy, tuberous sclerosis 1/tuberous sclerosis 2
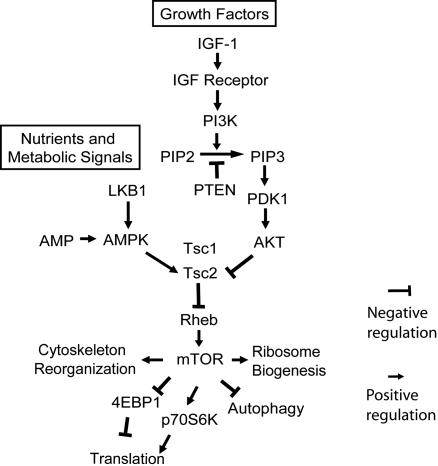
TOR (target of rapamycin) is an evolutionarily conserved serine-threonine protein kinase that belongs to the PIKK [phosphoinositide 3-kinase (PI3K)-related kinase) family, and it plays an important role in regulating cell growth and proliferation (1). In metazoans, TOR is a central signal integrator that receives signals arising from growth factors, nutrients, and cellular energy metabolism (1, 2). Recently, a conserved pathway through which growth factors regulate TOR activity has been identified in organisms ranging from worms (Caenorhabditis elegans) to mammals (ref. 1 and Fig. 1). In mammals, mTOR (mammalian TOR) is regulated by a kinase cascade consisting of PI3K, PI3K-dependent kinase 1, and AKT and by regulators of this cascade, including PTEN and tuberous sclerosis (TSC) 1 and TSC2 (Fig. 1). In addition, nutrients and energy metabolism can regulate mTOR activity through changing the conformation of the mTOR complex (3) or through altering intracellular AMP levels, which signal to mTOR by means of AMP-activated kinase (AMPK) and the TSC1/TSC2 complex (ref. 4 and Fig. 1). Upon activation, mTOR increases the phosphorylation levels of its downstream targets, through which it regulates an array of cellular processes. The p70S6 kinase and eIF4E binding protein 1 (4EBP1) are key regulators of translation, and they are among the most well characterized targets of mTOR (5, 6). Phosphorylation of p70S6K and 4EBP1 by mTOR leads to increased levels of translation (Fig. 1). In addition, through mechanisms that are less clear, mTOR regulates other processes, such as activation of ribosome biogenesis (7), reorganization of the actin cytoskeleton (8), and inhibition of autophagy (9). As a result, mTOR activation promotes cell growth and proliferation, whereas mTOR inhibition stops cell growth and initiates catabolic processes, including autophagy. mTOR activities are frequently up-regulated in many cancers as a result of genetic alterations of the components in the network described above (Fig. 1). On the one hand, many negative regulators of mTOR, such as PTEN, TSC1, TSC2, and LKB1, have been identified as tumor suppressors. Mutations/deletions of these tumor suppressor genes are common in cancers (10). On the other hand, the genes encoding the positive regulators of mTOR, including AKT and PI3K, are protooncogenes that are commonly up-regulated or amplified in human cancers (11). Thus, proper regulation of mTOR by this signaling network is crucial for normal cell growth and proliferation.
Fig. 1.
Signal transduction pathways leading to mTOR activation.
Normal cell growth and proliferation also require checkpoint controls. The tumor suppressor p53 is a major checkpoint protein in mammalian cells (12, 13). p53 is normally kept at a low level as a result of a negative feed back regulation between p53 and Mdm2. Intracellular genotoxic stresses, including DNA damage, hypoxia, and oncogene activation, activate p53, which in turn initiates cellular tumor suppression programs such as apoptosis or cell cycle arrest (14). Mutations of the p53 gene are found in >50% of human tumors, highlighting the importance of p53 in tumor suppression.
To ensure normal cell growth and proliferation, it is critical for cells to coordinate the stimulatory signals arising from nutrients and growth factors and the inhibitory signals arising from intracellular stresses. Although p53 can affect cell growth and proliferation indirectly by activating cell cycle regulators, such as cyclin-dependent kinase inhibitor p21, several lines of evidence suggest that p53 might also communicate directly with the mTOR signaling network (15–17). These observations prompted us to investigate the cross-communication between the p53 and mTOR signaling networks.
Materials and Methods
Cells and Cell Culture. The WT and p53-/- mouse embryonic fibroblasts (MEFs) were generated as described in ref. 18. The TSC1-/- and TSC2-/- p53-/- MEFs were from David J. Kwiatkowski (Brigham and Women's Hospital, Boston). The V138 cell line was from Jiandong Chen (H. Lee Moffitt Cancer Center, Tampa, FL). Cells were maintained in DMEM supplemented with 10% FBS. Etoposide (Sigma) and compound C (Merck) from GaoChao Zhou (Merck Research Laboratories, Rahway, NJ) (19) were dissolved in DMSO, and the solution was added to culture medium to final concentrations as described in each experiment. The p53 expression vector or empty vector was transfected into TSC2-/- p53-/- MEFs by using the FuGENE 6 kit (Roche Applied Science, Indianapolis) as recommended by the vendor.
Antibodies and Western Blot. The sources of antibodies are as follows. Two different mitogen-activated protein (MAP)-LC3 antibodies were gifts from Yasuo Uchiyama (Osaka University Graduate School of Medicine, Osaka) and Noboru Mizushima (Tokyo Metropolitan Institute of Medical Sciences, Tokyo). The phospho-p70 S6 kinase (Thr-389) (catalog no. 9206) and phospho-AMPK (Thr-172) (catalog no. 2535) antibodies were from Cell Signaling Technology (Beverly, MA); anti-p53 (FL-393) (sc-6243), anti-tuberin (C-20) (sc-893), phospho-p53 (Ser-15) (Sc-11764), and anti-PTEN (A2B1) (sc-7974) antibodies were from Santa Cruz Biotechnology; and anti-actin antibody (A5441) was from Sigma. To separate the MAP-LC3-I and MAP-LC3-II proteins, the cell lysates were separated on 16% SDS/PAGE. All other Western blot analyses were performed under standard protocols (20).
Electron Microscopy. Electron microscopy was performed by the University of Medicine and Dentistry of New Jersey-Robert Wood Johnson Medical School electron microscopy core facility. Briefly, WT or p53-/- MEFs were treated with or without 20 μM etoposide for 24 h. Cells were then fixed and embedded. Thin sections (90 nm) were cut on a Reichert Ultracut E microtome. Sections were scoped at 80 kV with a JEOL 1200EX transmission electron microscope.
Quantitative Real-Time PCR. Total RNA was prepared by using the RNeasy kit (Qiagen, Valencia, CA) and treated with DNase I to remove residual genomic DNA. cDNA was prepared with random primers by using the Taqman reverse transcription kit (Applied Biosystems). Real-time PCR was performed in triplicate with Taqman PCR Mix (Applied Biosystems) for 15 min at 95°C for initial denaturing, followed by 40 cycles of segments of 95°C for 30 s and 60°C for 30 s in the 7000 Applied Biosystems Sequence Detection System. Assay-on-demand for human tuberin (TSC2) (catalog no. Hs00241068_s1), human PTEN (catalog no. Hs00829813_m1), human actin (catalog no. Hs99999903_m1) were purchased from Applied Biosystems. The expression levels of the PTEN and TSC2 genes were normalized against the expression levels of the housekeeping gene, actin.
Results
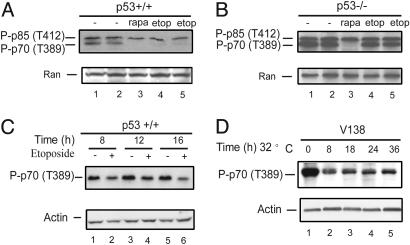
p53 Activation Inhibits mTOR Activity. The impact of p53 activation on mTOR activity was studied in normal cells in culture, the WT primary MEF cells. Treatment with etoposide, which inhibits the topoisomerase II and induces double-stranded DNA breaks, activates p53 in these MEF cells (21). mTOR specifically phosphorylates the p70S6 kinase at Thr-389. Western blot analysis to determine the level of phosphorylation at this position is a routine and specific assay used to monitor mTOR activity (5). As shown in Fig. 2A, etoposide treatment for 24 h dramatically reduces this mTOR activity in WT MEF cells (Fig. 2 A, lanes 4 and 5 vs. lanes 1 and 2). The phosphorylation of p70S6K at Thr-389 is mTOR-specific, as demonstrated by using an inhibitor that is highly specific to mTOR, rapamycin (Fig. 2 A, lane 3). To further demonstrate that the inhibition of the mTOR activity was mediated by the p53 protein in these cells, the isogenic p53-/- MEFs were treated with etoposide under the exact same conditions. As shown in Fig. 2B, etoposide treatment had little impact on the activity of mTOR in p53-/- MEFs (Fig. 2B, lanes 4 and 5 vs. lanes 1 and 2). The time course of mTOR inhibition by p53 was also studied. As shown in Fig. 2C, mTOR activity is clearly inhibited by 8 h after etoposide treatment (Fig. 2C, compare lane 2 to lane 1). This inhibition could be detected as early as 4 h and faded away after 36 h (data not shown). Taken together, these results demonstrate that etoposide treatment, which induces DNA damage, a physiological signal for p53 activation, inhibits mTOR activity in a p53-dependent manner.
Fig. 2.
mTOR activity is inhibited by p53 activation. WT (p53+/+)(A and C) or p53-/- (B) MEFs were treated with or without different drugs (etop, 20 μM etoposide; rapa, 100 nM rapamycin) as indicated for 24 h (A and B) or for the indicated amount of time (C). The p53 temperature-sensitive cell line V138 (D) was shifted to 32°C for the indicated amount of time. All of these cells were then harvested, and Western blot analyses were performed to determine the levels of phosphorylated p70S6K at Thr-389 with phosphorylation-specific antibody, which recognizes both phosphorylated p85 S6K at Thr-412 (upper band as indicated) and phosphorylated p70 S6K at Thr-389 (lower band as indicated). Only phosphorylated-p70 S6K (T389) is shown in C and D. Ran or actin protein levels serve as loading controls.
To directly demonstrate that p53 activation blocks mTOR activity, V138, a cell line that harbors a temperature-sensitive p53 mutation, was used to conditionally and acutely turn on p53 activity in these cells. V138 is generated by stably transfecting a temperature-sensitive form of p53 (Ala-138 is mutated to Val-138) into the H1299 cells, a human lung cancer cell line that has no endogenous p53 gene expression (22). p53 can be activated by switching the temperature of the cells in culture from 37°C to 32°C. As shown in Fig. 2D, activation of the temperature-sensitive p53 (at 32°C) dramatically reduced the levels of the p70S6K protein phosphorylation at Thr-389, indicating a considerable reduction of the mTOR activity. A similar temperature shift had no effect in the parental H1299 cells, which have no p53 present (data not shown). This result confirmed that activation of p53 is sufficient to inhibit mTOR activity.
Consistent with this negative regulation of mTOR activity by p53, when the WT MEFs and their isogenic p53-/- counterparts were grown under the exact same culture conditions, the levels of the Thr-389 phosphorylated form of p70S6 kinase in the p53-/- cells were significantly higher than those in the WT cells (data not shown).
p53 Activation Regulates Other mTOR Downstream Targets, Including Autophagy. In addition to p70S6 kinase, other downstream targets/processes of mTOR were also examined. Autophagy, a lysosome-dependent cellular degradative process that recently has been shown to be a tumor suppression mechanism (23–25), could be negatively regulated by mTOR (9, 26). Experiments were designed to test whether p53 activation can induce autophagy. The hallmark of autophagy is the emergence of the double-membrane autophagic vacuoles in cells detected by electron microscopy. The MEFs were treated with etoposide for 24 h before they were fixed and visualized with electron microscopy. Approximately 50% of WT MEFs showed a dramatic increase in intracellular vacuole formation, many of which were clearly double-membrane autophagic vacuoles with typical mitochondria cargoes (compare Fig. 3 A and B). By contrast, <10% of the p53-/- cells showed some autophagic vacuoles after etoposide treatment. To further quantify the effect of p53 activation on autophagy, Western blot analysis was performed with an antibody against MAP-LC3. During autophagy, the protein MAP-LC3 (the mammalian homolog of the yeast Atg8 protein) undergoes cleavage and lipidation, and the level of processed MAP-LC3 (MAP-LC3 II) is a good quantitative measurement of autophagy (27). As shown in Fig. 3C, upon etoposide treatment, the processed MAP-LC3 II form increased >5-fold in the WT MEF cells (lane 2 vs. lane 1), whereas there was little or no increase of MAP-LC3 II levels in p53-/- MEF cells (Fig. 3C, lane 4 vs. lane 3). These experiments indicate that p53 activation can coordinately turn on autophagy.
Fig. 3.
p53 activation increases autophagy levels. (A and B) WT MEFs were treated with (A) or without (B)20 μM etoposide for 24 h. Cells were then fixed and analyzed by electron microscopy. A and B show typical morphology of the majority of cells in each sample. Arrows in A indicate typical autophagic vacuoles. (C) WT or p53-/- MEFs were treated with or without etoposide for 12 h as indicated. The levels of MAP-LC3-I, MAP-LC3-II, and p53 were determined by Western blot analyses with MAP-LC3 and p53 antibodies. Ran levels serve as loading controls.
Another known mTOR downstream target, 4EBP1, was also studied. The phosphorylation of 4EBP1 at position Thr-37, a mTOR-specific phosphorylation, demonstrated a similar decrease as that observed with p70S6K after etoposide treatment (data not shown). Together, these results confirm that activation of p53 inhibits mTOR and affects its multiple downstream effectors.
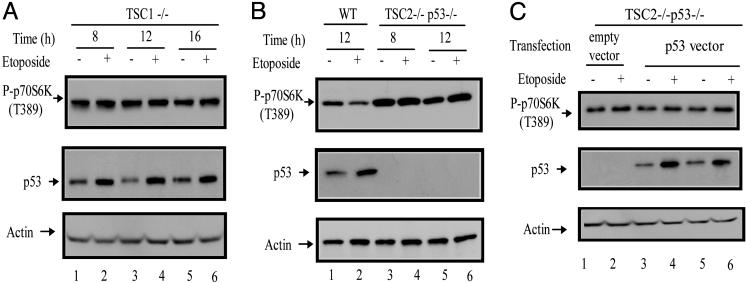
TSC1/TSC2 Complex Is Required for p53-Dependent mTOR Inhibition in MEFs. TSC1 and TSC2 are tumor suppressor genes, mutations of which are implicated in the development of TSC, a disease manifested by development of benign tumors in various tissues. TSC1 and TSC2 proteins form a functional complex that was recently identified as an important regulator of mTOR (Fig. 1). To determine the role of the TSC1 and TSC2 proteins in mediating the effects of p53 on mTOR, similar experiments to those carried out in p53 WT and p53-/- MEFs were performed with the TSC1-/- MEFs and TSC2-/- MEFs. As shown in Fig. 4A, etoposide treatment had little effect on mTOR activity in TSC1-/- cells (Fig. 4A, lanes 2, 4, and 6 vs. lanes 1, 3, and 5), which contain WT and functional p53 (Fig. 4A Middle), indicating that TSC1 is essential for p53 dependent mTOR down-regulation. We also tested the effect of etoposide in TSC2-/- MEFs. For reasons that are not clear, the TSC2 deletion activates p53, leading to senescence of these MEFs. Thus, it was impossible to generate TSC2 null cells without inactivating p53. The TSC2-/- MEFs were generated in the p53-/- background (28). Consistent with TSC2's role in negatively regulating mTOR, the phosphorylated p70S6K levels were higher in TSC2-/- cells than in WT cells (Fig. 4B, lanes 3–6 vs. lane 1 and 2). Not surprisingly, DNA damage cannot elicit the inhibitory effect on mTOR without p53 in the TSC2-/- p53-/- MEFs (Fig. 4B, lanes 3–6). Strikingly, even the overexpression of exogenous p53 by transfecting a p53 expression vector into these TSC2-/- cells could not restore the inhibition of mTOR by DNA damage (Fig. 4C, lanes 3–6), indicating that, like TSC1, TSC2 is also required for p53-dependent regulation of mTOR. In contrast, overexpression of exogenous p53 by transfecting a p53 expression vector into a p53-/- MEFs could restore the inhibition of mTOR by etoposide treatment (data not shown).
Fig. 4.
mTOR inhibition by p53 in MEFs requires both TSC1 and TSC2. (A) TSC1-/- MEFs. (B) WTor TSC2-/- p53-/- MEFs, as indicated, were treated with 20 μM etoposide for the indicated amount of time. (C) TSC2-/- p53-/- MEFs were transiently transfected with either p53 expression vector or empty control vector as indicated. Twenty-four hours posttransfection, the cells were treated with 20 μM etoposide as indicated or left untreated for 8 h (lanes 3 and 4) or 12 h (lanes 1, 2, 5, and 6). Cells from A, B, and C were collected, and the levels of phosphorylated p70S6K (T389), p53, and actin were determined by Western blot analyses.
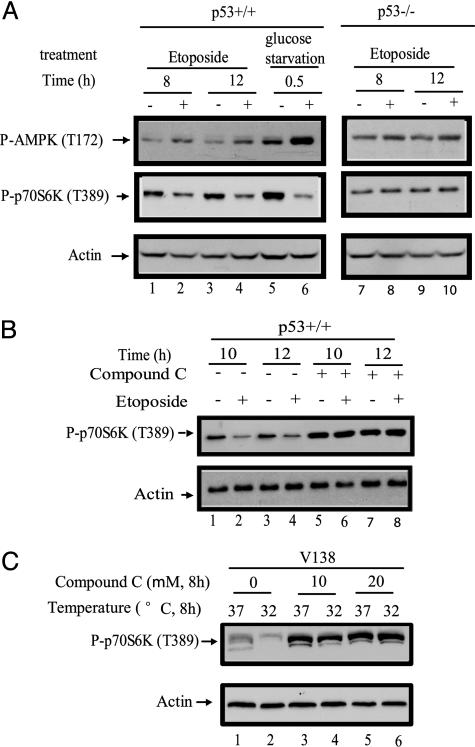
p53 Inhibits mTOR Through Activation of AMPK. The two major upstream regulators of the TSC1/TSC2 complex are AKT, a kinase that receives signals from growth factors, and AMPK, a kinase that receives signals from energy metabolism/nutrients (Fig. 1). The levels of AKT phosphorylation at Ser-473, which reflects AKT activity, did not change upon etoposide treatment in WT MEFs (data not shown), suggesting that p53 did not regulate mTOR activity through the AKT kinase branch of the pathway but might employ AMPK for its regulation of mTOR. AMPK can be activated by increased levels of AMP, which, in cells, is an indication of energy and nutrient reduction. The activation of AMPK requires the phosphorylation of Thr-172 of this protein, the level of which is indicative of AMPK activity in a cell. The levels of phosphorylation of Thr-172 in AMPK were measured in WT MEFs after etoposide treatment. Indeed, p53 activation by etoposide treatment increased AMPK activity (Fig. 5A Top, lanes 1–4). Moreover, the increase of AMPK activity correlates well with a decrease in mTOR activity (Fig. 5A Middle, lanes 1–6). The activation of AMPK is p53-dependent, as evidenced by the fact that a similar etoposide treatment failed to increase AMPK activity in p53-/- cells (Fig. 5A, lanes 7–10). AMPK knockout mice and MEFs are not available; however, an AMPK-specific inhibitor, compound C, has been developed by Merck, and it has been commonly used to investigate the functions of AMPK (4, 19). To test whether AMPK is required for the p53-dependent mTOR inhibition, we cotreated the MEFs with compound C. As shown in Fig. 5B, treatment with compound C totally abolished the effect of etoposide on mTOR activity (Fig. 5B, lanes 5–8 vs. lanes 1–4). To directly test the role of AMPK in p53-dependent mTOR inhibition, the V138 cells, which harbor a temperature-sensitive p53 mutation, were treated with the AMPK-specific inhibitor before temperature shift. As shown in Fig. 5C, the temperature shift activated p53 and dramatically inhibited mTOR activity (Fig. 5C, lanes 1 and 2) without compound C treatment. Similar to observations in MEFs cells, this AMPK inhibitor totally abrogated the effect of p53 activation on mTOR inhibition (Fig. 5C, lanes 3–6). Taken together, these results indicate that p53 regulates mTOR through activation of AMPK in MEFs.
Fig. 5.
p53 activation increases AMPK activity, and the activation of AMPK is required for mTOR inhibition by p53. (A) p53+/+ and p53-/- MEFs were treated with 20 μM etoposide, left untreated, or glucose-starved as indicated for the indicated amount of time. (B) p53+/+ MEFs were treated with 20 μM etoposide or left untreated, either in the absence or presence of compound C (20 μM) as indicated for the indicated amount of time. (C) V138 cells cultured at 37°C were treated with a 10 μM or 20 μM concentration of the AMPK inhibitor compound C or left untreated as indicated, immediately shifting to 32°C or remaining at 37°C, as indicated, for an additional culture for 8 h. At the end of each treatment, cells were collected, and the levels of phosphorylated AMPK (T172), phosphorylated p70S6K (T389), and actin were determined by Western blot analyses.
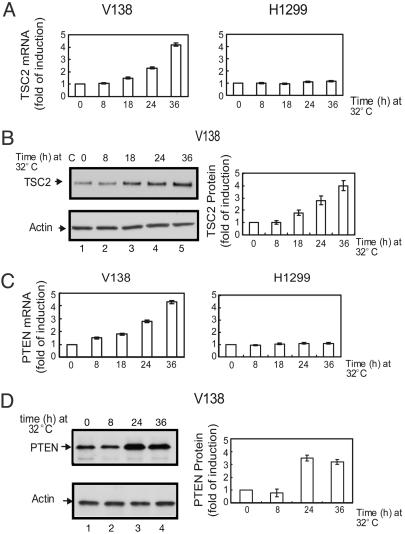
PTEN and TSC2 Are Induced in V138 Cells upon p53 Activation. The results described above clearly showed that p53 activation inhibited mTOR activity and that this regulation was mediated primarily by activation of AMPK in a p53-dependent fashion with the subsequent activation of the TSC1/TSC2 complex. In addition, there are other mechanisms by which the p53 protein can influence the mTOR activity. In V138 cells, which are derived from the human tumor cell line H1299 and harbor a temperature-sensitive mutant of p53, the activation of p53 increases the mRNA expression of both the PTEN and TSC2 genes. The levels of PTEN mRNA and protein (Fig. 6 C and D), as well as the levels of TSC2 mRNA and protein (Fig. 6 A and B), increased, as detected by real-time PCR and Western blot analysis, respectively. Previous experiments have demonstrated that the p53 protein, acting at a p53 DNA response element containing a p53 DNA-binding consensus sequence (RE), can transcriptionally activate the PTEN gene (16). Subsequent experiments have shown that this activation does not occur in MEFs and is only observed in selected cell types. The TSC2 gene was shown to contain several excellent p53 REs (29). In the V138 cells, the p53-mediated transcriptional activation of both the PTEN and TSC2 genes appears to be coordinately regulated (Fig. 6), and neither is induced by a p53 response in MEFs (data not shown). The increased levels of PTEN and TSC2 in a cell would act just like the activation of AMP kinase by p53 and block mTOR activity (Fig. 1). This result would happen, however, at a slower time frame (in 12–24 h) compared with the AMPK activation, which takes minutes or a few hours.
Fig. 6.
The mRNA and protein levels of PTEN and TSC2 are up-regulated upon p53 activation in V138 cells. (A and C) V138 cells and the parental H1299 cells were cultured at 37°C for 24 h before being shifted to 32°C for the indicated amount of time. Cells were collected, and total RNA were prepared. The mRNA levels of TSC2 (A) and PTEN (C) were determined by real-time PCR and normalized against the mRNA levels of actin. (B and D) V138 cells were cultured at 37°C for 24 h before being shifted to 32°C for the indicated amount of time. Cells were collected, and the protein levels of TSC2 (B) and PTEN (D) were detected by Western blot analyses. The levels of protein expression were quantified by densitometry and normalized against those of actin.
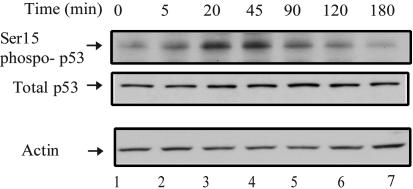
Glucose Starvation Rapidly Induces p53 Phosphorylation at Ser-15. Glucose is a major direct energy source for mammalian cells, and glucose levels fluctuate as a result of food intake and insulin regulation. A decrease in the glucose levels in the blood stream represents a common cellular energy stress. To address whether p53 is involved in sensing this type of cellular stress and to examine the cross-talk between the nutrient/metabolic pathways and the p53 signaling pathway, the posttranslational modifications of the p53 protein were examined upon glucose deprivation. As shown in Fig. 7, Ser-15 of p53 was rapidly phosphorylated (in minutes) upon glucose withdrawal in the human HCT116 cells. Ser-15 phosphorylation is the first step toward p53 activation but by itself does not activate the p53 transcriptional program or the stabilization of the p53 protein (Fig. 7). This Ser-15 phosphorylation of p53 is transient, being removed [possibly by the α-4-PP2A phosphatase (30)] as glucose starvation continues. These data suggest that p53 is involved directly in sensing the cellular stresses elicited by energy deprivation.
Fig. 7.
Glucose starvation induces a rapid and transient phosphorylation of p53 at Ser-15. HCT116 p53+/+ cells were cultured in complete medium for 24 h before being switched to medium without glucose for the indicated amount of time. Cells were collected, and the levels of phosphorylated p53 at Ser-15, total p53, and actin were determined by Western blot analyses.
Discussion
Recent genetic and biochemical studies have identified a highly conserved insulin-like growth factor I (IGF-I)–AKT–mTOR signal transduction pathway that permits eukaryotes to integrate nutrient and growth factor signals and, in turn, control cell growth and proliferation. mTOR and AKT are at the center of this conserved mechanism. In mammals, growth and maintenance factors positively regulate mTOR through activation of the PI3K–PI3K-dependent kinase 1–AKT kinase cascade and subsequent inhibition of the TSC1/TSC2 complex, which negatively regulates mTOR. Nutrient or energy deprivation can signal to mTOR by activation of AMPK, which positively regulates the TSC1/TSC2 complex. The importance of this regulation in normal cell growth and proliferation is evidenced by the genetic studies as well as epidemiological studies in cancers (10, 11). Mammalian cell growth and proliferation are also monitored by checkpoint regulation. Intracellular stresses, especially the genotoxic stresses, such as DNA damage, that could potentially alter the genetic material of cells will alert the checkpoint proteins and halt cell growth and proliferation. The tumor suppressor p53 plays a central role in sensing various genotoxic stresses. Here, we demonstrated that these two important cellular signaling pathways, p53 and IGF-I–AKT–mTOR, communicate directly with each other. p53 activation by a physiological relevant stress signal, DNA damage, inhibits mTOR activity in normal cells, the primary MEFs. A similar inhibition of mTOR activity in human cancer cells was observed after the activation of a temperature-sensitive mutant of p53. Moreover, the mechanisms by which p53 regulates mTOR activity were determined genetically and pharmacologically in these MEFs (by means of AMPK and the TSC1/2 complex). This regulation of mTOR by p53 is independent of the cell cycle regulation by p53 because p53 regulates mTOR in p21-/- MEFs as well as it does in WT MEFs (data not shown). Instead, p53 inhibits mTOR by means of a pathway that is used to detect nutrient/energy deprivation: namely, by activation of AMPK and the subsequent regulation of the TSC1/TSC2 complex. Inactivation of either AMPK or the TSC1/TSC2 complex totally abolishes the impact of p53 on mTOR. Just how p53 activates the AMPK remains to be explored. It is of some interest, however, that the p53 protein forms a complex with the LKB-1 kinase, which has been shown to regulate and activate AMPK (17). The LKB-1–p53 complex enhances the frequency of apoptosis mediated by p53 after DNA damage (17).
The fact that the major cellular stress-sensing molecule, p53, directly communicates with the major cell growth regulator, mTOR, is of considerable interest. After genotoxic stress, p53 is activated, which rapidly initiates a wave of starvation signals and triggers starvation-like responses by inhibiting mTOR. Translation and ribosome biogenesis are inhibited and autophagy is activated. The cells switch from an anabolic mode to a catabolic mode; consequently, cell growth is halted. Therefore, activation of the starvation responses by p53 apparently can provide a rapid damage-control mechanism that effectively, and possibly temporarily, prevents passing the altered genetic material from mother cells to daughter cells. This result might represent an early, rapid, and probably reversible tumor suppression mechanism of p53. The contribution of this regulation toward the tumor suppressor functions of p53 needs to be further examined. However, the report that p53 and PTEN mutations both are frequent but mutually exclusive in a subset of human breast cancers (31) supports the observation made here that p53 and PTEN are linked in the same pathway in series where either mutation abrogates the same pathway.
Autophagy is a lysosome-dependent cellular degradative process that, in the extreme case, may lead to cell death (type II program cell death). A decrease in autophagic levels by deletions of an essential autophagy gene, Beclin 1, is associated with 40–75% of sporadic human breast, ovarian, and prostate cancers (ref. 32 and references therein). Mice with a heterozygous Beclin 1 deletion developed various forms of tumors (24, 25). Apparently, autophagy represents a unique tumor suppression mechanism. The activation of p53 dramatically increases autophagy levels in cells, which might contribute to the tumor suppressor functions of p53.
It has been reported that p53 activates the transcription of the PTEN gene (16). Similar results were observed here in cells that harbor p53 with a temperature-sensitive mutation, the V138 cells. In addition, the TSC2 gene was coordinately induced in these cells upon p53 activation. The consequence of PTEN and TSC2 mRNA and protein induction is the inhibition of mTOR activity. However, the time course of PTEN and TSC2 induction takes place over 12–24 h. The time course of the p53 activation of AMPK and its subsequent inactivation of mTOR takes place in minutes to a few hours and is much faster. It could be the case that the slower p53-mediated induction of TSC2 and PTEN leads to inactivation of mTOR in a cell type-specific fashion or that it is at the least a useful backup mechanism if the AMPK–TSC2 pathway fails.
Although stress signals activate p53, which leads to the inactivation of mTOR, glucose starvation, which also inactivates mTOR, signals back to p53 by means of the phosphorylation of p53 Ser-15. This signal to p53 is transient and is the first step in the activation of p53. It is commonly followed by additional phosphorylations of the p53 protein at other serine or threonine residues, resulting in the stabilization of the p53 protein and the activation of its transcriptional program. It will be of some interest to determine the response of nutrient deprivation upon p53 activation in other cell types or even in cancer cells. In any case, it is clear that the p53 protein can monitor nutrient levels in cells.
In conclusion, we have demonstrated that p53 activation is able to inhibit the activity of mTOR through a pathway that is similar to that by energy deprivation: namely, by activation of AMPK and subsequent activation of the TSC1/TSC2 complex. Through inhibiting mTOR, p53 could consequently regulate a number of cellular processes, including inhibition of translation and activation of autophagy. The direct communication between the p53 and mTOR pathways might play an important role in ensuring normal cell growth and proliferation. It is likely this unusual regulatory mechanism by p53 contributes to the tumor suppression functions of p53.
Acknowledgments
We thank Dr. David J. Kwiatkowski for the TSC1 and TSC2 null MEFs, Dr. Jiandong Chen for the V138 cells, Drs. Yasuo Uchiyama and Noboru Mizushima for the MAP-LC3 antibodies, and Dr. Gaochao Zhou for the AMPK-specific inhibitor compound C.
Author contributions: A.J.L. and S.J. designed research; Z.F., H.Z., and S.J. performed research; A.J.L. and S.J. analyzed data; and A.J.L. wrote the paper.
Abbreviations: mTOR, mammalian target of rapamycin; TSC, tuberous sclerosis; AMPK, AMP-activated kinase; MEF, mouse embryonic fibroblast; PI3K, phosphoinositide 3-kinase; MAP, mitogen-activated protein.
References
- 1.Hay, N. & Sonenberg, N. (2004) Genes Dev. 18, 1926-1945. [DOI] [PubMed] [Google Scholar]
- 2.Harris, T. E. & Lawrence, J. C., Jr. (2003) Sci. STKE 2003, re15. [DOI] [PubMed] [Google Scholar]
- 3.Kim, D. H. & Sabatini, D. M. (2004) Curr. Top. Microbiol. Immunol. 279, 259-270. [DOI] [PubMed] [Google Scholar]
- 4.Inoki, K., Zhu, T. & Guan, K. L. (2003) Cell 115, 577-590. [DOI] [PubMed] [Google Scholar]
- 5.Brown, E. J., Beal, P. A., Keith, C. T., Chen, J., Shin, T. B. & Schreiber, S. L. (1995) Nature 377, 441-446. [DOI] [PubMed] [Google Scholar]
- 6.Brunn, G. J., Hudson, C. C., Sekulic, A., Williams, J. M., Hosoi, H., Houghton, P. J., Lawrence, J. C., Jr. & Abraham, R. T. (1997) Science 277, 99-101. [DOI] [PubMed] [Google Scholar]
- 7.Hannan, K. M., Brandenburger, Y., Jenkins, A., Sharkey, K., Cavanaugh, A., Rothblum, L., Moss, T., Poortinga, G., McArthur, G. A., Pearson, R. B. & Hannan, R. D. (2003) Mol. Cell. Biol. 23, 8862-8877. [DOI] [PMC free article] [PubMed] [Google Scholar]
- 8.Jacinto, E., Loewith, R., Schmidt, A., Lin, S., Ruegg, M. A., Hall, A. & Hall, M. N. (2004) Nat. Cell Biol. 6, 1122-1128. [DOI] [PubMed] [Google Scholar]
- 9.Meijer, A. J. & Codogno, P. (2004) Int. J. Biochem. Cell Biol. 36, 2445-2462. [DOI] [PubMed] [Google Scholar]
- 10.Inoki, K., Corradetti, M. N. & Guan, K. L. (2005) Nat. Genet. 37, 19-24. [DOI] [PubMed] [Google Scholar]
- 11.Luo, J., Manning, B. D. & Cantley, L. C. (2003) Cancer Cell 4, 257-262. [DOI] [PubMed] [Google Scholar]
- 12.Levine, A. J. (1997) Cell 88, 323-331. [DOI] [PubMed] [Google Scholar]
- 13.Vogelstein, B., Lane, D. & Levine, A. J. (2000) Nature 408, 307-310. [DOI] [PubMed] [Google Scholar]
- 14.Jin, S. & Levine, A. J. (2001) J. Cell Sci. 114, 4139-4140. [DOI] [PubMed] [Google Scholar]
- 15.Horton, L. E., Bushell, M., Barth-Baus, D., Tilleray, V. J., Clemens, M. J. & Hensold, J. O. (2002) Oncogene 21, 5325-5334. [DOI] [PubMed] [Google Scholar]
- 16.Stambolic, V., MacPherson, D., Sas, D., Lin, Y., Snow, B., Jang, Y., Benchimol, S. & Mak, T. W. (2001) Mol. Cell 8, 317-325. [DOI] [PubMed] [Google Scholar]
- 17.Karuman, P., Gozani, O., Odze, R. D., Zhou, X. C., Zhu, H., Shaw, R., Brien, T. P., Bozzuto, C. D., Ooi, D., Cantley, L. C. & Yuan, J. (2001) Mol. Cell 7, 1307-1319. [DOI] [PubMed] [Google Scholar]
- 18.Harvey, D. M. & Levine, A. J. (1991) Genes Dev. 5, 2375-2385. [DOI] [PubMed] [Google Scholar]
- 19.Zhou, G., Myers, R., Li, Y., Chen, Y., Shen, X., Fenyk-Melody, J., Wu, M., Ventre, J., Doebber, T., Fujii, N., et al. (2001) J. Clin. Invest. 108, 1167-1174. [DOI] [PMC free article] [PubMed] [Google Scholar]
- 20.Gallagher, S., Winston, S. E., Fuller, S. A. & Hurrell, J. G. R. (2003) in Current Protcols in Molecular Biology, eds. Ausubel, F., Brent, R., Kingston, R., Moore, D., Seidman, J. & Smith, J. (Wiley, New York) pp. 10.8.1-10.8.24.
- 21.Lowe, S. W., Ruley, H. E., Jacks, T. & Housman, D. E. (1993) Cell 74, 957-967. [DOI] [PubMed] [Google Scholar]
- 22.Pochampally, R., Fodera, B., Chen, L., Lu, W. & Chen, J. (1999) J. Biol. Chem. 274, 15271-15277. [DOI] [PubMed] [Google Scholar]
- 23.Liang, X. H., Jackson, S., Seaman, M., Brown, K., Kempkes, B., Hibshoosh, H. & Levine, B. (1999) Nature 402, 672-676. [DOI] [PubMed] [Google Scholar]
- 24.Qu, X., Yu, J., Bhagat, G., Furuya, N., Hibshoosh, H., Troxel, A., Rosen, J., Eskelinen, E. L., Mizushima, N., Ohsumi, Y., et al. (2003) J. Clin. Invest. 112, 1809-1820. [DOI] [PMC free article] [PubMed] [Google Scholar]
- 25.Yue, Z., Jin, S., Yang, C., Levine, A. J. & Heintz, N. (2003) Proc. Natl. Acad. Sci. USA 100, 15077-15082. [DOI] [PMC free article] [PubMed] [Google Scholar]
- 26.Noda, T. & Ohsumi, Y. (1998) J. Biol. Chem. 273, 3963-3966. [DOI] [PubMed] [Google Scholar]
- 27.Mizushima, N. (2004) Int. J. Biochem. Cell Biol. 36, 2491-2502. [DOI] [PubMed] [Google Scholar]
- 28.Zhang, H., Cicchetti, G., Onda, H., Koon, H. B., Asrican, K., Bajraszewski, N., Vazquez, F., Carpenter, C. L. & Kwiatkowski, D. J. (2003) J. Clin. Invest. 112, 1223-1233. [DOI] [PMC free article] [PubMed] [Google Scholar]
- 29.Hoh, J., Jin, S., Parrado, T., Edington, J., Levine, A. J. & Ott, J. (2002) Proc. Natl. Acad. Sci. USA 99, 8467-8472. [DOI] [PMC free article] [PubMed] [Google Scholar]
- 30.Kong, M., Fox, C. J., Mu, J., Solt, L., Xu, A., Cinalli, R. M., Birnbaum, M. J., Lindsten, T. & Thompson, C. B. (2004) Science 306, 695-698. [DOI] [PubMed] [Google Scholar]
- 31.Kurose, K., Gilley, K., Matsumoto, S., Watson, P. H., Zhou, X. P. & Eng, C. (2002) Nat. Genet. 32, 355-357. [DOI] [PubMed] [Google Scholar]
- 32.Aita, V. M., Liang, X. H., Murty, V. V., Pincus, D. L., Yu, W., Cayanis, E., Kalachikov, S., Gilliam, T. C. & Levine, B. (1999) Genomics 59, 59-65. [DOI] [PubMed] [Google Scholar]


