Abstract
Validation for canine serum of 2 commercially available time-resolved fluoroimmunoassays (TR-FIAs) designed for analysis of cortisol and free thyroxine (fT4) in human serum was carried out. Included was the study of interference by hemolysis, lipemia, and bilirubinemia. With the dissociation enhancement lanthanide fluoroimmunoassay kits, the intraassay coefficient of variation (CV) ranged from 6.4% to 8.7% for cortisol and from 5.3% to 9.8% for fT4; the interassay CVs ranged from 5.8% to 10.8% and from 3.9% to 14.1%, respectively. Accuracy was evaluated by comparing cortisol and fT4 results obtained with TR-FIA and those obtained with a validated enzyme-linked immunosorbent assay (ELISA) and an equilibrium dialysis (ED) assay, respectively. The regression equations obtained were y = 0.57x + 1.18 (r2 = 0.90) for cortisol and y = 0.87x + 0.82 (r2 = 0.93) for fT4. The limits of detection for cortisol and fT4 were 4.84 nmol/L and 2.68 pmol/L, respectively. The results of adrenocorticotropin-stimulation and dexamethasone-suppression tests were similar to those published previously; likewise, serial dilution of a canine serum sample with a high cortisol content demonstrated that the TR-FIA was immunologically specific. Serial dilution of a serum sample with a high fT4 concentration showed a methodologic bias, a dependence on serum binding capacity, which indicates that the results obtained with this method should be interpreted with caution. Finally, hemolysis and lipemia significantly interfered with cortisol and fT4 measurements, whereas bilirubinemia did not affect the results.
Résumé
La validation de deux fluoroimmunoessais («time-resolved fluoroimmunoassays», TR-FIAs) élaborés pour la mesure du cortisol et de la thyroxine libre (fT4) dans le sérum humain a été effectuée. Une étude d’interférence par l’hémolyse, la lipémie et la bilirubinémie est incluse. Avec la trousse DELFIA (« dissociation enhancement lanthanide fluoroimmunoassay »), le coefficient de variation (CV) intra-essai s’étendait de 6,4% à 8,7% pour le cortisol et de 5,3% à 9,8% pour la fT4; le CV inter-essai s’étendait de 5,8% à 10,8% et de 3,9% à 14,1%, respectivement. L’exactitude était évaluée en comparant les résultats de cortisol et de fT4 obtenus avec la TR-FIA à ceux obtenus avec une épreuve immuno-enzymatique (ELISA) et une dialyse par équilibre (ED), respectivement. Les équations de regression obtenues étaient y = 0,57x + 1,18 (r2 = 0,90) pour le cortisol et y = 0,87x + 0,82 (r2 = 0,93) pour la fT4. Les limites de détection du cortisol et de la fT4 étaient de 4,84 nmol/L et 2,68 pmol/L, respectivement. Les résultats de stimulation à l’adrénocorticotropine (ACTH) et le freinage à la dexaméthasone étaient semblables à ceux publiés précédemment. Également, une dilution en série d’un échantillon de sérum canin ayant une concentration élevée de cortisol a démontré que la TR-FIA était immunologiquement spécifique. Une dilution en série d’un échantillon de sérum ayant une concentration élevée de fT4 a montré un biais méthodologique, une dépendance de la capacité liante sérique, ce qui indique que les résultats obtenus avec cette méthode devraient être interprétés avec précaution. Finalement, l’hémolyse et la lipémie interfèrent significativement avec la mesure du cortisol et de la fT4 alors que la bilirubinémie n’affecte pas les résultats.
(Traduit par Docteur Jean-Sébastien Latouche)
Introduction
Canine hyperadrenocorticism (Cushing’s syndrome) is caused by excessive production of cortisol by the adrenal cortex. Hypoadrenocorticism, which is relatively uncommon in dogs, results from deficient production of glucocorticoid, mineralocorticoid, or both. Definitive diagnosis of both disorders depends on cortisol measurement in serum samples in the course of several screening tests, such as the dexamethasone-suppression test or the adrenocorticotropin (ACTH)-stimulation test for the 1st disorder and the ACTH-stimulation test for the 2nd disorder (1).
Hypothyroidism is one of the most frequent endocrinopathies in dogs. Reliable biochemical tests are required for its diagnosis. Currently, combined measurements of the concentrations of serum thyroid-stimulating hormone (TSH) and total thyroxine (tT4) or free T4 (fT4) are recommended (2). However, determination of the fT4 concentration in canine serum samples has several advantages over traditional measurements of the tT4 concentration: overlap of fT4 concentrations between euthyroid and hypothyroid dogs is less frequent than overlap of tT4 concentrations (3), the fT4 concentration is not as likely as the tT4 concentration to be affected by nonthyroidal illness or drug therapy (4), and measurement of the fT4 concentration as a test for hypothyroidism has higher sensitivity (0.98), specificity (0.93), and accuracy (0.95) than measurement of the tT4 concentration, which has a sensitivity of 0.89, a specificity of 0.82, and an accuracy of 0.85 (5).
Time-resolved fluoroimmunoassay (TR-FIA) is a novel alternative method to the traditional tests. It has been successfully used to measure the concentrations of several human and animal hormones, including insulin (6), human chorionic gonadotropin (hCG) (7), androstenone (8), relaxin (9), and cortisol (10). One of the recent commercial applications of TR-FIA is dissociation enhancement lanthanide fluoroimmunoassay (DELFIA), which combines purified antigens or monoclonal antibodies labelled with lanthanide chelates that have a long fluorescence decay time (europium, samarium, or terbium), and a particular time-resolving fluorometer for nanosecond measurements (11). This technique offers the advantages of high sensitivity, stability of the reagents, lack of radiation, low background interference, and a wide test range (12,13).
The purpose of this study was to validate for canine serum 2 commercially available TR-FIAs for the determination of cortisol and fT4 concentrations in human serum: DELFIA cortisol and DELFIA fT4 kits (PerkinElmer Life Sciences, Wallac Oy, Turku, Finland). Additionally, we studied the effect of increasing concentrations of hemoglobin, lipids, and bilirubin on cortisol and fT4 measurements, since knowledge of these effects is critical for the correct interpretation of laboratory data (14).
Materials and methods
Methodology
In DELFIA, specific binding reagents (antibodies or antigens in TR-FIA) are labelled with nonfluorescent chelates, and fluorescence is developed after the binding reaction has taken place on a solid phase by the use of a dissociative fluorescence-enhancement solution (15).
In the cortisol assay tested in this study, there is a solid phase coated with streptavidin, which binds biotinylated antibodies. During a 1st incubation period on a plate shaker (Titramax 100, Heidolph Instruments, Schwabach, Germany), europium-labelled cortisol and the sample cortisol compete for a limited number of binding sites on cortisol-specific biotinylated monoclonal antibodies. Buffer and serum are then washed away with a DELFIA plate washer (Wallac), and an enhancement solution is added. Europium ions are dissociated from the labelled cortisol into the enhancement solution, where they form highly fluorescent chelates with components of the solution. The amount of fluorescence is inversely proportional to the quantity of cortisol in the test sample.
With the fT4 kit, anti-T4 monoclonal antibody is first reacted with a solid phase coated with anti-mouse IgG. Then the sample is added, and the fT4 reacts with the anti-T4 antibody. After this 2nd incubation, buffer and serum are washed away. In a 3rd incubation step, europium-labelled T4 is added; it occupies the remaining empty binding sites on the anti-T4 antibodies. As with the cortisol assay, after washing steps, an enhancement solution is added to dissociate the europium from the labelled T4. The amount of resulting fluorescence is inversely proportional to the amount of fT4 in the test sample.
The enhanced fluorescence was measured in a VICTOR 1420 multilabel counter (PerkinElmer, Wallac).
Animals
For the cortisol study, we used 10 adult male German Braco dogs, supplied by the Animal Center of Murcia University. The animals were determined to be healthy on the basis of physical and clinicopathological findings. For validation of the fT4 DELFIA kit, we used 20 random-source dogs of different breeds and sex; 12 were clinically healthy, 7 had hypothyroidism, and 1 had hyperthyroidism.
Blood samples were collected by venipuncture into Tapval tubes (Aquisel, Barcelona, Spain), allowed to clot at room temperature, and centrifuged at 3000 × g for 10 min. The serum samples obtained were stored at −20°C until analyzed.
Validation
Precision
For cortisol, intra-assay variation, expressed as the coefficient of variation (CV), was determined by analyzing in quadruplicate in the same assay 4 serum samples obtained after an ACTH-stimulation test and 4 samples with normal levels of cortisol. For fT4, intra-assay variation was assessed from differences between duplicate determinations on 18 canine samples: 6 with low, 6 with medium, and 6 with high fT4 content. For cortisol, interassay variation was assessed by analyzing the same 8 samples as used for assessing intra-assay variation on 5 d within 3 wk. For fT4, interassay variation was assessed by the use of 6 samples, 2 with low, 2 with medium, and 2 with high concentrations of hormone, on 5 d within 3 wk. Samples were kept frozen at −20°C between the assays.
Accuracy
For the DELFIA cortisol kit, the results for 10 samples of canine serum (1 with a low concentration, after administration of dexamethasone; 4 with basal concentrations, before administration of ACTH; and 5 with high concentrations, after administration of ACTH) were compared with those obtained with a previously validated ELISA (Enzymun-Test; Boehringer Mannheim, Ingelheim, Germany) (16). For the DELFIA fT4 kit, the results for 20 samples of canine serum were compared with those provided by a validated equilibrium dialysis (ED) assay (Nichols Institute Diagnostics, Bad Vilbel, Germany) (2).
Limit of detection
For both kits, the limit of detection, defined as the smallest concentration of analyte detectable by the method, was calculated by repeated analysis (n = 10) of the zero standard (cortisol- and fT4-free human serum) and expressed as the mean plus 2 standard deviations (s) (17).
Specificity
Immunologic specificity was evaluated by comparing parallelism of the standard curves obtained with the kits and the curves obtained from serial dilutions of canine samples with high concentrations of cortisol and fT4. A special diluent, DELFIA diluent I (Wallac), was used. Biologic specificity was tested only for cortisol, by the use of previously described dynamic tests (16), ACTH stimulation and low-dose dexamethasone suppression (LDDS), performed in 10 healthy dogs in different weeks to permit recovery to basal cortisol levels. Baseline blood samples were obtained. To avoid variation due to circadian rhythm, we conducted the tests first thing in the morning.
Effects of hemolysis, lipemia, and bilirubinemia
The effects of these interfering processes on cortisol and fT4 determinations were assessed following previously reported protocols for lipemia and bilirubinemia (14,18). Hemolysis was produced by freezing red cells at −20°C in order to not incorporate distilled water into the assay. For both assays, the hemolysate was added to pooled serum at final concentrations of 0.0, 0.25, 0.5, 1.0, 2.0, and 4.0 g/dL. A commercial emulsion of triglycerides (Lipofundina MCT/LCT 20%; Braun Medical, Barcelona, Spain) was added to homologous pooled serum samples at final concentrations of 0.0, 31.2, 62.5, 125, 250, 500, and 10 000 mg/dL. Bilirubin (Sigma-Aldrich, Spain) was dissolved in dimethylsulfoxide (DMSO) and the solution added to pooled serum samples at final concentrations of 0, 3.75, 7.5, 15, 30, and 60 mg/dL. For the hemoglobin and lipid series, DELFIA diluent I was used rather than DMSO.
Statistical analysis
The data were analyzed by standard methods. The significance level was set at 0.05. Analysis of variance was used. Precision data were reported as mean ± s. Simple regression analysis was used to compare results obtained by TR-FIA with those obtained by ELISA and equilibrium dialysis (ED).
Results
Intra- and interassay CVs for the cortisol and fT4 DELFIAs appear in Table I. With respect to intra-assay variation, samples with a normal concentration of cortisol had a CV of 6.4%, whereas samples with a high concentration of cortisol had a CV of 8.7%. For fT4 the CVs ranged from 5.3% for samples with a low concentration of this hormone to 9.8% for samples with a medium concentration. With respect to interassay variation, samples with a medium concentration of cortisol had a CV of 5.8%, whereas samples with a high concentration had a CV of 10.8%. Samples with a high fT4 concentration had the lowest CV (3.9%), and samples with a medium concentration had the highest CV (14.1%).
Table I.
Intra-assay and interassay precision of cortisol and free thyroxine (fT4) concentrations in canine serum as determined by time-resolved fluoroimmunoassay (TR-FIA)
| Coefficient of Variation (%)
|
|||
|---|---|---|---|
| Hormone and sample | Concentration, mean ± s | Intra-assay | Interassay |
| Cortisol, nmol/L (n = 4) | |||
| Before ACTH given | 31.7 ± 2.0 | 6.4 | 5.8 |
| After ACTH given | 158.2 ± 13.8 | 8.7 | 10.8 |
| fT4, pmol/L (n = 6) | |||
| Low concentration | 7.6 ± 0.4 | 5.3 | 7.0 |
| Medium concentration | 22.6 ± 2.6 | 9.8 | 14.1 |
| High concentration | 98.1 ± 8.5 | 7.5 | 3.9 |
s — standard deviation; ACTH — adrenocorticotropin
On comparing the results of TR-FIA for cortisol and fT4 with those obtained by ELISA and ED, the following regression equations were obtained: for cortisol, y = 0.57x + 1.18, where y = TR-FIA result (nmol/L) and x = ELISA result (nmol/L) (Figure 1); and for fT4, y = 0.87x + 0.82, where y = TR-FIA result (pmol/L) and x = ED result (pmol/L) (Figure 2). Measurements obtained with TR-FIA were highly correlated with those provided by ELISA (r2 = 0.90) and ED (r2 = 0.93).
Figure 1.
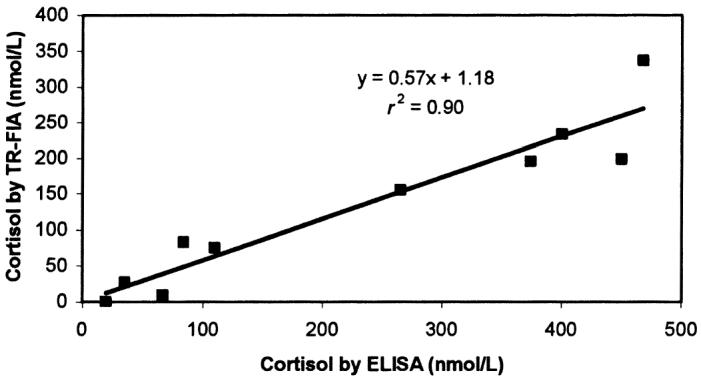
Correlation between the results of time-resolved fluoroimmunoassay (TR-FIA) and enzyme-linked immunosorbent assay (ELISA) in the measurement of cortisol concentrations in serum samples from 10 dogs.
Figure 2.
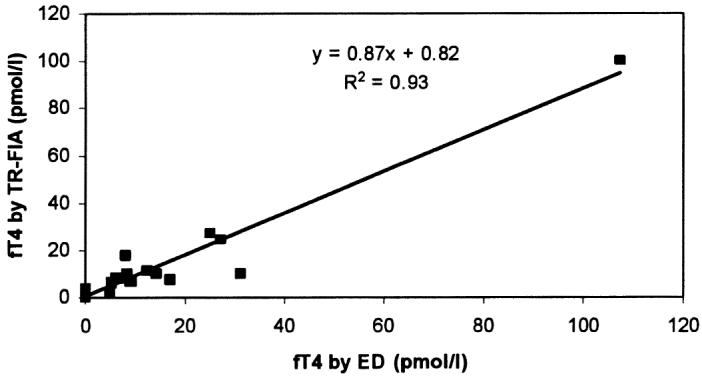
Correlation between the results of TR-FIA and equilibrium dialysis (ED) in the measurement of free thyroxine (fT4) concentrations in serum samples from 20 dogs.
The sensitivity, or limit of detection, calculated as twice the s from the mean response for the zero control samples, was 4.84 nmol/L for cortisol and 2.68 pmol/L for fT4.
Results obtained after diluting a sample with a high content of cortisol and fT4 are shown in Table II and Figures 3 and 4. Dilution caused a decrease in cortisol concentration proportional to the dilution factor (except for the highest dilution), and the curve constructed by using serial dilutions of canine serum was parallel to that obtained with the human standards. Likewise, fT4 showed a strong decrease in concentration when samples were diluted, and the 2 curves, the standard curve and that obtained from serial dilutions of a serum sample, were parallel.
Table II.
Cortisol and fT4 concentrations in serially diluted serum samples from a dog as determined by TR-FIA
| Concentration
|
|||
|---|---|---|---|
| Hormone | Dilution | Uncorrected | Corrected |
| Cortisol (nmol/L) | Undiluted | 419.3 | 419.3 |
| 1:2 | 179.8 | 359.6 | |
| 1:4 | 90.6 | 362.4 | |
| 1:8 | 52.7 | 422.1 | |
| 1:16 | 41.0 | 656.0 | |
| fT4 (pmol/L) | Undiluted | 70.6 | 70.6 |
| 1:2 | 27.9 | 55.8 | |
| 1:4 | 13.3 | 53.2 | |
| 1:8 | 9.7 | 77.6 | |
| 1:16 | 8.7 | 139.2 | |
Figure 3.
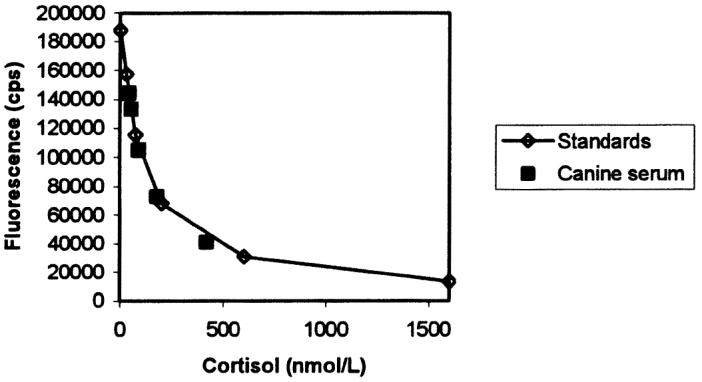
Parallelism between dilution curves for canine serum (▪) and human standards (⋄) in the cortisol assay. cps — counts per second.
Figure 4.
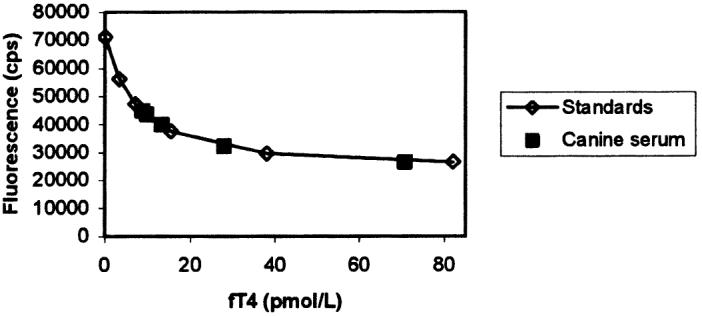
Parallelism between dilution curves for canine serum (▪) and human standards (⋄) in the free thyroxine (fT4) assay.
Data obtained after ACTH stimulation and LDDS are presented in Table III. The ACTH administration produced a significant increase (P = 0.0015) from basal cortisol levels, whereas LDDS caused a significant decrease (P = 0.021). The highest value after ACTH administration was 326.72 nmol/L and the lowest after LDDS 4.84 nmol/L.
Table III.
Serum cortisol concentrations (nmol/L) for 10 dogs at baseline and after adrenocorticotropin (ACTH) stimulation and low-dose dexamethasone suppression (LDDS) as determined by time-resolved fluoroimmunoassays (TR-FIA)
| After test
|
|||
|---|---|---|---|
| Measure | At baseline | ACTH | LDDS |
| Mean | 41.36 | 207.98a | 10.45b |
| SD | 20.67 | 92.91 | 7.99 |
| Minimum | 15.89 | 102.71 | 4.84 |
| Maximum | 75.01 | 326.72 | 22.42 |
Significantly higher than baseline value (P = 0.0015)
Significantly lower than baseline value (P = 0.021)
The effect of the interfering substances can be appreciated in the corresponding interferographs, where data points represent the mean of duplicate determinations, x-axes increasing concentrations of hemoglobin (Figure 5), triglycerides (Figure 6), or bilirubin (Figure 7), and y-axes the percentage change in cortisol or fT4 concentration for a given concentration of the added substance. The addition of fresh hemolysate to serum samples significantly increased the cortisol concentration (P = 0.022), but only with the highest hemoglobin concentrations (2 and 4 g/dL). On the other hand, the same hemolysate produced a generalized decrease in fT4 concentration, although the differences were not significant (P = 0.29). The addition of triglycerides, independent of the amount, significantly decreased the cortisol concentration (P = 0.014); however, increasing triglyceride amounts caused a significant and continuous increase in fT4 concentration (P = 3.49 × 10⁻⁶, r2 = 0.92). Different bilirubin concentrations did not affect the concentration of cortisol (P = 0.64) or fT4 (P = 0.95).
Figure 5.
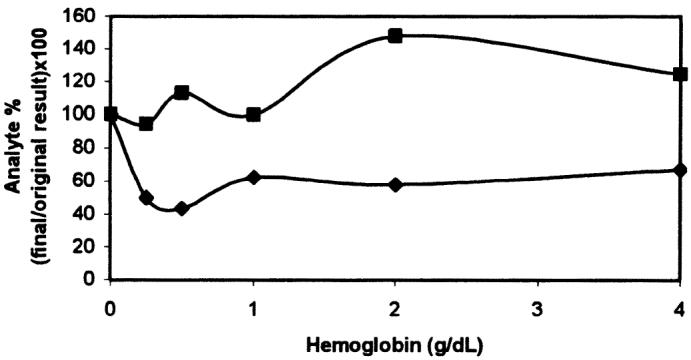
Effect of added hemoglobin on serum cortisol (▪) and free thyroxine (fT4) (♦) determinations.
Figure 6.
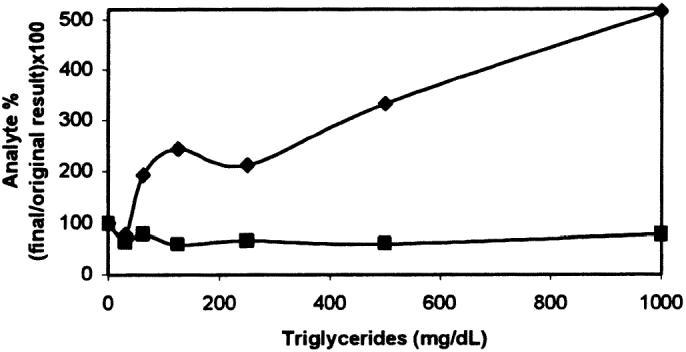
Effect of added triglycerides on serum cortisol (▪) and free thyroxine (fT4) (♦) determinations.
Figure 7.
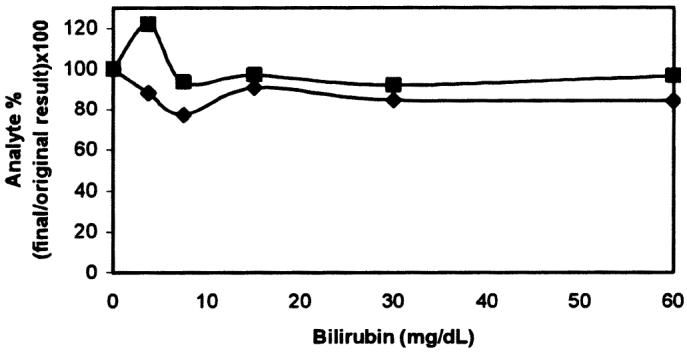
Effect of added bilirubin on serum cortisol (▪) and free thyroxine (fT4) (♦) determinations.
Discussion
The lack of species-specific commercial kits for cortisol and fT4 measurements in canine samples led us to use, for this study, kits developed and validated for human samples. However, use of human assays or human reference laboratories for assaying animal specimens is unwise unless the assays have been validated adequately (19). Hence, 4 standard criteria for validating immunoassays were assessed with the TR-FIAs; namely, precision, accuracy, sensitivity, and specificity (20). Additionally, effects of hemolysis, lipemia, and bilirubinemia were studied.
The precision study of the cortisol assay provided intra- and interassay CVs of 6.4% to 8.7% and 5.8% to 10.8%, respectively. These values are higher than those obtained with an automated ELISA (16) and similar to those obtained with a manual ELISA (21) and a radioimmunoassay (RIA) (22) but lower than those obtained with a chemiluminescent assay (20).
The intra-assay CVs for fT4 ranged between 5.3% and 9.8%. These values are higher than those described with an ELISA (23). However, a different ELISA (24), an assay based on chemiluminescence (25), and a direct ED assay (26) provided CVs similar to ours. Our interassay CVs for fT4 (3.9% to 14.1%) were higher than those reported by some authors (2,23), although values of 13% (24) and 15.3% (27) have also been reported.
Pipetting and dispensing of reagents were done manually in our study, in contrast to other studies (2,17,20,23,24), in which automated autoanalyzers automatically performed all the assay steps. This fact could have influenced the CVs. Further studies would be desirable to determine if the CVs could be improved with the use of an automated DELFIA Dispense Unit or another automated system for pipetting samples and reagents instead of a conventional multipipette.
The accuracy of DELFIA correlated well with the accuracy of a previously validated ELISA in measuring cortisol concentrations and with the accuracy of an ED assay in measuring fT4 concentrations, as reflected in the r2 values of 0.90 and 0.93, respectively. Thus, for dogs, TR-FIA seems an accurate technique for determining the serum concentration of these types of compounds, as it is for human cortisol (27) and bovine cortisol (11), as well as for many other hormones (7,8).
The limit of detection for the DELFIA cortisol assay was very similar to that obtained with 2 RIAs (28,29) and lower than the limit of detection with chemiluminescence (20). Only ELISA (16) provided a lower detection limit (2.76 nmol/L). The limit of detection for the DELFIA fT4 assay was very similar to that with an ELISA (24) and an ED (26) and lower than that obtained with several RIAs (4,30,31). The assays allow the detection of cortisol and fT4 concentrations as low as 4.84 nmol/L and 2.68 pmol/L, respectively, well beyond the reported normal concentrations in canine serum (16,31). Therefore, TR-FIA can be considered a highly sensitive method that may allow the detection of the small cortisol and fT4 concentrations needed for the diagnosis of Cushing’s syndrome, hypoadrenocorticism, and hypothyroidism in dogs.
With regard to specificity of the assays, the DELFIA cortisol kit showed a decrease in cortisol concentration when the degree of dilution of the sample increased. Furthermore, the curve obtained after diluting the canine sample paralleled that obtained with the human standards; therefore, the assay can be considered immunologically specific. However, we recommend avoiding the dilution of samples since the diluent might interfere with the assay, as may have happened with the highest dilution. This process would not be necessary in routine practice since the assay range supplied by the kit (0 to 1600 nmol/L) is much wider than cortisol reference ranges in healthy dogs and after ACTH stimulation. This assay range is also wider than that provided by ELISA, which has an upper standard of 1399 nmol/L (16). On the other hand, our results from ACTH stimulation and LDDS indicate that the TR-FIA can detect significant changes (increases and decreases, respectively) in cortisol concentrations after administration of the test substance, agreeing with previous reports (1,31) and demonstrating the biologic specificity of the assay.
The DELFIA fT4 kit showed a marked decrease in fT4 concentration when the degree of dilution of the sample increased; this fact could indicate the presence of a methodologic bias, a dependence on serum binding capacity (sBC), since theoretically dilution of serum should not reduce the fT4 concentration (32). The appearance of an sBC-dependent bias in a method can be related to 3 factors: excessive sample dilution; T4 sequestration by anti-T4 antibodies included in the assay reagents; and the presence in the assay reagents of albumin, which binds T4 and increases T4 sequestration (33). Any of these factors might have been present in our study, but the last one is especially likely to have been responsible for an sBC-dependent bias since the T4-Eu tracer stock solution provided with the kit and the buffer used in sample dilution (DELFIA diluent I) contain albumin.
In the veterinary literature, only 1 ELISA (23) has been reported to show a lower concentration of fT4 when samples were diluted, but this fact was not referred to as an sBC-dependent bias. Since a very good correlation existed between the results with TR-FIA and ED in our study, apparently TR-FIA could be used to measure canine fT4 with the precaution of not diluting the samples. However, some methods with a high sBC-dependent bias have been reported to yield falsely low fT4 values in severely ill human patients with nonthyroidal conditions. On the other hand, some tests with this bias have shown results that have good agreement with those of ED (considered the reference or “gold-standard” method) in these patients (33). Therefore, the clinical implications and significance of this bias have not been clearly defined, and additional clinical studies should be done.
Concerning the interfering substances, the manufacturer of the DELFIA kits indicates that, for human serum samples, hemoglobin at a concentration of 5 g/L or less and bilirubin at a concentration of 30 mg/dL or less do not interfere with the assays, but triglycerides at a concentration above 500 mg/dL may cause variation in cortisol and fT4 concentrations. We observed that high hemoglobin concentrations (2 and 4 g/dL) significantly affected the cortisol determination with the DELFIA system; however, lower hemoglobin concentrations did not affect the assay. An ELISA showed that nonsignificant changes could be detected after the addition of a hemolysate at concentrations of 0.5 g/dL or less (higher concentrations were not tested) (18), which agrees with our results. The hemolysate produced a decrease in fT4 levels unrelated to the amount of hemoglobin added, as in the previous study (18), although the decreases were not significant. Unknown chemical interactions may have occurred between red cell components and assay reactants, causing the absence of correlation between percentage change and hemoglobin concentration. For this study we rejected a conventional method of lysing saline-washed red cells in distilled water since distilled water interfered with the assays, producing falsely high cortisol measurements (cortisol dilutions with uncorrected concentrations: 1:1, 687 nmol/L; 1:2, 513 nmol/L; 1:4, 546 nmol/L) and fT4 measurements. Therefore, hemolysis was produced by freezing red cells at −20°C.
Lipemia was demonstrated to negatively bias cortisol concentrations. Possible causes are the lipid-soluble nature of cortisol and inaccurate pipetting of lipemic samples because of their higher viscosity (29). Previous reports regarding the effect of lipemia on cortisol determination have contradictory results. An RIA showed that the addition of a 100% fat emulsion reduced the mean cortisol concentration in heparinized plasma by 12% (29), whereas an ELISA indicated a slight positive bias for cortisol levels with triglyceride addition (18). Our interferograph for fT4 exhibited an increase in concentrations in proportion to the triglyceride levels that could be anticipated by linear regression analysis, as previously described with an ELISA (18). Probably triglycerides prevent the binding between labelled cortisol and antibodies, causing low fluorescence and consequently high cortisol measurements.
Overall, the different results achieved depending on the species or method make it necessary to assess the effect of the interfering substances in each case, and therefore the data presented here will be valid only for the specified reagents and the VICTOR 1420 multilabel counter.
In conclusion, the DELFIA human cortisol kit has been demonstrated to be precise, accurate, sensitive, and specific for determination of the cortisol concentration in canine serum samples, and it could be used in veterinary clinical pathology laboratories as an alternative to ELISA. Bilirubinemic samples can be assayed without significant interference, but the results with lipemic and very hemolytic samples should be interpreted with caution since lipemic samples will underestimate the cortisol concentration and samples with a high hemoglobin content will overestimate it.
The DELFIA human fT4 kit has also shown good precision and accuracy and high sensitivity with canine serum samples, but the sBC-dependent bias indicates that results should be interpreted with caution until further studies can clarify this subject. Hemolysis could produce slight underestimation of fT4 concentrations, and increases due to lipemia can be predicted by linear regression analysis.
References
- 1.Peterson ME. Endocrine and metabolic disorders. In: Kirk RW, ed. Current Veterinary Therapy. IX. Small Animal Practice. Philadelphia: WB Saunders, 1986:963–982.
- 2.Dixon RM, Mooney CT. Evaluation of serum free thyroxine and thyrotropin concentrations in the diagnosis of hypothyroidism. J Small Anim Pract. 1999;40:72–78. doi: 10.1111/j.1748-5827.1999.tb03040.x. [DOI] [PubMed] [Google Scholar]
- 3.Larsson MG. Determination of free thyroxine and cholesterol as a new screening test for canine hypothyroidism. J Am Anim Hosp Assoc. 1988;24:209–217. [Google Scholar]
- 4.Feldman EC, Nelson RW. Hypothyroidism. In: Canine and Feline Endocrinology and Reproduction. Philadelphia: WB Saunders, 1987:55–90.
- 5.Peterson ME, Melian C, Nichols R. Measurement of serum total thyroxine, triiodothyronine, free thyroxine, and thyrotropin concentrations for diagnosis of hypothyroidism in dogs. J Am Vet Med Assoc. 1997;211:1396–1402. [PubMed] [Google Scholar]
- 6.Storch MJ, Marbach P, Kerp L. A time-resolved fluoroimmunoassay for human insulin based on two monoclonal antibodies. J Immunol Methods. 1993;157:197–201. doi: 10.1016/0022-1759(93)90087-n. [DOI] [PubMed] [Google Scholar]
- 7.Stenman J, Alfthan H, Stenman UH. Streptavidin–biotin based time-resolved immunofluorometric assay for direct measurement of high concentrations of human chorionic gonadotropin (hCG) J Immunol Methods. 1994;175:161–167. doi: 10.1016/0022-1759(94)90359-x. [DOI] [PubMed] [Google Scholar]
- 8.Tuomola M, Harpio R, Knuuttila P, Mikola H, Lövgren T. Timeresolved fluoroimmunoassay for the measurement of androstenone in porcine serum and fat samples. J Agric Food Chem. 1997;45:3529–3534. [Google Scholar]
- 9.Ogine T, Kohsaka T, Taya K. Time-resolved fluoroimmunoassay (TR-FIA) of porcine relaxin. Exp Clin Endocrinol Diabetes. 1999;107:276–280. doi: 10.1055/s-0029-1212112. [DOI] [PubMed] [Google Scholar]
- 10.Erkens JHF, Dieleman SJ, Dressendörfer RA, Strasburger CJ. A time-resolved fluoroimmunoassay for cortisol in unextracted bovine plasma or serum with optimized procedures to eliminate steroid binding protein interference and to minimize non-specific streptavidin–europium binding. J Steroid Biochem Mol Biol. 1998;67:153–161. doi: 10.1016/s0960-0760(98)00083-1. [DOI] [PubMed] [Google Scholar]
- 11.Degan P, Podesta A, Montagnoli G. Time-resolved fluoroimmunoassay. Mol Biotechnol. 1999;13:215–222. doi: 10.1385/MB:13:3:215. [DOI] [PubMed] [Google Scholar]
- 12.Adlercreutz H, Wang GJ, Lapcík O, et al. Time-resolved fluoroimmunoassay for plasma enterolactone. Anal Biochem. 1998;265:208–215. doi: 10.1006/abio.1998.2886. [DOI] [PubMed] [Google Scholar]
- 13.Lövgren T, Pettersson P. Time-resolved fluoroimmunoassay, advantages and limitations. In: Van Dyke K, Van Dyke R, eds. Luminescence Immunoassay and Molecular Applications. Boca Raton, Florida: CRC Press, 2000:233–253.
- 14.Jacobs RM, Lumsden JH, Grift E. Effects of bilirubinemia, hemolysis, and lipemia on clinical chemistry analytes in bovine, canine, equine, and feline sera. Can Vet J. 1992;33:605–608. [PMC free article] [PubMed] [Google Scholar]
- 15.Hemmilä I, Harju R. Time-resolved fluorometry. In: Hemmilä I, Stahlberg T, Mottran P, eds. Bioanalytical Applications of Labelling Technologies. Turku, Finland: 1995:83–119.
- 16.Ginel PJ, Pérez-Rico A, Moreno P, Lucena R. Validation of a commercially available enzyme-linked immunosorbent assay (ELISA) for the determination of cortisol in canine plasma samples. Vet Res Commun. 1998;22:179–185. doi: 10.1023/a:1006021221409. [DOI] [PubMed] [Google Scholar]
- 17.Tuomola M, Vainio J, Lövgren T. Rapid time-resolved immunofluorometric assay for the measurement of creatine kinase in serum and whole blood samples. J Agric Food Chem. 2002;50:6659–6662. doi: 10.1021/jf025629v. [DOI] [PubMed] [Google Scholar]
- 18.Lucena R, Moreno P, Pérez-Rico A, Ginel PJ. Effects of hemolysis, lipaemia and bilirubinemia on an enzyme-linked immunosorbent assay for cortisol and free thyroxine in serum samples from dogs. Vet J. 1998;156:127–131. doi: 10.1016/s1090-0233(05)80038-3. [DOI] [PubMed] [Google Scholar]
- 19.Reimers TJ, Cowan RG, Davidson HP, Colby ED. Validation of radioimmunoassays for triiodothyronine, thyroxine, and hydrocortisone (cortisol) in canine, feline, and equine sera. Am J Vet Res. 1981;42:2016–2021. [PubMed] [Google Scholar]
- 20.Reimers TJ, Salerno VJ, Lamb SV. Validation and application of solid-phase chemiluminescent immmunoassays for diagnosis of endocrine diseases in animals. Comp Haematol Int. 1996;6:170–175. [Google Scholar]
- 21.Ford EJH, Robinson IP, Evans J. An enzyme-linked immunoassay for the measurement of the concentration of cortisol in sheep plasma. Res Vet Sci. 1990;48:262–263. [PubMed] [Google Scholar]
- 22.Moriello KA, Halliwell REW, Oakes M. Determination of thyroxine, triiodothyronine, and cortisol changes during simultaneous adrenal and thyroid function tests in healthy dogs. Am J Vet Res. 1987;48:458–462. [PubMed] [Google Scholar]
- 23.Thorensen SI, Wergeland R, Morkrid L, Stokke O. Evaluation of an enzymatic immunoassay for free thyroxine determination in canine serum. Vet Res Commun. 1996;20:441–420. doi: 10.1007/BF00419178. [DOI] [PubMed] [Google Scholar]
- 24.Jensen AL, Hoier R, Pedersen HD. Evaluation of an enzyme linked immunosorbent assay for the determination of free thyroxine in canine samples assisted by data on biological variation. J Vet Med A 1993;40:1–7. OR Zentralbl Veterinarmed A 1993;40:539–545. [DOI] [PubMed]
- 25.Paradis M, Pagé N, Larivière N, Fontaine M. Serum-free thyroxine concentrations, measured by chemiluminescence assay before and after thyrotropin administration in healthy dogs, hypothyroid dogs, and euthyroid dogs with dermathopathies. Can Vet J. 1996;37:289–294. [PMC free article] [PubMed] [Google Scholar]
- 26.Behrend EN, Kemppainen RJ, Young DW. Effect of storage conditions on cortisol, total thyroxine, and free thyroxine concentrations in serum and plasma of dogs. J Am Vet Med Assoc. 1998;212:1564–1568. [PubMed] [Google Scholar]
- 27.Diamandis EP, Bhayana V, Conway K, Reichstein E, Papanastasiou-Diamandis A. Time-resolved fluoroimmunoassay of cortisol in serum with a europium chelate as label. Clin Biochem. 1988;21:291–296. doi: 10.1016/s0009-9120(88)80083-3. [DOI] [PubMed] [Google Scholar]
- 28.Kemppainen RJ, Peterson ME, Sartin JL. Plasma free cortisol concentrations in dogs with hyperadrenocorticism. Am J Vet Res. 1991;52:682–686. [PubMed] [Google Scholar]
- 29.Lee DE, Lamb SV, Reimers TJ. Effects of hyperlipemia on radioimmunoasssays for progesterone, testosterone, thyroxine, and cortisol in serum and plasma samples from dogs. Am J Vet Res. 1991;52:1489–1491. [PubMed] [Google Scholar]
- 30.Nelson RW, Ihle SL, Feldman EC, Bottoms GD. Serum free thyroxine concentration in healthy dogs, dogs with hypothyroidism and euthyroid dogs with concurrent illness. J Am Vet Med Assoc. 1991;198:1401–1407. [PubMed] [Google Scholar]
- 31.Eckersall PD, Williams ME. Thyroid function tests in dogs using radioimmunoassay kits. J Small Anim Pract. 1983;24:525–532. [Google Scholar]
- 32.Ekins R. Analytic measurements of free thyroxine. Clin Lab Med. 1993;13:599–630. [PubMed] [Google Scholar]
- 33.Sapin R. Serum thyroxine binding capacity-dependent bias in five free thyroxine immunoassays: assessment with serum dilution experiments and impact on diagnostic performance. Clin Biochem. 2001;34:367–371. doi: 10.1016/s0009-9120(01)00241-7. [DOI] [PubMed] [Google Scholar]


