

Abstract
Glial dysfunction outraging CNS plasticity and integrity results in one of the most dangerous cancers, namely glioma, featuring little median survival period and high recurrence. The hallmark properties of proliferation, invasion and angiogenesis with the infiltrated macrophages in glioma are expected to be tightly coupled or cross-linked, but not properly related so far. The present study is aimed to find a relationship between this featured quadrangle from lower to higher grades (HG) of post-operative glioma tissues and their invading subsets. Elevated Ki67-associated proliferation in lower grades (LG) was supported with VEGF dependent angiogenic maintenance which found a decrease unlikely in HG. In contrast, MMP 2 and 9-associated invasions augmented high in HG with the dominant presence of CD204+ M2 polarized macrophages and a general increase in global DNMT1-associated methylation. Marked differences found in ECM invading cellular subsets of HG showing high proliferative capacity indicating rationally for recurrence, contrasting the nature of gross tumor tissue of the same grade. Thus in LG, the neoplastic lesion is more inclined to its growth while in higher grade more disposed towards tissue wreckage in support with cellular environmental milieu whereas the cellular variants and subsets of invaded cells showed different trends. Therefore, some operational dichotomy or coupling among cellular variants in glioma is active in determining its low- to high-grade transition and aggressive progression.
Supplementary Information
The online version contains supplementary material available at 10.1007/s10571-021-01096-1.
Keywords: Glioma, Proliferation, Invasion, Angiogenesis, GAM, Dichotomy
Introduction
Glioma, the cancer of glial cells, is the most common type of primary intracranial neoplastic lesion, representing a majority of brain tumor malignancies with minimal prognostic efficiency. Due to high invasiveness, they show poor prognosis, making the medial survival of 12–15 months post-detection (Ostrom et al. 2014). If the fundamental features of a neoplastic growth are analyzed, we find that several features like sustaining proliferation, resisting cell death, replicative immortality, etc. are connected with tumor growth property and others like invasion, metastasis, and angiogenesis are related to its motility or spreading (Hanahan and Weinberg 2011). Basically, the proliferative and viability circuit of cancer coupled with its motility vigor determines the deadliness of any neoplasm, and evidences are pointing to the crucial roles of the tumor microenvironment as well as inflammatory involvement in molding the aggressive nature of any cancer (Gajewski et al. 2013; Stuelten et al. 2018; Nallanthighal et al. 2019). Glioma, being one of the deadliest among the neoplastic spectrum, possesses high invasiveness propelled with immune-inflammatory association along with its higher proliferation (Friedmann-Morvinski 2014; Ghosh et al. 2017). In course of gliomagenesis, the neoplastic cells proliferate randomly and rapidly, that is ‘Grow’, while reinforcing with nutrition and gaseous supply by neo-angiogenesis and simultaneously invade to re-colonize at newer areas as ‘Go’ by degrading surrounding tissues, basement membrane of blood vessels and myelinated nerve fibers (Rao 2003; Louis 2006). Thus glioma progression can be restructured into two vectors: the ‘Go’ and ‘Grow’. The hypothesis suggests highly migrating glioma cells show lesser proliferative nature and vice versa giving birth to the “Go versus Grow dichotomy” (Giese et al. 2003; Saut et al. 2014).
In Glioma, matrix metalloproteinases (MMPs), different serine/cysteine proteases have an important contribution for invading the surrounding tissue. Among them, MMP 2 and MMP 9 are categorized as gelatinase, which are reported to have prominent roles with increasing glioma grades and directly correlated with cell migration and invasion (Wild-Bode et al. 2001; Ramachandran et al. 2017). In contrast to this phenomenon of invasion or ‘Go’, the ‘Grow’ or proliferation has been widely identified with Ki67 which in some cases reported increasing with glioma grading, but few contradicting observations showed its over-expression in grade II or lower grades (LG) (Yuan et al. 2013; Ramachandran et al. 2017; Xue et al. 2017). Such two basic features are perceptibly coupled with angiogenesis and intrusion of macrophages at glioma site and inflammation (Hanahan and Weinberg 2011; Murat et al. 2009; Matias et al. 2018). It is also found that the magnitude of macrophage presence and glioma grades are positively correlated which have shown possible involvement of M2 macrophages/microglia (Komohara et al. 2008; Gieryng et al. 2017). So the heterogeneity of the glioma microenvironment, though complexly regulated by different stakeholders, has been divided into two fundamental driving urges of the neoplastic tissue i.e., ‘grow’ and ‘go’ with associated angiogenic support and with an obvious neighborhood of glioma-associated microglia/macrophage (GAM) population. The interrelation of mentioned featured quadrangle had been investigated to detect whether such dichotomy does exist in real patient glioma samples or balanced in some other ways.
The phenomena in low and high grade of astrocytoma with post-operative human glioma tissue samples had been tried to characterize over the whole tissue, surviving cells in culture and isolated cells passing through mimicked Extracellular Matrix (ECM) condition as invading subtypes. Moreover, association of angiogenic property, brain macrophage/microglia, and their polarization status along with incurring epigenetic changes in terms of global methylation have also been compared from lower to higher grade transition of glioma. The present investigation is aimed to find a relationship between the featured quadrangle of proliferation-invasion-angiogenesis-inflammation by studying characteristic marker expression at different levels from lower to higher grades (HG) of post-operative glioma tissues and their invading subsets. Such a holistic approach on these basic features of glioma would probably bring a newer insight on glioma progression in patients which may open up some better prognostic approaches.
Materials and Methods
Patient Samples and Grading
The post-operative crude neoplastic tissue fractions were collected from Bangur Institute of Neurosciences, Institute of Post Graduate Medical Education and Research (IPGME&R), Kolkata, India as per institutional ethical clearance (vide Memo No. Inst/IEC/553 dated 15.01.2014) after the surgery and fixed in selective mediums as per methodological requirements. Relevant clinical details and data of Magnetic Resonance Imaging (MRI) done with 1.5 T multi-sliced MR imager with T1 & T2 weighted contrast enhanced parameters along with MR spectroscopy values on choline/creatine ratio, N-acetyl aspartate(NAA) and lactate peaks had been collected. All glioma samples were primarily of adult, pediatric and recurring types from which only the adult non-recurring glioma tissues of six (n = 6) low grade [astrocytoma grade II] and five (n = 5) high grade [anaplastic astrocytoma or grade III and glioblastoma multiforme or GBM or grade IV] samples were included in the study. The pathological grading of post-operative tissues was done by collaborating histopathology department of IPGME&R according to WHO 2007 and 2016 protocol. All the parameters were performed for all samples unless otherwise mentioned in figure legends. Therefore, the sample size in low-grade (LG) is n = 6 and in high-grade (HG) it is n = 5. All experiments had been done at least in duplicate.
Tissue Immunohistochemistry with Hematoxylin Counter-Staining
Tissues fixed in 4% paraformaldehyde embedded in paraffin blocks were processed as 10 µm thick tissue ribbons and fixed in glass slides. De-paraffinized, gradually hydrated with descending alcohol grades, phosphate buffer saline (PBS) washed and blocked by 3% Bovine Serum Albumin (BSA) solution (LOBA Chemie, India) for 30 min followed by overnight incubation of primary non-conjugated human reactive rabbit monoclonal anti-Ki67 (Santacruz Biotechnology, Dallas, TX, USA) overnight at 4 °C moist chamber. Slides washed in PBS were treated with Horse Raddish Peroxidase (HRP)-conjugated rabbit reactive mouse secondary antibody (Santacruz Biotechnology, Dallas, TX, USA), treated with 3,3-diaminobenzidine (DAB) (SRL, India) in buffered (1 M TRIS, pH 7.4) hydrogen peroxide solution along with 0.5% copper sulfate solution in dark followed by counter-staining with Dellafield’s hematoxylin solution (Merck, India) and dehydrated in alcohol to reach in air-dried condition. A similar protocol was administered in detecting total methylation pattern in tissue level among high and low grade of astrocytomas using human reactive rabbit monoclonal DNA Methyl Transferase 1 (DNMT1) with HRP-conjugated mouse anti-rabbit secondary antibody (both from Santacruz Biotechnology, Dallas, TX, USA). Both the primary antibodies were added at 1:200 dilution and secondary added 1:500 dilution in 1% BSA solution. These slides mounted with DPX, were visualized in a bright field under Nikon Microscope (TS 100-F Eclipse, Nikon Corp., Japan), photographed with CCD Camera (DS-Fi2-U3), and analyzed with NIS Element-BR Software (Nikon Corp., Japan) for mitotic activity and epigenetic methylation attributes associated with these tumor types. In both the cases, photographs were being evaluated as their expression profiling using ‘Fiji_ImageJ2 software’ (NIH, USA).
Tissue Immunohistochemistry with Fluorescence Microscopy
Tissue samples fixed in glass slides as mentioned earlier and after overnight hit fixation, all samples were stained separately with—(1) primary non-conjugated human reactive mouse monoclonal anti-matrix metalloproteinase 2 (MMP2) antibody (Novus Biologicals, Littleton, CO, USA) counteracted by Fluorescent isothiocyanate (FITC)-conjugated anti-mouse goat secondary antibody (Abcam, Cambridge, MA, USA) to detect expression of total tissue gelatinase A (MMP2), (2) primary non-conjugated human reactive mouse monoclonal anti-matrix metalloproteinase 9 (MMP9) antibody (Novus Biologicals, Littleton, CO, USA) counteracted by phycoerythrin (PE)-conjugated anti-mouse goat secondary antibody (Abcam, Cambridge, MA, USA) to detect expression of total tissue gelatinase B (MMP9) both for invasion and ECM destruction in order to metastasis, (3) primary non-conjugated human reactive mouse monoclonal anti-vascular endothelial growth factor (VEGF) antibody (Novus Biologicals, Littleton, CO, USA) counteracted by PE-conjugated anti-mouse goat secondary antibody (Abcam, Cambridge, MA, USA) to detect expression of neo-angiogenesis, (4) primary non-conjugated human reactive mouse monoclonal anti-ionized calcium-binding adapter molecule 1 (Iba1) antibody (Abcam, Cambridge, MA, USA) counteracted by FITC-conjugated anti-mouse goat secondary antibody (Abcam, Cambridge, MA, USA) to detect distributional pattern of brain macrophage/microglia, (5) primary PE-conjugated human reactive CD204 mouse monoclonal antibody (BioLegend, San Diego, CA, USA) for detection of M2 polarized brain macrophage or microglia. Subsequently, all of these are counterstained with DAPI (Himedia, India). In all cases, 1:500 primary nonconjugated and 1:1000 primary or secondary-conjugated antibody dilution were used, incubated under dark humid chamber at 4 °C. 5% Fetal Bovine Serum (GIBCO, Life Technology, Grand Island, NY, USA) in 1X PBS with 0.25% Tween 20 (MERCK, India) solution had been used to block nonspecific bindings as well as to increase membrane permeability for cytosolic antibody binding. All the antibodies were diluted in 1% FBS (GIBCO, Life Technology, Grand Island, NY, USA) in 1X PBS solution. After mounting in DPX, the slides were viewed through ‘Nikon TS 100-F Eclipse’ microscope with epi-fluorescence attachment (Nikon Corp., Japan) using Epi-FL filter block B-2A green channel (Nikon Corp., Japan) for Alexa Fluor® 488/FITC, Epi-FL filter block G-2A red channel for PE (Nikon Corp., Japan) and UV filter for DAPI (Nikon Corp., Japan). Photographs of fluorescence stained cells were captured with CCD camera DS-Fi2-U3 (Nikon Corp., Japan), processed, analyzed and documented with ‘NIS Element BR’ software, version 4.20 (Nikon Corp., Japan).
Glioma Tissue Cell Suspension and Culture
Freshly ablated post-operative human astrocytoma samples were collected in serum-free culture medium maintaining aseptic condition and temperature of around 4ºC. Samples were readily minced treated with 0.25% Trypsin–EDTA solution (Sigma Aldrich, USA) and collagenase (HiMedia, India) with continuous agitation. Serum supplemented culture media added to stop the enzymatic process, passed through 70 µm nylon filter mesh (HiMedia, India) and filtrates were centrifuged at 1800 rpm for 3 min, pellets washed and dissolved in media and plated for culture in 1X Dulbecco’s Modified Eagle Medium (DMEM) supplemented with 15% FBS (MP Biomedicals, Santa Ana, CA, USA), 2% antibiotic–antimycotic solution (HiMedia, India) with use of B-27 cell supplement (GIBCO Life Technologies, USA) with 1.5 × 10⁶ seeding density in 60 mm cell culture dish (Greiner, Cellstar, Germany) and maintained under 37 °C-5% CO2 humidified incubator (New Brunswick, Eppendorf, UK). For sets of experiments, 2–3 days of cultured cells were taken, visualized under a bright field microscope, and prepared subsequently.
Immunocytochemistry (ICC) of Low- and High-Grade Astrocytoma Primary Culture
After 48 h of culture, the cells were washed and fixed in 4% paraformaldehyde and added with 5% FBS in PBS with 0.5% Tween-20 (SRL, India) for blocking and permeabilization. After washing, they are treated individually with: (1) mAb Ki67-FITC-conjugated antibody for total cell proliferation (2) MMP2 mAb (10)-PE (20) (3) MMP9 mAb (10)-FITC (20) for total gelatinase (4) VEGF (10)-PE (20) for neo-angiogenic endothelial expression as detailed in earlier methodologies. All the antibodies added with a dilution of 1:500 for primary and 1:700 for secondary and incubated for 1 h each at ambient temperature in dark, counterstained with DAPI, and observed under ‘Nikon TS 100-F Eclipse’ microscope with epi-fluorescence attachment (Nikon Corp., Japan) and captured with CCD camera DS-Fi2-U3 (Nikon Corp., Japan), processed, analyzed and documented with ‘NIS Element BR’ software, version 4.20 (Nikon Corp., Japan).
Cellular Invasion by Transwell Matrigel Assay in Boyden Chamber
Isolated cells from post-operative tumor tissue were plated at about 0.1 × 10⁶ seeding density in serum-free 1X DMEM over upper Boyden transwell chamber overlaid with tissue matrigel (Corning, USA) quarterly diluted with serum-free DMEM (Ritch et al. 2019). The lower chamber was filled with 1 × DMEM + 20% FBS + 2% antibiotic solution, and the preparations were kept at 37 °C-5% CO2 humified environment for 48 h. Then the media from lower parts were taken, centrifuged, and fixed with 4% paraformaldehyde for immunophenotyping vide flow cytometry (discussed later). Upper chamber withdrawn, fixed similarly, washed and treated with 100% methanol (SRL, India) and stained with 10% Giemsa and observed under bright field microscope and documented as mentioned earlier to estimate and compare the invaded cells among low and high grades of astrocytoma.
Cellular Immunophenotyping with Flow-cytometry (FC)
After 48 h of cultured cells were removed by accutase cell detachment solution (Sigma Aldrich, USA) followed by PBS wash and fixation by 4% paraformaldehyde for 15 min, washed, pellets were treated with permeabilizing blocking buffer (5% FBS in PBS + 0.5% Tween 20), kept for 45 min, washed thoroughly and incubated with: (1) Ki67-FITC-conjugated antibody for total cell proliferation (2) MMP2 (10)-PE(20) (3) MMP9 (10)-FITC(20) for total gelatinase (4) VEGF(10)-PE(20) for angiogenic endothelial expression (specification of mAb and conjugates were same as mentioned earlier). After respective incubation of 1 h each at ambient temperature in dark, pellets were washed, suspended in PBS and fluorescent readings were taken in BD FACS Verse (BD Biosciences, USA) and analyzed with ‘FACS Verse Suit 1.0’ (BD Biosciences, USA) with a calculation of median fluorescence intensity (MFI) for quantification. Same experimental protocols were followed for invading cells recovered from transwell matrigel assay in the Boyden chamber for identical parameters to compare with tumor whole tissue parameters.
Isolation of RNA from Tumor Tissue followed by cDNA Conversion
Total RNA was isolated using ‘AllPrep Isolation Kit’ (Qiagen, India) abiding by manufacturer’s protocol from 15 mg frozen tumor tissue of both high and low grade kept in ‘RNA later solution’ (Thermo Fischer, USA). Isolated RNA quantified in ‘Nanodrop’ (IMPLEN, Germany) at 260/280 optical density (OD260/280) where OD value ≥ 2 was taken. From these quantified RNA samples 50 ng RNA underwent cDNA conversion using ‘cDNA conversion kit’ (Biobharti Lifesciences, India) following the manufacturer’s protocol. cDNA was stored at—20 °C for future use.
Evaluation of mRNA Expression by Semi-quantitative Reverse Transcriptase PCR (RT-PCR)
The number of target gene parameters was evaluated by RT-PCR. Respective primers underwent PCR with previously isolated cDNA. The product sizes of the primers were calculated from ‘NCBI PCR PRIMER BLAST’ and their optimum annealing temperatures were determined by an array of gradient PCR runs. As per the cDNA primer sequences, CTCATCGCAGATGCCTGGAA (FP) and TTCAGGTAATAGGCACCCTTGAAGA (RP) for MMP2, ACGCACGACGTCTTCCAGTA (FP) and CCACCTGGTTCAACTCACTCC (RP) for MMP9, TGCAGATTATGCGGATCAAACC (FP) and TGCATTCACATTTGTTGTGCTGTAG (RP) for VEGF, TCCTTTGGTGGGCACCTAAGACCTG (FP) and TGATGGTTGAGGTCGTTCCTTGATG (RP) for Ki67, CCCCTGAGCCCTACCGAAT (FP) and CTCGCTGGAGTGGACTTGTG (RP) for DNMT1, GATGATGCTGGGCAAGAGAT (FP) and CCTTCAAATCAGGGCAACTC (RP) for Iba1, CTCCCCTTTTCCCCTTTCTG (FP) and ATCGAGGTCCCACTGGAGAAAGT (RP) for CD204, TCATGAAGTGTGACGTTGACATCCGT (FP) and CCTAGAAGCATTTGCGGTGCACGATG (RP) for β-actin as housekeeping & CAACGGATTTGGTCGTATTGG (FP) and GCAACAATATCCACTTTACCAGAGTTAA (RP) for GAPDH as housekeeping had been used (GAPDH used for qRT-PCR only; for all semi-quantitative PCR, β-actin used as internal control). PCR amplification was done using ‘PCR Green Master Mix’ (Promega, USA) in the ‘Surecycler 8800’ PCR machine (Agilent Technologies, USA). β-actin was taken as an internal control. The amplified products were run in 10% PAGE, stained in ethidium bromide (EtBr) solution (HiMedia), and photographed in a gel imager (Life technologies, USA). Further the different band intensities were quantified using ‘Fiji_ImageJ2’ software (NIH, USA), graphically plotted, and interpolated.
Quantification of mRNA Expression Level by Quantitative Real-Time PCR (qRT-PCR)
The Number of target gene parameters was evaluated by RT-PCR. Respective primers underwent PCR with already isolated cDNA. The product size of the primers was calculated from ‘NCBI PCR PRIMER BLAST’ and their optimum annealing temperatures were determined by array of gradient PCR runs as mentioned earlier. ‘SYBR Green I master mix’ (Agilent Technologies, USA) was used as the primary source of fluorescent along with ‘ROX’ (Agilent Technologies, USA) as null reference dye diluted in DEPC water (1:100) in ‘AriaMX Real-Time PCR cycler’ (Agilent Technologies, USA) with requisite forward and reverse primers, DEPC water, and cDNA. GAPDH used as internal housekeeping control. The amplification and melt curve were obtained along with Cq values by analyzing with ‘AriaMX Software v1.0’ (Agilent Technologies, USA). These Cq values had been plotted graphically. The lesser the Cq value, the greater will be the expression level.
Statistical Analysis
Both parametric and nonparametric interpolation has been done comparing mean or median values with standard deviation (SD) using the ‘GraphPad InStat’ (GraphPad Software, San Diego, USA) taking significant one-tail or two-tail p value within 0.05.
Results
Proliferation Ability Goes Inverse from Low to High Grades and Variation Between Tissues to Cellular Sub-sets are Distinct
As evident both in immunohistochemistry (IHC) and immunofluorescence (IF) studies, the proliferative nature in terms of Ki67 expression found higher in LG to HG (Fig. 1a and d, respectively) which also seems to be coherent in immunofluorescence-based immunocytochemistry (IF-ICC) with the same proliferation marker (Fig. 1b). However, as far as the H/E histopathology and MRI data is concerned, hyper-cellularity and nuclear atrophy are highly visible in HG glioma and further supported by increased NAA and lactate peak in MR spectroscopy along with T2 enhanced midline shift in MRI (Fig. 1a). Hyper-atrophy nature of nucleus is also visible in IF-ICC in HG when stained with DAPI than LG (Fig. 1d). The LG tumor Ki67 mean intensity analyzed by H-DAB IHC was 180.82 ± 11.02 while in the case of HG the value was 40.32 ± 4.87 concerning significant attribution (p = 0.0001) and has been plotted graphically (Fig. 1c). This unique inverse relation of proliferation among low and high grades has also been supported both by semi-quantitative and qualitative RNA expression data when Ki67 used again as a target marker in RT-PCR and qRT-PCR, respectively (Fig. 1e and f, respectively). In RT-PCR, average mRNA expression in LG tumors found nearly many-fold higher with a significant p value (0.01) justifying the IHC result. Again the quantitative qRT-PCR showed low expression of Ki67 in terms of higher Cq value in HG tumors (28.86 ± 0.35) than in low grades (26.52 ± 1.01) showing a low Cq value with p value 0.03. As the expression and Cq value is inversely proportional, thus both RT-PCR and qRT-PCR showed increased mRNA expression of Ki67 in LG astroglial tumors than in HG. However, an unmatched scenario has been found when flow-cytometry data obtained from the isolated cultured cells of high and low grades of astrocytic tumors. The MFI procured from the cells of total whole tissue gave a higher FC-MFI value in LGs (52 ± 47.01) than the invaded cells through the matrigel where the MFI value showed 23.66 ± 11.89 depicting low nature of proliferation in invaded sub-types of LG. On the other hand, the MFI value of invaded sub-type of HG sharply rose to 474.33 ± 285.51 compared to its total tissue counterpart (average MFI value is 232.33 ± 111.13). This change of proliferative nature among LG and HG tumors related to their whole tissue and invaded sub-types yields a significant (p = 0.04) level of changes depicting differential nature of proliferation skill of whole tissue glioma cells and their invading subtypes (Fig. 1g).
Fig. 1.

a Hematoxylin-Eosine (H/E) stained histopathology (× 400) shows increasing hypercellularity and distortion of the cellular matrix (black arrow) in LG and HG glioma. Respective T2 weighted MRI images [inset] are showing the lesions (red arrow). Hyper-expressive areas with H-DAB Ki67 IHC have been seen in LG gliomas more dominantly than HG gliomas. b Immunocytochemistry (ICC) with Ki67-FITC and DAPI also showing hyperexpression of the said proliferative marker in LG (red arrow). c Graphical plot of Ki67 mean intensity found in H-DAB Ki67 IHC with p value of 0.0001 depicts significant higher expression in LG. d Whole tissue IF-IHC with Ki67-FITC and DAPI (× 400) also points out a higher level of proliferation in LG (red arrows). e cDNA band expression (extreme left) of RNA transcript of Ki67 suggests hyperexpression (middle) with p value of 0.01 in LG tumors. f Lower Cq value found in qRT-PCR in LG tumors denotes hyper expression of Ki67 as a proliferation marker. g MFI values (p = 0.04) of Ki67 found in LG and HG whole tumors and their invaded cohorts—Ki67 expression in whole tumor tissue of LG is higher, however, the invaded cells of HG show high shoots of the expression compared to its whole tissue cell type
Gelatinase as a Microinvasive Factor Maintains Strategic Increase from Low to High Grades but Varied in Cellular Sub-sets
MMP2 and MMP9, the two predominant gelatinases, playing important role in microinvasion or metastasis and degrading ECM causing much lethality have been evaluated. Both immunofluorescence-based histochemistry (IF-IHC) and cytochemistry (IF-ICC) show an increased level of expression of both the MMPs along with the increasing grades (Fig. 2a and b, respectively) which gets further support from Boyden chamber assay giving higher counts of invaded cells of 49.66 ± 6.34 in HG than LG depicting the average count value of 15.33 ± 2.62 (p = 0.002). The semi-quantitative (RT-PCR) RNA expression of both MMP2 and MMP9 also showed a very significant elevation of gelatinase expression in high grades than low grades (Fig. 2c). The mRNA expression in terms of cDNA band intensity values were 4246.48 ± 65.68 and 3794.05 ± 121.96 in ‘ImageJ’ analysis for MMP2 and MMP9 for HG, respectively, with respective significant p values of 0.0009 and ˂0.0001. Whereas in LG tumors MMP2 and MMP9 expression depicted as 1607.83 ± 414.52 and 1550.83 ± 146.46, respectively. This further got support from the real-time PCR giving lower Cq value of 27.89 ± 0.35 and 25.51 ± 0.55 for MMP2 and MMP9, respectively, in high grades (higher the expression) in terms of both the gelatinases than the LG (30.11 ± 0.67 and 27.73 ± 0.65, respectively, for MMP2 and MMP9) with p values 0.01 and 0.02, respectively, under the restricted degree of significance of 0.05 (Fig. 2d). Again the grades and cohorts of astrocytic tumors when compared in flow cytometric study taking their MFI, a slight change had been witnessed among the LG tumors within their total and invaded subtypes where expression slightly lowered in LG invaded subtypes (MFI value 207 ± 150.23) than whole tissue (MFI value 363.66 ± 148.60) and in HG groups, expression slightly increased in invaded types ranging it to 154.66 ± 102.29 compared to the HG whole tissue type where MFI value is 120.66 ± 92.90 (Fig. 2e). These results showed the MMP2 and MMP9 expression increases in higher grade glioma tissue environments with mild inverse trends found in invaded cellular subtypes.
Fig. 2.

a Whole tissue IF-IHC with MMP2-FITC and MMP9-PE contrasted with DAPI (marked with sky blue arrow) suggests increasing expression of both the gelatinases from LG to HG (× 400). The transwell assay also shows a higher number of invaded cells in HG than LG with a significant p value of 0.002 (after 24 h from overlay). b Concurrent higher expression was found in HG tumors in ICC with MMP2-FITC and MMP9-PE along with DAPI (marked with sky blue arrow) (× 400). c Quantitative RNA expression of both the MMP2 and MMP9 shows higher expression in HG than in LG tumors taking β-actin as housekeeping gene with very significant expression profiling (p value is 0.0009 and less than 0.0001, respectively). d Both MMP2 and MMP9 qPCR data shows low Cq values in high grades depicting hyper-expression than low grades (p value 0.01 and 0.02, respectively). e In MFI expression using MMP2-PE and MMP9-FITC, the changes are visible among total and invaded cells. In MMP2, the MFI found in the LG whole tissue cell is higher than invaded sub-type; while in HG, MMP2 expression is higher in invaded sub-type than the whole tissue cell. On the other hand, MMP9 expression also shows similar expression as in LG, the invaded type shows lower expression than whole tissue, while a slight increase in MMP9 expression has been witnessed in invaded cells of HG than its whole cell counterpart (p ≥ 0.05)
VEGF as a Neo-angiogenic Factor is not Concurrent with Glioma Grades
Neo-angiogenesis is essential to sustain tumors and one of the predominant neoangiogenic markers in glioma is VEGF. The expression of VEGF in whole tissue IF-IHC and cellular IF-ICC noted higher expression of the marker in LG glioma than their HG counterparts (Fig. 3a, b). Significant RNA level expression has also been witnessed as the RT-PCR followed by cDNA band expression. In low grades, the expression of VEGF mRNA was 1.5 times higher compared to the high grades that were coherent with proliferation in low grades than high grades which has been plotted marking the increased expression in low grades with the significant result (p = 0.02) (Fig. 3c). Moreover, qualitative RNA expression also followed the same trend (Fig. 3d) where Cq value in LG seemed marginally lower of 28.08 ± 0.60 compared to HG tumors (29.35 ± 0.38), indicating higher mRNA expression for VEGF in LG with a similar significant difference level (p = 0.02) found previously in RT-PCR. All of these analytical cues hinted toward some correlations among the levels of proliferation and rates of neo-angiogenesis. This notion had also been supported by flow cytometry very clearly where a high level of cellular expression of VEGF in terms of MFI had been seen in whole tissue of LG (709 ± 454.12) and HG (240 ± 120.54). But there were no significant differences in VEGF expression among the invading subtypes of glioma cells isolated from LG (308.66 ± 222.58) and HG (337 ± 330.37) neoplastic tissue samples (Fig. 3e).
Fig. 3.
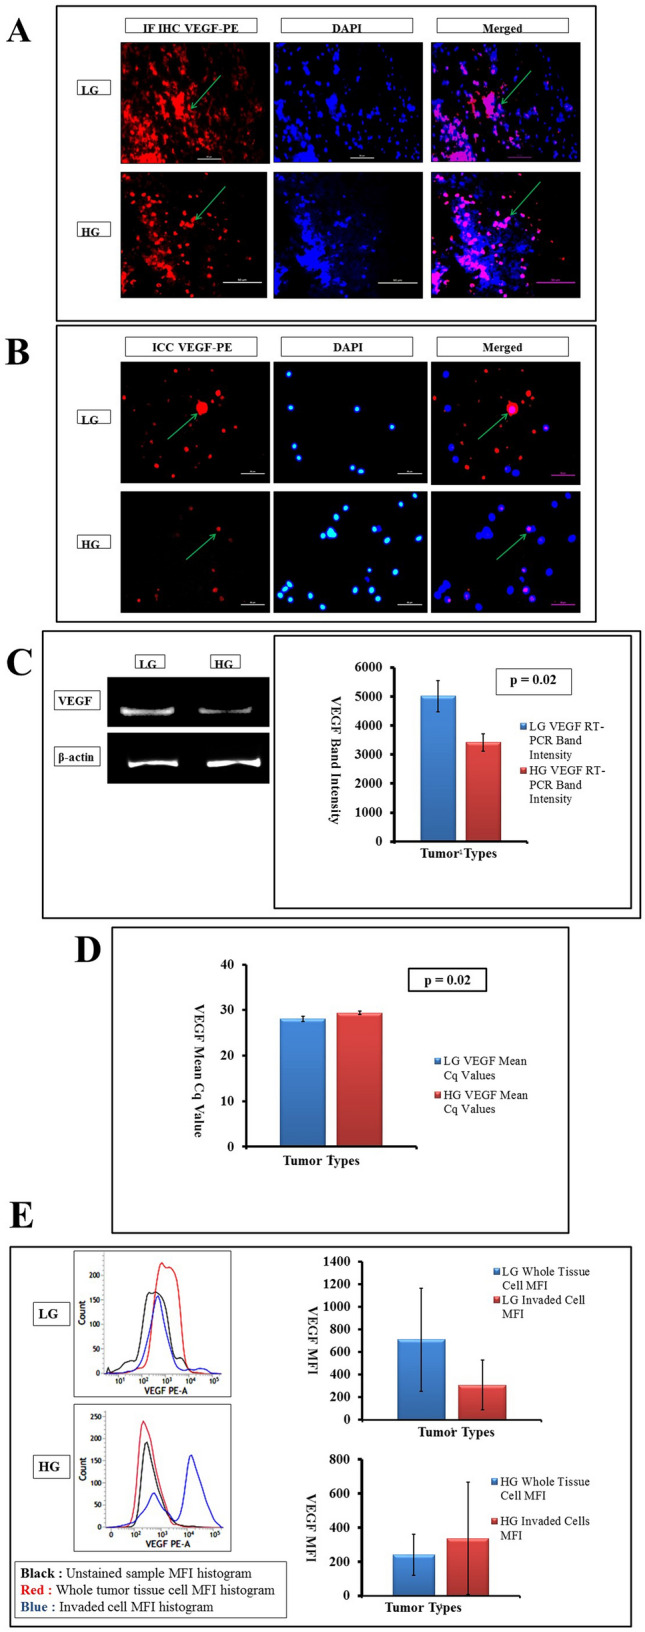
a Whole tissue IF-IHC with VEGF-PE and DAPI (× 400, marked with green arrows) shows an increased level of neoangiogenic expression in LG rather than HG. b ICC with isolated cells from tumor tissue also show an increased level of VEGF expression (× 400, marked with green arrows) in LG tumors than their HG counterparts. c cDNA gel band expression taking VEGF as target and β-actin as housekeeping, depicts a higher level of capillary sprouting in LG tumors with p value of 0.02. d RNA expression by qRT-PCR suggests a high Cq value in HG tumors indicating their lower level of neoangiogenic ability than LG tumors (p = 0.02). e MFI of VEGF in flow-cytometry is concurrent with proliferation. In LG tumors, the expression is higher in whole tissue cells than the invaded counterparts; while in HG tumors, the level of angiogenic expression is higher in invaded cells than in whole tissue cells (p ≥ 0.05)
Accumulation of Microglia/Macrophage and Alteration of Phenotype with Glioma Grades
Uncontrolled cellular changes in the tumor microenvironment are also equipped with the association of immune cells. Aggregation of highly debated association of brain macrophage or microglia had been addressed at the tissue, cell, and genomic level. As the tumor grade increased, the macrophage number steadily increased in terms of Iba1 expression at the tissue level as depicted vide IF-IHC (Fig. 4a). The cDNA band expression of Iba1 value of 8938.85 ± 245.09 was bit higher in high grades compared to a lower one (8170.53 ± 319.21) with p value at 0.02 (Fig. 4b) showing a marginal overall increase of glioma-associated microglia/macrophages in HG. In contrast, for M2 microglia/macrophages denoted by CD204, the expression was found drastically higher in HG tumors (7782.93 ± 1026.14) compared to LG (2003.91 ± 820.36) showing about fourfold increase of M2 phenotype maker (p = 0.001). This overall increase of glioma-associated microglia/macrophage and high association of pro-tumorigenic M2 phenotype with increasing grades of astrocytoma is shown in Fig. 4b. The quantitative Iba1 mRNA expressional analysis in term of Cq was also showing a similar result (24.5 ± 0.45 in HG and 26.31 ± 0.33 in LG), though the increase of M2 phenotype show marginal differences with CD204 Cq having a lower value of 23.42 ± 0.38 in HG compared to the LG Cq value 24.58 ± 0.40 (p = 0.04) (Fig. 4c). This had given a clear indication of the higher presence of microglia/macrophages and their phenotype in higher glioma grades.
Fig. 4.

a The pan-microglia marker Iba1 with FITC (red arrow) and M2 polarized glioma-associated macrophages (GAM) marker CD204 with PE (green arrow) has been countered with DAPI (merged figures with white arrow) as IF-IHC is giving an elevated level of expression of both the markers from LG to HG of tumors. b RT-PCR study in term of band expression shows a steep level of increase in CD204 expression in high grades (extreme left and extreme right with p = 0.001) than the rise found in Iba1 RNA expression that also has shown moderate elevation in HG tumors than LG (p = 0.02) taking β-actin as the housekeeping gene. c In qRT-PCR, both Iba1 as well as CD204 finishes with low Cq value in high grades depicting their hyperexpression in the same with significant p values of 0.008 and 0.04, respectively
Increased Methylation Level Depicted Increased Epigenetic Alterations in Higher Grades
Epigenetic associations are considered to be one of the futile players in the up-bringing of the tumor. In our present context, the overall level of methylation had been addressed using DNMT1 as marker. Both the H-DAB and IF-IHC showed a higher level of DNMT1 expression in HG of astrocytoma than LG; moreover, the intensity found from H-DAB IHC had been plotted graphically (p = 0.02) where the DNMT1 mean intensity was 50.35 ± 2.45 in LG which was much low compared to 108.48 ± 23.83 in HG (Fig. 5a). The cDNA expression of extracted RNA also gave higher band intensity in high grades. The experimental outcome suggested a high level of methylation in HG (21,281.15 ± 4201.39) compared to LG (5496.42 ± 186.61) (p < 0.05) in terms of the band intensity of DNMT1 (Fig. 5b). Furthermore, a low Cq value of 23.78 ± 0.43 yielded from high grades of tumor in comparison to the Cq value of 25.33 ± 0.59 in LG (p < 0.05) also qualitatively suggested higher expression of DNMT1 in HG than in LG (Fig. 5c).
Fig. 5.

a Both the H-DAB IHC (× 100) and IF-IHC with DNMT1 (with PE-conjugate at 400 ×) methylation marker in whole tumor tissue indicates higher expression of methylation in HG than LG. Plotted mean intensity expression from H-DAB IHC shows the same result with p value of 0.02. b cDNA expression of RNA from both grades also shows elevated expression of methylation induced by DNMT1 in HG tumors (p = 0.006). c Real-time gene expression in qRT-PCR also denotes a lower Cq level in HG DNMT1 expression in comparison to LG counterparts with a significant p value of 0.04
Discussion
The tumor is presently considered not only as a mass of cells but a heterogeneous tissue-organ-system comprising various other intermingling cells (Egeblad et al. 2010). This characteristic is appropriate for the deadly glioma with minimal median survival and such heterogeneity exists in its tissue architecture and assemblage through the grades holistically (Louis et al. 2016; Friedmann-Morvinski 2014). With the patient samples of glioma grouped as LG and HG we observed the mentioned principal characteristics of glioma tissue into ‘grow’ and ‘go’ vectors with the presence of glioma-associated macrophages/microglia (GAM) on a general epigenetic background marker to understand how such features go concurrently in transforming LG to HG of glioma.
Recent evidence suggested that GAM is highly interactive and influentially alters the micro-environmental status and progressive behavior in glioma by influencing angiogenic and invasive properties in glioma. Such association of microglia and infiltrated macrophage with M2 phenotypes expressing CD163+, CD204+ or CD206+ has been found related to the aggressive behavior and poor prognosis (Miyasato et al. 2017; Sørensen et al. 2018; Matias et al. 2018). GAM was found abundant with increasing grades and correlated with hypoxia inducible factor (HIF) and matrix metalloproteases (MMPs) family members like MMP 2, 9, and 14 controlling its aggression and invasiveness (Rao 2003; Lettau et al. 2010; Hagemann et al. 2012; Ghosh et al. 2017). Concerning HIF during glioma growth, its sustenance is induced by VEGF by promoting angiogenesis, vascular permeability, contributing in the formation of the immunosuppressive microenvironment by inhibiting dendritic cell (DC) maturation and expressing death receptor PD-L1 (Miki et al. 2012; Xue et al. 2017). So vascular permeability, in turn, increases the access of GAM into the tumor microenvironment and secreting IL-6, IL-10, TGF-β, EGF, VEGF, MMP 2, 4 and 9, where CX3CR1 or CCR2, etc. influencing their movement receiving glioma secreting CX3CL1, CCL2, etc., hence producing a vicious spiral of glioma-GAM carnage (Ghosh and Chaudhuri 2010; Zhang et al. 2012; Ferrer et al. 2018; Matias et al. 2018). Therefore, dangerously growing glioma causing massive CNS tissue architectural destruction in HG possesses multifaceted but interrelated mechanisms. Gradually the participating factors in this entangled process are being exposed with their functions in the transformation from LG to HG of glioma. In this scenario, the proliferation-invasion arms of glioma growth have shown some Yin-Yang features with tentative variations in their invading subsets.
The tumor growth when measured with proliferative features among the samples of LG to HG gliomas using one of the most widely used proliferation markers Ki67, high proliferative rates observed among both groups, but remarkably higher proliferative potency was observed in LG than the HG samples. Such observation was cross-checked for whole glioma tissue samples using multiple technical approaches to document the fact at cellular protein and mRNA level expression finding a similar trend with some deviation in magnitude (Fig. 1). But selective cells in 2–3 days culture from LG tissue samples showed less Ki67 protein expression in flow cytometry than HG indicating consistency with existing observations where Ki67 manifestation rises with glioma grades (Skjulsvik et al. 2014). In contrast, when invading cellular sub-types of both grades are compared with their parent populations in culture, invading glioma cells of LG were found less proliferative to its whole tissue culture survived cells; whereas, the invading cells from HG glioma are highly proliferative and even much higher than the high proliferative whole tissue culture survived cells of HG gliomas (Fig. 1g and 6). This disparity among the proliferative surge among the whole tissue, selective survived cells in culture, and their invading sub-sets are showing the heterogeneous properties of behavioral variants within the same glioma tissue indicating a clonal heterogeneity on behavioral pattern (Friedmann-Morvinski 2014).
Fig. 6.

Glioma Tissue and its cellular variants showing behavioral differences among grades. Schematic representation of the facts: a the whole tissue in lower-grade glioma shows higher proliferative urges where HG is more inclined towards tissue degradation and invasion. This higher proliferative impulse in lower-grade glioma mass is supported by angiogenesis. But the culture survived cells and invading cells of HG are highly proliferative in comparison to their LG counterparts. This has been generally supported by the angiogenic factors for invading cells but differs for culture survived cells. Therefore, differences exist among the cellular sub-sets and whole glioma tissue behavioral expression and a prominent dichotomy exists between proliferation coupled with angiogenesis and invasion, i.e., between ‘grow’ and ‘go’. b Overall data suggests that, on an increasingly perturbed epigenetic landscape LG of glioma tissue is more proliferative with all its cellular components by angiogenic funding, but higher grade glioma tissue is much damaging for the surroundings with a high presence of M2 polarized GAM; and with notable contrast, the invading cells of HGs are dangerously proliferative suggesting their intense drive to grow if entered in newer territories. [In this schematic diagram, the magnitude of inclinations and positions of the components are tentatively showing their trends in general.]
Growth by proliferation is not the only vector that makes glioma so dangerous, rather the aggressive invading property of it made the issue nearly invincible with recurrence particularly in HG. In a tumor niche, with proliferation, ECM degrading enzymes are pressed into service among which gelatinases like MMP2 and MMP9 are most predominant in glioma, which usually gets inactivated by TIMPs and gets activated once the condition arises controlling their cysteine switches and also having a cytokine-chemokine dependent axis of activation (Toth et al. 2003; Coniglio and Segall 2013; Zhang et al. 2012; Ferrer et al. 2018). Folds increase of both MMP2 and MMP9 expression are observed from LG to HG in glioma tissue at protein and mRNA level, indicating a highly aggressive and invading state at the tissue level as depicted in Fig. 2. But the scenario flipped when selective cells surviving in culture showed higher MMP expression for LG, which is remarkably an exact reverse behavior against proliferative potency as seen earlier (Fig. 6). Though such a reverse trend is observed for invading subsets of glioma cells between lower and higher cohorts of samples, the difference in invading potency is mild, particularly in comparison to proliferation. Therefore, the behavior of overall glioma tissue mass and selective behavioral subsets distinctly varies in their invading capacity, along with, showing a dichotomous relation for the ‘grow’ and ‘go’ vectors in growing glioma. To mitigate the discrepancy with whole tissue and its culture-sustained glioma cells or invading cell subsets, the role of other contributing cellular components including the candid role of GAM is expected crucial. They are capable of producing excessive MMPs in HG gliomas (Arcuri et al. 2017). Glioblastoma cells expressing CX3CL1 induce GAM recruitment through CX3CR1 receptors with the resultant increase in MMP 2, 9, and 14, thereby promoting an invading microenvironment for glioma surroundings (da Fonseca and Badie 2013; Ferrer et al. 2018). Differential expression of MMP9 along with the molecular subtypes of breast cancer had been reported (Pellikainen et al. 2004; Yousef et al. 2014) and such alternating subtypes are presumably factual for the astrocytic tumor in a more complex way as indicated through the observations.
Cellular proliferation is an energy-driven process requiring a high level of gaseous and nutritional supply through neoangiogenesis that is critically dependent upon oxygen tension sensed by various mechanisms, including NADPH oxidases, endothelial nitric-oxide synthase (eNOS), heme-oxygenases, and oxygen sensors that interface with the hypoxia-inducible transcription factor HIFα (HIF-1–3) family hetero-dimerizing with aryl hydrocarbon receptor nuclear translocator (HIFβ/ARNT) subunit (Semenza 2003; Ward 2008). In growing cancers, endothelial cells are vigorously active releasing several factors such as EGF, FGF, IL-8, prostaglandin E1 and E2, TNF-α, and VEGF, which can activate endothelial cell growth and motility where VEGF and bFGF are particularly important to tumor angiogenesis. In CNS astrocytes release various molecular mediators, such prostaglandins (PGE), nitric oxide (NO), and arachidonic acid (AA) influencing CNS blood vessel diameter and neo-angiogenesis where constantly secreting VEGF and allies from glioma cells promote its growth by recruiting GAM (Gordon et al. 2007; Rajabi and Mousa 2017; Arcuri et al. 2017). VEGF expression in the whole tumor tissue shows an overall decline from LG to HG as observed in IHC or in RNA level expression of the factor, where surviving cells from the whole sample culture also follows the similar trend (Fig. 3). This behavior of this whole sample VEGF is supporting the trend of Ki67 observed earlier and correlating angiogenesis with proliferation, but the disparity in angiogenic and proliferation marker for glioma tissue cells survived in culture may need further explanation involving other cellular components released factors, namely, astrocytes, epithelial cells or GAMs (Argaw et al. 2012; Osterberg et al. 2016; Rajabi and Mousa 2017; Arcuri et al. 2017). Interestingly, the invading cell in culture shows consistency in their VEGF expression, rather moderately increased VEGF is observed in HG associating its expression with high proliferative potency of those cells (Fig. 3 and 6), indicating their essential presence in the immediately invaded microenvironment where rapid proliferation require neo-angiogenic support to colonize and sustain. VEGF induces PI3K/Akt and Ras/MAPK mediated mitogenic pathway for growth of glioma cells, as well as, activation of MMPs for ECM remodeling as already established, thereby, mitigating both high proliferative urges of cells of HG glioma when invades in newer regions and associated MMP secretion in high amount from that tissue microenvironment in that phase (Wong et al. 2009; Xu et al. 2013).
The entire glioma milieu develops on a dynamic genetic contour and is controlled by various epigenetic gears that are participating from various cellular subsets of the tumor microenvironment. In recent times, such epigenetic controls are significantly contributing to understanding tumor biology for their ability to control gene expression levels as holistic or specific means by chromatin remodeling or RNA interference and strategically developing as markers to identify DNA methylation, histone modifications, chromatin remodeling, and microRNA for cancer development and progression (Nebbioso et al. 2018). DNA methylation was one of the earliest epigenetic markers in different cancers including glioma which are linked to control many genes like CDKN2A, TP53, TP73, MGMT, PTEN, Rb, TIMP3, MMP9, etc. as identified so far and may increase ROS which in turn activate DNMT for further methylation (Rajendran et al. 2011; Caffo et al. 2014; Rasime 2015; Ghosh et al. 2017). The present study showed a high increase of methylation pattern in glioma tissue of HG with clustered enhanced DNMT1 expression at protein levels which has also been reflected in mRNA production level, but here the difference is less (Fig. 5). Such epigenetic perturbation in HG has several mechanisms including the involvement of microRNAs like miR21, miR451, miR663, etc. secreting in glioma microenvironment and/or modulate both glioma cells and GAM involving AMPK, mTOR, or through TGFβ mediated MMP2, E-cadherin dependent microinvasion processes (Baraniskin et al. 2012; Li et al. 2016; Zhao et al. 2017). Also, the secreted extracellular vesicles (EVs) in the glioma microenvironment are derived from different cellular participant crosstalk and influence each other, and preliminary knowledge in such area indicates their role in controlling glioma aggressiveness and GAM polarization (Drago et al. 2017; Matias et al. 2018). Therefore, such epigenetic background and active influences from glioma microenvironment derived factors, as already described, not only facilitate the recruitment of microglia or macrophages in increasing numbers but also induce their polarization process. Such increased GAM with Iba1+ immune-phenotype has been observed with the predominant presence of CD204+ cells of M2 polarization for HG glioma samples (Fig. 4) similar to other studies (Komohara et al. 2008; Ghosh et al. 2016; Miyasato et al. 2017). This high presence of microglia/macrophages had long being designated with the increase or aggression of glioma where M2 polarized subsets are now considered to play the pivotal role in transforming glioma to HG features (Ghosh and Chaudhuri 2010; Wei et al. 2013; Matias et al. 2018). Evidence showed that hyper-activation of a subtype of M2 polarized GAM, designated as M2c, by tumor cell-secreted IL-10, TGF-β, and glucocorticoids subsequently act through STAT3, FIZZ1 or PPAR-γ mediated signaling pathways, which induces ECM digestion and tissue remodeling by the expression of versican, antitrypsin, gelatinase and pentraxin 3 and facilitate neo-angiogenesis, tumor growth, migration and invasion to an immunosuppressive microenvironment (Hambardzumyan et al. 2016; Orihuela et al. 2016).
So the interrelationship of mentioned features and predicted dichotomy does not go straight from LG to HG transition of glioma and cellular variants of tumor tissue come into play to the behavioral pursuit of glioma aggression. Overall, in an increasingly perturbed epigenetic landscape infested with myeloid lineage-derived innate immune cells that are mostly polarized towards M2 phenotype in LG and HG of glioma tissue microenvironment, the hallmark features of its aggression shows tissue and cellular subtype-specific variability or heterogeneity. When LG glioma is found to be inclined towards growth as marked by the increased expression of proliferation markers, HG glioma, in contrast, is more aggressive and invasive at the whole tissue levels (Fig. 6). But such trends get inversed when selective culture survived glioma cells are compared from both cohorts, where cells from HG found more proliferative and its invading subtypes possess the prolific capacity to grow, but the metastatic properties show the reverse trend for both the derived subtypes as schematically depicted in Fig. 6. Proliferative trends are highly supported by angiogenesis as shown by VEGF expression, however, higher contributions of other members in this process can be predicted as discussed previously. So the cellular behavior distinctly varies within the glioma microenvironment where a tissue level and cellular level dichotomy between ‘grow’ and ‘go’ exists, in which, a tissue level decision may not coincide with the cellular components of the organotypic tumor whole. Such glioma microenvironmental heterogeneity at the level of gene expression in a niche-specific manner has been under strict scrutiny in the present years to develop a better therapeutic strategy (Friedmann-Morvinski 2014; Perrin et al. 2019), but heterogeneity among behavioral subsets of cells from lower to higher grade glioma with dichotomous relation indicating a decision-making juncture may also be exploited for future prognostic measures. The present study in tumor samples also indicates the mathematical modeling predicting the switching of glioma to the invasive phenotype and migrating toward the adjacent brain, and switching back to proliferating cells may hold substantive factual evidence in real-time (Hatzikirou et al. 2012; Saut et al. 2014), however, further details on larger samples are required to establish any such dichotomy and switching. In this whole endeavor by glioma, its neoplastic cellular components, associated microglia/macrophage, astrocytes, epithelial cells with their products and varieties of ECM mediators play a great role where someone is hijacking and influencing others action and the triumph of glioma has made its way (Gieryng et al. 2017; Arcuri et al. 2017; Matias et al. 2018). Understanding the mode of action of cellular components and their operational dichotomy or coupling in this multifaceted dynamic glioma environment in lower to higher phase transition may provide additional insight for better therapeutic interventions to combat this deadly malaise.
Supplementary Information
Below is the link to the electronic supplementary material.
Supplementary file1 (TIFF 2376 KB) Supplementary Figure S1 72 hours primary glioma cell culture from patient samples of low and high-grade gliomas at ×1 DMEM with 15% FBS and 2% antibiotic medium at 37 °C, 5% CO2 humidified cell culture incubator. After successive washing with 1× PBS buffer, cells were used for an array of studies. Photographs are taken under phase-contrast light microscopy at ×400, TS 100-F Eclipse, Nikon Corp., Japan.
Acknowledgements
Acknowledging M.Ch students at Neurosurgery unit, BIN, IPGME&R for post-operative tumor samples, Dr. Ritesh Tiwari of BD-CoE Flow Cytometry unit at CRNN, University of Calcutta for immuno-flowcytometry experiments and analysis. Sincere gratitude to Prof. Asis Kumar Chattopadhyay and Ms. Soumita Modak, Department of Statistics, University of Calcutta for helping in statistical interpretation. Authors also thank Mr. Sanku Mondal and Mr. Abir Roy for their suggestions in preparing the figures for the manuscript.
Author Contributions
KG primarily performed the experiments as designed by AG, acquired and analyzed data and drafted the initial manuscript; SG provided post-surgical samples and MRI data; UC have done histopathological analysis; PB provided few experimental facilities to KG and mentored him; AG planned the whole work with acquisition of fund, mentored KG and supervised the whole work and experiments, analyzed data and finalized the manuscript draft.
Funding
This work was supported by the Council of Scientific and Industrial Research (CSIR), Government of India for financial aid vide Sanction No. 37(1587)/13/EMR-II dated 01.04.2013 to Anirban Ghosh as Principal Investigator (PI) for the work.
Data Availability
Data provided in the manuscript and if required further, will be provided by the first and corresponding authors.
Code Availability
NA.
Declarations
Conflict of interest
The authors declare that they have no known competing financial interests or personal relationships that could have appeared to influence the work reported in this paper.
Ethical Approval
Working with the post-operative human tumor samples, authors abide by patients’ consent proposal and Human Ethical Clearance (Memo No: Inst/IEC/553 dated 15.01.2014) from Institutional Ethical Committee (IEC) at Institute of Post Graduate Medical Education and Research (IPGME&R), Kolkata, West Bengal, India legally validating World Medical Association (WMA), Declaration of Helsinki.
Consent for Publication
NA.
Footnotes
Publisher's Note
Springer Nature remains neutral with regard to jurisdictional claims in published maps and institutional affiliations.
References
- Arcuri C, Fioretti B, Bianchi R et al (2017) Microglia-glioma cross-talk: a two way approach to new strategies against glioma. Front Biosci-Landmrk 22:268–309 [DOI] [PubMed] [Google Scholar]
- Argaw AT, Asp L, Zhang J et al (2012) Astrocyte-derived VEGF-A drives blood-brain barrier disruption in CNS inflammatory disease. J Clin Invest 122:2454–2468. 10.1172/JCI60842 [DOI] [PMC free article] [PubMed] [Google Scholar]
- Baraniskin A, Kuhnhenn J, Schlegel U, Maghnouj A, Zöllner H, Schmiegel W, Hahn S, Schroers R (2012) Identification of microRNAs in the cerebrospinal fluid as biomarker for the diagnosis of glioma. Neuro Oncol 14:29–33. 10.1093/neuonc/nor169 [DOI] [PMC free article] [PubMed] [Google Scholar]
- Caffo M, Caruso G, La Fata G, Barresi V, Visalli M, Venza M, Venza I (2014) Heavy metals and epigenetic alterations in brain tumors. Curr Genomics 15:457–463 [DOI] [PMC free article] [PubMed] [Google Scholar]
- Coniglio SJ, Segall JE (2013) Molecular mechanism of microglia stimulated glioblastoma invasion. Matrix Biol 32:372–380. 10.1016/j.matbio.2013.07.008 [DOI] [PubMed] [Google Scholar]
- da Fonseca ACC, Badie B (2013) Microglia and macrophages in malignant gliomas: recent discoveries and implications for promising therapies. Clin Dev Immunol. 10.1155/2013/264124 [DOI] [PMC free article] [PubMed] [Google Scholar]
- Drago F, Lombardi M, Prada I et al (2017) ATP modifies the proteome of extracellular vesicles released by microglia and influences their action on astrocytes. Front Pharmacol 8:910. 10.3389/fphar.2017.00910 [DOI] [PMC free article] [PubMed] [Google Scholar]
- Egeblad M, Nakasone ES, Werb Z (2010) Tumors as organs: complex tissues that interface with the entire organism. Dev Cell 18:884–901 [DOI] [PMC free article] [PubMed] [Google Scholar]
- Ferrer VP, Moura Neto V, Mentlein R (2018) Glioma infiltration and extracellular matrix: key players and modulators. Glia 66:1542–1565. 10.1002/glia.23309 [DOI] [PubMed] [Google Scholar]
- Friedmann-Morvinski D (2014) Glioblastoma heterogeneity and cancer cell plasticity. Crit Rev Oncog 19(5):327–336. 10.1615/critrevoncog.2014011777 [DOI] [PubMed] [Google Scholar]
- Gajewski TF, Schreiber H, Fu Y-X (2013) Innate and adaptive immune cells in the tumor microenvironment. Nat Immunol 14(10):1014–1022. 10.1038/ni.2703 [DOI] [PMC free article] [PubMed] [Google Scholar]
- Ghosh A, Chaudhuri S (2010) Microglial action in glioma: a boon turns bane. Immunol Lett 131:3–9. 10.1016/j.imlet.2010.03.003 [DOI] [PubMed] [Google Scholar]
- Ghosh K, Ghosh S, Chatterjee U, Chaudhuri S, Ghosh A (2016) Microglial contribution to glioma progression: an immunohistochemical study in Eastern India. APJCP 17(6):2767–2773 [PubMed] [Google Scholar]
- Ghosh K, Bhattacharjee P, Ghosh S, Ghosh A (2017) Glia to glioma: a wrathful journey. Adv Mod Oncol Res 3:96–113. 10.18282/amor.v3.i3.186 [Google Scholar]
- Gieryng A, Pszczolkowska D, Walentynowicz KA, Rajan WD, Kaminska B (2017) Immune microenvironment of gliomas. Lab Invest 97:498–518 [DOI] [PubMed] [Google Scholar]
- Giese A, Bjerkvig M, Behrens M, Westphal M (2003) Cost of migration: invasion of malignant gliomas and implication for treatment. J Clin Oncol 21:1624–1636 [DOI] [PubMed] [Google Scholar]
- Gordon GR, Mulligan SJ, MacVicar BA (2007) Astrocyte control of the cerebrovasculature. Glia 55:1214–1221 [DOI] [PubMed] [Google Scholar]
- Hagemann C, Anacker J, Ernestus RI, Vince GH (2012) A complete compilation of matrix metalloproteinase expression in human malignant gliomas. World J Clin Oncol 3(5):67–79 [DOI] [PMC free article] [PubMed] [Google Scholar]
- Hambardzumyan D, Gutmann DH, Kettenmann H (2016) The role of microglia and macrophages in glioma maintenance and progression. Nat Neurosci 19(1):20–27 [DOI] [PMC free article] [PubMed] [Google Scholar]
- Hanahan D, Weinberg RA (2011) Hallmarks of cancer: the next generation. Cell 144:646–674 [DOI] [PubMed] [Google Scholar]
- Hatzikirou H, Basanta D, Simon M, Schaller K, Deutsch A (2012) ’Go or grow’: the key to the emergence of invasion in tumour progression? Math Med Biol 29:49–65 [DOI] [PubMed] [Google Scholar]
- Komohara Y, Ohnishi K, Kuratsu J, Takeya M (2008) Possible involvement of the M2 antiinflammatory macrophage phenotype in growth of human gliomas. J Pathol 216:15–24. 10.1002/path.2370 [DOI] [PubMed] [Google Scholar]
- Lettau I, Hattermann K, Held-Feindt J, Brauer R, Sedlacek R, Mentlein R (2010) Matrix metalloproteinase-19 is highly expressed in astroglial tumors and promotes invasion of glioma cells. J Neuropathol Exp Neurol 69:215–223. 10.1097/NEN.0b013e3181ce9f67 [DOI] [PubMed] [Google Scholar]
- Li Q, Cheng Q, Chen Z et al (2016) MicroRNA-663 inhibits the proliferation, migration and invasion of glioblastoma cells via targeting TGF-beta1. Oncol Rep 35:1125–1134. 10.3892/or.2015.4432 [DOI] [PubMed] [Google Scholar]
- Louis DN (2006) Molecular pathology of malignant gliomas. Annu Rev Pathol Mech Dis 1:97–117. 10.1146/annurev.pathol.1.110304.100043 [DOI] [PubMed] [Google Scholar]
- Louis DN, Perry A, Reifenberger G et al (2016) The 2016 world health organization classification of tumors of the central nervous system: a summary. Acta Neuropathol 131:803–820 [DOI] [PubMed] [Google Scholar]
- Matias D, Balça-Silva J, da Graça GC et al (2018) Microglia/astrocytes–glioblastoma crosstalk: crucial molecular mechanisms and microenvironmental factors. Front Cell Neurosci 12:235. 10.3389/fncel.2018.00235 [DOI] [PMC free article] [PubMed] [Google Scholar]
- Miki T, Wada M, Kasumimoto T, Moriyama R, Iwasaki Y (2012) Modulation of immunity by antiangiogenic molecules in cancer. Clin Dev Immunol. 10.1155/2012/492920 [DOI] [PMC free article] [PubMed] [Google Scholar]
- Miyasato Y, Shiota T, Ohnishi K et al (2017) High density of CD204-positive macrophages predicts worse clinical prognosis in patients with breast cancer. Cancer Sci 108:1693–1700. 10.1111/cas.13287 [DOI] [PMC free article] [PubMed] [Google Scholar]
- Murat A, Migliavacca E, Hussain SF et al (2009) Modulation of angiogenic and inflammatory response in glioblastoma by hypoxia. PLoS ONE 4(6):e5947. 10.1371/journal.pone.0005947 [DOI] [PMC free article] [PubMed] [Google Scholar]
- Nallanthighal S, Heiserman JP, Cheon D-J (2019) The role of the extracellular matrix in cancer stemness. Front Cell Dev Biol 7:86. 10.3389/fcell.2019.00086 [DOI] [PMC free article] [PubMed] [Google Scholar]
- Nebbioso A, Tambaro FP, Dell’Aversana C, Altucci L (2018) Cancer epigenetics: moving forward. PLoS Genet 14(6):e1007362. 10.1371/journal.pgen.1007362 [DOI] [PMC free article] [PubMed] [Google Scholar]
- Orihuela R, McPherson CA, Harry GJ (2016) Microglial M1/M2 polarization and metabolic states. Br J Pharmacol 173(4):649–665 [DOI] [PMC free article] [PubMed] [Google Scholar]
- Osterberg N, Ferrara N, Vacher J et al (2016) Decrease of VEGF-A in myeloid cells attenuates glioma progression and prolongs survival in an experimental glioma model. Neuro Oncol 18:939–949. 10.1093/neuonc/now005 [DOI] [PMC free article] [PubMed] [Google Scholar]
- Ostrom QT, Bauchet L, Davis FG et al (2014) The epidemiology of glioma in adults: a “state of the science” review. Neuro Oncol 16(7):896–913. 10.1093/neuonc/nou087 [DOI] [PMC free article] [PubMed] [Google Scholar]
- Pellikainen JM, Ropponen KM, Kataja VV, Kellokoski JK, Eskelinen MJ, Kosma VM (2004) Expression of matrix metalloproteinase (MMP)-2 and MMP-9 in breast cancer with a special reference to activator protein-2, HER2, and prognosis. Clin Cancer Res 10:7621–7628 [DOI] [PubMed] [Google Scholar]
- Perrin SL, Samuel MS, Koszyca B et al (2019) Glioblastoma heterogeneity and the tumour microenvironment: implications for preclinical research and development of new treatments. Biochem Soc Trans 47:625–638 [DOI] [PubMed] [Google Scholar]
- Rajabi M, Mousa S (2017) The role of angiogenesis in cancer treatment. Biomedicines 5:34. 10.3390/biomedicines5020034 [DOI] [PMC free article] [PubMed] [Google Scholar]
- Rajendran G, Shanmuganandam K, Bendre A, Mujumdar D, Goel A, Shiras A (2011) Epigenetic regulation of DNA methyltransferases DNMT1 and DNMT3B in gliomas. J Neuro Oncol 104(2):483–494 [DOI] [PubMed] [Google Scholar]
- Ramachandran RK, Sørensen MD, Aaberg-Jessen C, Hermansen SK, Kristensen BW (2017) Expression and prognostic impact of matrix metalloproteinase-2 (MMP-2) in astrocytomas. PLoS ONE 12(2):e0172234. 10.1371/journal.pone.0172234 [DOI] [PMC free article] [PubMed] [Google Scholar]
- Rao JS (2003) Molecular mechanisms of glioma invasiveness: the role of proteases. Nat Rev Cancer 3:489–501 [DOI] [PubMed] [Google Scholar]
- Rasime K (2015) Epigenetics of glioblastoma multiforme. J Clinic Res Bioeth. 10.4172/2155-9627.1000225 [Google Scholar]
- Ritch SJ, Brandhagen BN, Goyeneche AA, Telleria CM (2019) Advanced assessment of migration and invasion of cancer cells in response to mifepristone therapy using double fluorescence cytochemical labelling. BMC Cancer 19:376. 10.1186/s12885-019-5587-3 [DOI] [PMC free article] [PubMed] [Google Scholar]
- Saut O, Lagaert JB, Colin T, Fathallah-Shaykh HM (2014) A multilayer grow-or-go model for GBM: effects of invasive cells and anti-angiogenesis on growth. Bull Math Biol 76(9):2306–2333 [DOI] [PubMed] [Google Scholar]
- Semenza GL (2003) Targeting HIF-1 for cancer therapy. Nat Rev Cancer 3(10):721–732 [DOI] [PubMed] [Google Scholar]
- Skjulsvik AJ, Mørk JN, Torp MO, Torp SH (2014) Ki-67/MIB-1 immunostaining in a cohort of human gliomas. Int J Clin Exp Pathol 7(12):8905–8910 [PMC free article] [PubMed] [Google Scholar]
- Sørensen MD, Dahlrot RH, Boldt HB, Hansen S, Kristensen W (2018) Tumour-associated microglia/macrophages predict poor prognosis in high-grade gliomas and correlate with an aggressive tumour subtype. Neuropathol Appl Neurobiol 44:185–206. 10.1111/nan.12428 [DOI] [PubMed] [Google Scholar]
- Stuelten CH, Parent CA, Montell DJ (2018) Cell motility in cancer invasion and metastasis: insights from simple model organisms. Nat Rev Cancer 18:296–312. 10.1038/nrc.2018.15 [DOI] [PMC free article] [PubMed] [Google Scholar]
- Toth M, Chvyrkova I, Bernardo MM, Hernandez-Barrantes S, Fridman R (2003) Pro-MMP-9 activation by the MT1-MMP/MMP-2 axis and MMP-3: role of TIMP-2 and plasma membranes. Biochem Biophys Res Commun 308:386–395 [DOI] [PubMed] [Google Scholar]
- Ward JP (2008) Oxygen Sensors in Context. Biochem Biophys Acta 1777:1–4 [DOI] [PubMed] [Google Scholar]
- Wei J, Gabrusiewicz K, Heimberger A (2013) The controversial role of microglia in malignant gliomas. Clin Dev Immunol. 10.1155/2013/285246 [DOI] [PMC free article] [PubMed] [Google Scholar]
- Wild-Bode C, Weller M, Wick W (2001) Molecular determinants of glioma cell migration and invasion. J Neurosurg 94(6):978–984 [DOI] [PubMed] [Google Scholar]
- Wong ML, Prawira A, Kaye AH, Hovens CM (2009) Tumour angiogenesis: its mechanism and therapeutic implications in malignant gliomas. J Clin Neurosci 16:1119–1130 [DOI] [PubMed] [Google Scholar]
- Xu C, Wu X, Zhu J (2013) VEGF promotes proliferation of human glioblastoma multiforme stem-like cells through VEGF receptor 2. Sci World J. 10.1155/2013/417413 [DOI] [PMC free article] [PubMed] [Google Scholar]
- Xue S, Hu M, Li P et al (2017) Relationship between expression of PD-L1 and tumor angiogenesis, proliferation, and invasion in glioma. Oncotarget 8:49702–49712 [DOI] [PMC free article] [PubMed] [Google Scholar]
- Yousef EM, Tahir MR, St-Pierre Y, Gaboury LA (2014) MMP-9 expression varies according to molecular subtypes of breast cancer. BMC Cancer 14:609. 10.1186/1471-2407-14-609 [DOI] [PMC free article] [PubMed] [Google Scholar]
- Yuan Y, Xiang W, Yanhui L et al (2013) Ki-67 overexpression in WHO grade II gliomas is associated with poor postoperative seizure control. Seizure 22:877–881 [DOI] [PubMed] [Google Scholar]
- Zhang J, Sarkar S, Cua R, Zhou Y, Hader W, Yong VW (2012) A dialog between glioma and microglia that promotes tumor invasiveness through the CCL2/CCR2/interleukin-6 axis. Carcinogenesis 33:312–319. 10.1093/carcin/bgr289 [DOI] [PubMed] [Google Scholar]
- Zhao K, Wang L, Li T et al (2017) The role of miR-451 in the switching between proliferation and migration in malignant glioma cells: AMPK signaling, mTOR modulation and Rac1 activation required. Int J Oncol 50:1989–1999 [DOI] [PMC free article] [PubMed] [Google Scholar]
Associated Data
This section collects any data citations, data availability statements, or supplementary materials included in this article.
Supplementary Materials
Supplementary file1 (TIFF 2376 KB) Supplementary Figure S1 72 hours primary glioma cell culture from patient samples of low and high-grade gliomas at ×1 DMEM with 15% FBS and 2% antibiotic medium at 37 °C, 5% CO2 humidified cell culture incubator. After successive washing with 1× PBS buffer, cells were used for an array of studies. Photographs are taken under phase-contrast light microscopy at ×400, TS 100-F Eclipse, Nikon Corp., Japan.
Data Availability Statement
Data provided in the manuscript and if required further, will be provided by the first and corresponding authors.
NA.