

Abstract
The industrial chemical melamine was used in 2007 and 2008 to raise the apparent protein content in pet feed and watered down milk, respectively. Because humans may be exposed to melamine via several different routes into the human diet as well as deliberate contamination, this study was designed to characterize the effect of high dose melamine or cyanuric acid oral exposure on the pregnant animal and developing fetus, including placental transfer. Clear rectangular crystals formed following a single triazine exposure which is a different morphology from the golden spherulites caused by combined exposure or the calculi formed when melamine combines with endogenous uric acid. Crystal nephropathy, regardless of cause, induces renal failure which in turn has reproductive sequelae. Specifically, melamine alone-treated dams had increased numbers of early and late fetal deaths compared to controls or cyanuric acid-treated dams. As melamine was found in the amniotic fluid, this study confirms transfer of melamine from mammalian mother to fetus and our study provides evidence that cyanuric acid also appears in the amniotic fluid if mothers are exposed to high doses.
Keywords: Melamine, Cyanuric acid, Reproductive toxicity, Rats
1. Introduction
Melamine is an industrial chemical used to manufacture plastics, laminates, resins, and fertilizers, but is also commonly found in dishware and kitchenware. Because it has high nitrogen content, melamine was fraudulently added to edible foodstuffs ostensibly to raise apparent protein levels during routine testing. During 2007, in North America and South Africa, wheat flour and rice protein concentrate destined for pet food were adulterated with recycled melamine that contained related analogs (such as ammeline, ammalide, and cyanuric acid). This adulteration caused hundreds of pet deaths due to renal failure. Microscopic melamine–cyanurate crystals obstructed renal tubules within the kidney, causing kidney damage by a mechanism similar to that of uric acid nephropathy (Reimschuessel et al., 2008). Altogether, thousands of pets were affected to some degree along melamine’s toxicity spectrum from renal impairment to failure and death (Puschner and Reimschuessel, 2011). During 2008 in China, a more refined melamine was added to watered down milk, which in turn, was used to manufacture powdered infant formula. The melamine combined with endogenous uric acid to form calculi in the kidney, ureter, or bladder, and an estimated 294,000 infants were affected in the first months of the crisis (WHO, 2008).
In addition to infant formula and milk, other dairy products, beverages, eggs, and candies were contaminated with melamine (Ingelfinger, 2008; Xia et al., 2009). Further, additional exposure to leaching melamine may occur if chlorinated disinfectants are used when cleaning melamine dishware (WHO, 2008). Because of these many potential additional sources of melamine in the diet, there is concern that pregnant women could be exposed to melamine contaminated foods. The fate of melamine, and its related analogue cyanuric acid, in pregnant females and developing fetuses has not been fully characterized.
Previous studies in pregnant rats primarily focus on single doses to determine pharmacokinetic parameters of transfer or focus on melamine only (Chu et al., 2010; Jingbin et al., 2010; Chan et al., 2011; Kim et al., 2011; Chu et al., 2013). We designed our study to investigate the effects of repeated high doses of either melamine or cyanuric acid on pregnant rats and their developing fetuses. The study detailed herein reports the concentrations of melamine and cyanuric acid in the amniotic fluid and serum from these maternal rats and the effects of these triazines on fetal development and crystal formation in the maternal kidney.
2. Material and methods
2.1. Experimental animals and animal husbandry
Caesarean-derived CD IGS VAF/+ rats (n = 35 pregnant and n = 33 nulliparous non-pregnant rats) 8–10 weeks of age were purchased from Charles River (Frederick, MD, USA). The animals were acclimated for approximately 3 days at which point they were uniquely identified by ear tags. The experimental animals were individually housed in microisolator cages in an air-conditioned room maintained at 18–26 °C, and 40–70% relative humidity. A 12-h light and dark cycle was automatically maintained. Fluid and feed consumption was measured every 3 and 7 days, respectively. Feed (Harlan Tekland Global 2018CM rodent diet) and water (Hydro-Pico Systems, Inc., Research Triangle Park, NC, USA) were provided ad libitum throughout the study. The diet was confirmed negative for melamine, cyanuric acid, ammeline, and ammelide by a contract laboratory (Eurofins, New Orleans, LA, USA). Animal use and procedures were reviewed and approved by the USFDA/CFSAN Institutional Animal Care and Use Committee.
2.2. Test material
Dosing solutions (10% w/v) of melamine (MEL; 99% pure; Sigma–Aldrich, St. Louis, MO, USA) and cyanuric acid (CYA; 98% pure; Sigma–Aldrich, St. Louis, MO, USA) were prepared in 1% carboxymethylcellulose (CMC-Na; Sigma–Aldrich, St. Louis, MO, USA). The concentration of the dosing solutions was confirmed by a contract laboratory (Eurofins, New Orleans, LA, USA) using LC–MS/MS.
2.3. Experimental design
Time pregnant and non-pregnant animals, beginning on gestation day 10 (GD10), were randomly assigned to one of the following 6 dose groups by weight using a stratified random procedure: (1) non-pregnant rats administered 1% CMC-Na vehicle (control; n = 11), (2) non-pregnant rats (n = 11) administered 1000 mg/kg BW/day CYA, (3) non-pregnant rats (n = 11) administered 1000 mg/kg BW/day MEL, (4) time-pregnant rats administered 1% CMC-Na vehicle (control; n = 11), (5) time-pregnant rats (n = 11) administered 1000 mg/kg BW/day CYA, and (6) time-pregnant rats (n = 13) administered 1000 mg/kg BW/day MEL. Animals received the test article by gavage for 10 straight days in the morning at a volume of 1 mL/100 g body weight. The 1000 mg/kg BW/day dose was chosen because the purpose of this study was to determine whether a high dose of triazine (either MEL of CYA) could induce crystal formation and to determine if crystal formation was affected by pregnancy.
2.4. Clinical observations
Clinical observations were made at least twice on the first day of dosing and at least once daily thereafter throughout the gestational period. Observations included, but were not limited to, changes in skin, fur, eyes, and mucous membranes. Respiratory, circulatory, autonomic, and central nervous systems were observed, in addition to somatomotor activity and behavior patterns. Attention was directed toward observations of tremors, convulsions, salivation, diarrhea, lethargy, sleep, and coma. Animals taken off study early were considered equivocal to animals that died.
2.5. Tissue collection
2.5.1. Non-pregnant animals
Non-pregnant rats were euthanized by carbon dioxide asphyxiation after 10 consecutive days of exposure to the control or test material. Rats were bled from the inferior vena cava, and the samples were allowed to clot for 15 min, centrifuged for 15 min, and stored at −80 °C until analyses. The kidneys were weighed and either preserved in formalin or frozen for wet-mount analysis. Finally, remaining maternal organs were removed and weighed.
2.5.2. Pregnant animals
Pregnant females were euthanized by carbon dioxide asphyxiation on GD20. A mid ventral incision was made in the abdomen to expose the abdominal and pelvic viscera. The number of corpora lutea, the number of implantation sites, and the number and position of resorption sites and fetuses (dead or alive) were noted. The gravid uterus was removed in toto and weighed. Each viable fetus was removed from the uterus and examined individually and records were kept as to its uterine position, sex, weight, and crown-rump length, as well as any externally visible abnormalities. Runts, defined as an animal whose body weight is <70% of the average weight of the control litter averages by gender, were identified and their position noted. The uteri of animals that did not appear pregnant were stained with ammonium sulfide to enhance the observation of implantation sites. Early death was defined as a deciduoma, an implantation site with no fetal development. Late death was defined as fetuses that had shape or form, which indicates the implantation was successful and the fetus died later in gestation. A 20 gauge needle was inserted into the amniotic sac and amniotic fluid was aspirated. Each aspiration was observed for blood contamination before it was pooled by dam. Approximately 1.5 mL of amniotic fluid was collected per dam. Finally, remaining maternal organs were removed and weighed.
2.6. Wet-mount analysis
One half of the right kidney and the full left kidney were frozen until analysis. For wet-mount analysis, a thin slice of renal tissue containing portions of both medulla and cortex was weighed and then compressed between two microscope slides with a coverslip inserted between the tissue and one of the slides. Fresh slides were observed on a light microscope. The crystals observed were ranked on a subjective scale from 0 to 5 as follows: (0) none seen; (1) extremely few (1 or 2 in an entire section); (2) few with scattered distribution; (3) moderate numbers seen throughout section; (4) large numbers seen immediately; and (5) extensive numbers obliterating the regular tissue architecture. Kidneys from fetuses were not examined by wet-mount as results from a preliminary study (data not shown) indicate renal crystals are not formed in neonates or in fetuses from mothers exposed at these dose levels.
2.7. Formalin, ethanol, and freezing effects on crystals
Additional slices of kidney from rats exposed to MEL only and to CYA only with a crystal rank of 4 or 5 were prepared for wet-mount as described above. Slides were flooded with 10% neutral buffered formalin and photomicrographs were taken at 0, 1, 2, 3, and 24 h for the MEL kidney and 0, 10, 20, 30 min, and 1 h for the CYA kidney.
A similar experiment using ethanol instead of formalin was performed, and sections were evaluated daily for up to 6 days. Frozen sections were cut at 6 μm and either used unstained or were stained with hematoxylin and eosin.
2.8. Histopathology
One half of the right kidney and the bladder from each dam were preserved in 10% neutral buffered formalin and processed for routine embedding in paraffin. Sections were stained with hematoxylin and eosin.
2.9. Raman spectroscopy
Archived kidney samples were kept at −80 °C until analysis. Multiple thin sections were cut using a razor blade onto quartz slides with a thickness of 25 × 76 × 1 mm (SPI, West Chester, PA, USA). Prior to analysis with the Raman spectroscopy microscope, samples were confirmed to have crystals using light microscopy. Standards (ACROS Organics, NJ, USA) of melamine powder and cyanuric acid powder were run the same day by placing the powders on a quartz slide.
Samples were analyzed using a Raman spectroscopy microscope including an optical microscope (Olympus BX41) and a spectrograph (XPLORA, Horiba Jobin Yvon, Edison, NJ, USA). All sample analysis was completed using a 785 nm laser (20–25 mW laser power) with a 100 × objective for 20 s with 3 iterations. A 30 s photobleach was used to reduce fluorescence caused by tissue samples and was also used on standards to maintain consistency. A grating of 1200 lines/mm was used with a 500 μm hole and 200 μm slit. All spectra were collected using LabSpec 5 (HORIBA Jobin Yvon SAS, France).
A representative spectrum for each sample/standard was chosen. Raw spectra were automatically baseline corrected using OMNIC™ 8 software for dispersive Raman (Thermo Electron, Madison, WI, USA). In order to account for natural variations in signal intensity due to crystal formation and orientation in the tissue, each spectrum was normalized to highest intensity peak for ease of visual comparison and spectral library analysis. Data were plotted in GraphPad Prism (v. 5.02, La Jolla, CA, USA) with the individual spectra offset for visual clarity.
2.10. Serum chemistry, renal function
Serum samples were brought to room temperature. Values for blood urea nitrogen (BUN), creatinine, and uric acid analyses were determined on a VetTest™ Chemistry Analyzer (IDEXX Laboratories, Inc., Westbrook, ME, USA).
2.11. Serum and amniotic fluid triazine analyses
Melamine was obtained from Ricca Chemical Company (99%; Arlington, TX, USA). Cyanuric Acid was obtained from Fisher Scientific (98%; Pittsburgh, PA, USA). Internal standards melamine–13C [99 atom% 13C, 95% (CP)] and cyanuric acid–13C [99 atom% 13C, 95% (CP)] were purchased from Sigma Aldrich (St. Louis, MO, USA). All other reagents used were of reagent grade or better. Water was purified through a MilliMili-Q system (Millipore, Bedford, MA, USA) to >18 MΩ resistivity.
Melamine and cyanuric acid stock solutions were prepared in 0.1% formic acid targeting a concentration of 100–200 μg/mL. Stock solutions were used to prepare standard mixture solutions for the standard curve at concentrations of 0.04–5 μg/mL to achieve a final concentration equivalent to 0.4–50 μg/mL in serum. Standard mixture solutions of 3.2, 20, and 25 μg/mL were prepared to use as pre-fortification standards to achieve a final concentration of 1.6, 8, and 25 μg/mL in serum. Internal standard stock solutions were prepared similarly, and used to prepare standard mixed solutions of melamine–13C and cyanuric acid–13C at concentrations of 10 and 25 μg/mL.
Serum and amniotic fluid samples were prepared for analysis as described in Stine et al. (2012); however, the pre-extraction fortified quality control sample was spiked at a level equivalent to 4 ppm in serum (20 μL of 20 μg/mL standard mix solution into 100 μL sample).
Serum and amniotic fluid extracts were analyzed on an Agilent 1100 liquid chromatograph containing a ZIC-HILIC column coupled with a Waters Quattro micro™ Micromass triple quadrupole mass spectrometer (Stine et al., 2012). Chromatograms were analyzed with TargetLynx software (Waters, Milford, MA, USA). Equipment and instrument settings remained the same as described in Stine et al. (2012). For both melamine and cyanuric acid, the limit of quantification (LOQ) was the lowest point of the calibration curve (0.4 μg/mL) and the limit of confirmation (LOC) was estimated at 0.4 μg/mL with a signal to noise ratio of ⩾5.
Serum and amniotic fluid method validation procedures followed those of Stine et al. (2012) as well, except the fortification levels of the pre-spiked validation samples differed, at 1.6 ppm, 4 ppm, and 25 ppm in serum and amniotic fluid. This was achieved by adding 50 μL of 3.2 μg/mL standard mix (1.6 ppm), 20 μL of 20 μg/mL standard mix (4 ppm), and 100 μL of 25 μg/mL standard mix (8 ppm) to 100 μL of serum or amniotic fluid control sample.
Following the guidelines presented by the FDA for Bioanalytical Method Validation (USFDA, 2001), accuracy was considered acceptable if the average value of the replicates at each fortification level was within 15% of the actual value. Precision was considered acceptable if the relative standard deviation percent (RSD%; as measured by the coefficient of variation percent, CV%) was less than 15%.
2.12. Statistical analyses
Beta regression (PROC GLIMMIX) was used on log-transformed percentages whereas ANOVA (PROC GLM) followed by least squares for comparisons was used on continuous variable data (SAS 9.2, Cary, NC, USA). Grubbs test was used to remove any total fluid consumption outliers prior to full analysis.
For analytical method validation, all statistical analyses were performed in SigmaPlot (v. 12.3, Systat Software, Chicago, IL, USA), including mean, standard deviation, and standard deviation percent calculations for method validation. To test for differences in CYA and MEL due to reproductive status, serum concentrations were log transformed for two-sided t-test evaluation. To compare CYA and MEL concentrations between fluids from the same rat, serum to amniotic fluid correlations were performed using Pearson’s product moment correlation. These correlation analyses were performed only on rats with both serum and amniotic fluid samples. Results were considered significant at p ⩽ 0.05.
3. Results
3.1. Maternal health, body weight gain, and feed and water consumption
All control and CYA-treated rats, pregnant and non-pregnant, survived the 10 day dosing period with no treatment related health effects. However MEL-treated rats lost condition, as they became listless, reluctant to groom, and anorexic. Therefore, 1 non-pregnant and 7 pregnant animals were removed from the study early. In both the non-pregnant and pregnant cohorts, the mean weight gains were significantly lower in the MEL group than the CYA or control groups and animals in the non-pregnant group actually lost weight (Table 1). When body weight at GD10 and gravid uterus weight were subtracted from GD20 weight, mean weight gain was again significantly lower than that of the CYA or control groups (Table 1). Like their non-pregnant conspecifics, the animals in the MEL group lost weight over the time course of the study. In both the non-pregnant and pregnant cohorts, the MEL group had a significantly lower feed consumption than that of the control or CYA groups (Table 1). In the non-pregnant cohort, the MEL animals had significantly higher total water consumption than the controls (Table 1).
Table 1.
Weight gains and feed and water consumption of dams gavaged with 1% CMC (control), 1000 mg/kg BW/day CYA, or 1000 mg/kg BW/day MEL. Adjusted weight gain equals GD20 body weight minus gravid uterus weight and GD10 weight. Brackets indicate negative.
| Not pregnant | Pregnant | |||||
|---|---|---|---|---|---|---|
| Control | CYA | MEL | Control | CYA | MEL | |
| Total bw gain (g ± SEM) | 11.9 ± 2.1 | 16.0 ± 4.1 | (9.1) ± 6.5^ | 92.4 ± 4.4 | 94.2 ± 3.3 | 5.7 ± 14.9^ |
| Adjusted weight gain (g ± SEM) | 15.6 ± 2.9 | 13.5 ± 3 .5 | (32.0) ± 14.6^ | |||
| Total feed consumption (g ± SEM) | 162.6 ± 3.2 | 158.6 ± 8.8 | 112.3 ± 9.2^ | 230.1 ± 6.4 | 220.1 ± 5.4 | 122.2 ± 11.0^ |
| Total water consumption (g ± SEM) | 224.1 ± 12.7 | 264 ± 21.2 | 295.1 ± 21.9* | 343.5 ± 21.1 | 353.6 ± 17.5 | 391.8 ± 43.6 |
Indicates significant difference from respective control (p < 0.05).
Indicates significant difference from respective control and CYA group (p < 0.05).
3.2. Organ weights
Organ weights were standardized to body weight for analyses (Table 2). In both the non-pregnant and pregnant cohorts, the left kidney, right kidney, and combined kidney weight means were significantly higher in the MEL group in comparison to the control and CYA groups. Although statistical comparisons were not made due to insufficient sample size, a qualitative assessment shows the 4 individual CYA rats with renal crystals (Tables 6 and 7 show rats with crystals) had standardized paired kidney weights higher than the weights of their respective group means. The two non-pregnant CYA rats with crystals both had standardized weights of 1.22% compared with a group mean of 0.88% and the pregnant CYA rats had standardized weights of 0.74% and 0.77% compared with a group mean of 0.58% (group means presented in Table 2).
Table 2.
Body weight and organ weights standardized to body weight of dams gavaged with 1% CMC (control), 1000 mg/kg BW/day CYA, or 1000 mg/kg BW/day MEL.
| Not pregnant | Pregnant | |||||
|---|---|---|---|---|---|---|
| Control | CYA | MEL | Control | CYA | MEL | |
| GD20 Body weight (g ± SEM) | 234.4 ± 2.8 | 234.3 ± 4.5 | 211.3 ± 6.3 | 355.4 ± 8.0 | 351.3 ± 6.1 | 247.6 ± 11.5 |
| Organ weights standardized to body weight (% ± SEM) | ||||||
| Left kidney | 0.38 ± 0.01 | 0.43 ± 0.02 | 0.65 ± 0.06 | 0.27 ± 0.01 | 0.28 ± 0.02 | 0.52 ± 0.05 |
| Right kidney | 0.40 ± 0.01 | 0.45 ± 0.03 | 0.68 ± 0.08^ | 0.28 ± 0.01 | 0.30 ± 0.01 | 0.56 ± 0.05^ |
| Paired kidney | 0.78 ± 0.01 | 0.88 ± 0.05 | 1.33 ± 0.13^ | 0.55 ± 0.01 | 0.58 ± 0.03 | 1.09 ± 0.10^ |
| Liver | 3.84 ± 0.06 | 3.48 ± 0.07* | 3.70 ± 0.14 | 3.75 ± 0.05 | 3.58 ± 0.09 | 3.64 ± 0.08 |
| Heart | 0.41 ± 0.01 | 0.38 ± 0.01 | 0.43 ± 0.02# | 0.30 ± 0.01 | 0.30 ± 0.01 | 0.37 ± 0.03^ |
| Spleen | 0.22 ± 0.01 | 0.23 ± 0.02 | 0.26 ± 0.02 | 0.18 ± 0.01 | 0.17 ± 0.01 | 0.16 ± 0.03 |
Indicates significant difference from respective control (p < 0.05).
Indicates significant difference from respective control and CYA group (p < 0.05).
Indicates significant difference from respective CYA group (p < 0.05).
Table 6.
Crystal rankings and melamine and cyanuric acid concentrations in serum of non-pregnant female rats administered melamine or cyanuric acid for 10 consecutive days at a dosage of 1000 mg/kg BW/day. Values on one line correspond to the same rat. Serum from all non-pregnant control rats (n = 11) was negative for both compounds.
| Dose group | Plate-like clear crystals | CYA (μg/mL) | MEL (μg/mL) |
|---|---|---|---|
| Cyanuric acid | 5 | 173.2 | <LOD |
| 2 | 54.1 | <LOD | |
| 0 | 30.5 | <LOD | |
| 0 | 25.0 | <LOD | |
| 0 | 11.6 | <LOD | |
| 0 | 11.1 | <LOD | |
| 0 | 6.0 | <LOD | |
| 0 | 5.4 | <LOD | |
| 0 | 5.2 | <LOD | |
| 0 | 3.5 | <LOD | |
| 0 | 2.3 | <LOD | |
| Mean | 29.8 | 0.0 | |
| SD | 50.1 | 0.0 | |
| Melamine | 4 | <LOD | 766.7 |
| 5 | <LOD | 531.3 | |
| 2 | <LOD | 302.0 | |
| 4 | <LOD | 284.2a | |
| 3 | <LOD | 268.2 | |
| 3 | <LOD | 238.2 | |
| 3 | <LOD | 170.3 | |
| 4 | <LOD | 155.1 | |
| 3 | <LOD | 73.7 | |
| 0 | <LOD | 32.1 | |
| 5 | NS | NS | |
| Mean | 0.0 | 282.2 | |
| SD | 0.0 | 219.6 |
LOD = limit of detection (0.4 μg/mL). NS = no sample.
Removed early from study at GD19.
Table 7.
Crystal rankings and melamine and cyanuric acid concentrations in serum and amniotic fluid of pregnant female rats administered melamine or cyanuric acid for 10 consecutive days at a dosage of 1000 mg/kg BW/day. Values on one line correspond to the same rat. Serum from all pregnant control rats (n = 11) was negative for both compounds.
| Dose Group | Plate-like clear crystals | CYA (μg/mL) | MEL (μg/mL) | ||
|---|---|---|---|---|---|
| Serum | Amniotic Fluid | Serum | Amniotic Fluid | ||
| Cyanuric Acid | 3 | 313.7 | 123.5 | <LOD | <LOD |
| 2 | 152.5 | 157.4 | <LOD | <LOD | |
| 0 | 80.5 | 60.3 | <LOD | <LOD | |
| 0 | 55.8 | 51.8 | <LOD | <LOD | |
| 0 | 41.6 | 40.4 | <LOD | <LOD | |
| 0 | 31.1 | 44.5 | <LOD | <LOD | |
| 0 | 23.0 | 33.9 | <LOD | <LOD | |
| 0 | 16.7 | 37.7 | <LOD | <LOD | |
| 0 | 15.3 | 28.3 | <LOD | <LOD | |
| 0 | 11.3 | 37.4 | <LOD | <LOD | |
| 0 | 10.8 | 23.9 | <LOD | <LOD | |
| Mean | 68.4 | 58.1 | 0.0 | 0.0 | |
| SD | 91.5 | 42.6 | 0.0 | 0.0 | |
| Melamine | 5 | <LOD | <LOD | 683.2a | 472.5a |
| 5 | <LOD | <LOD | 610.9 | 497.1 | |
| 5 | <LOD | NS | 551.8 | NS | |
| 4 | <LOD | <LOD | 411.3b | 517.2b | |
| 5 | <LOD | <LOD | 409.0 | 377.0 | |
| 4 | <LOD | <LOD | 355.6 | 300.6 | |
| 3 | <LOD | NS | 294.1c | NSc | |
| 4 | <LOD | NS | 116.9 | NS | |
| 5 | <LOD | <LOD | 89.6 | 346.4 | |
| 5 | NS | NS | NSd | NSd | |
| 5 | NS | NS | NSe | NSe | |
| 5 | NS | NS | NSe | NSe | |
| 4 | NS | NS | NSd | NSd | |
| Mean | 0.0 | 0.0 | 391.4 | 418.5 | |
| SD | 0.0 | 0.0 | 205.2 | 89.1 | |
LOD = limit of detection (0.4 μg/mL). NS = no sample (amniotic fluid could not be collected from some rats for reasons discussed in the text).
Removed early from study at GD15 and 17, respectively.
Found dead at GD18, 14, and 16, respectively.
While there were no significant differences in the pregnant cohort liver weight means, in the non-pregnant cohort, the mean liver weight of the CYA group was significantly lower than the mean of the controls. The mean heart weight in the non-pregnant MEL group was significantly larger than that of the CYA group. The mean heart weight in the pregnant MEL group was significantly larger than that of the control or CYA groups. There were no differences detected in mean spleen weight for either cohort.
3.3. Reproductive indices
Implant efficiency was consistent across treatment groups (Table 3). Pup genders were not significantly different among dose groups, but interestingly, more male pups were born than female pups in all groups. The MEL group had significantly higher (p < 0.10) mean early death percentage compared with control and CYA groups. Likewise, when compared to the combined control and CYA percentages, the MEL group had significantly higher early and late death percentages at the p < 0.05 level.
Table 3.
Reproductive indices findings at necropsy of dams gavaged with 1% CMC (control), 1000 mg/kg BW/day CYA, or 1000 mg/kg BW/day MEL.
| Control | CYA | MEL | |
|---|---|---|---|
| No. corpea lutea (mean ± SEM) | 14.8 ± 0.6 | 15.1 ± 0.5 | 15.1 ± 0.4 |
| No. implants (mean ± SEM) | 13.4 ± 0.6 | 13.6 ± 0.5 | 13.3 ± 0.6 |
| Implant efficiency (mean% ± SEM) | 90.4 ± 2.2 | 90.7 ± 3.0 | 88.0 ± 3.6 |
| No. fetuses alive (mean ± SEM) | 12.5 ± 0.7 | 13.2 ± 0.6 | 5.5 ± 2.0 |
| Percent alive both genders (mean% ± SEM) | 93.7 ± 2.4 | 96.7 ± 1.6 | 39.7 ± 14.2 |
| Percent live males (mean% ± SEM) | 59 ± 3.5 | 59.3 ± 3.8 | 59.3 ± 3.8 |
| Percent live females (mean% ± SEM) | 41 ± 3.5 | 40.7 ± 3.8 | 40.7 ± 3.8 |
| Early deaths (mean% of implants ± SEM) | 3.4 ± 1.2 | 1.3 ± 0.9 | 28.8 ± 12.5@ |
| Late deaths (mean% of implants ± SEM) | 3.5 ± 1.6 | 2.0 ± 1.6 | 31.6 ± 13.1 |
| Early and late deaths (mean% of implants ± SEM) | 6.9 ± 2.5 | 3.4 ± 1.6 | 60.3 ± 14.2^ |
Indicates significant difference from respective control and CYA group (p < 0.05).
Indicates significant difference from respective control and CYA group (p < 0.10).
3.4. Fetal data
Melamine exposure significantly reduced litter size, average fetal body weight, and average crown rump length compared with the control and CYA groups (Table 4). Mean percent of runts was considerably higher in the MEL group than the control and CYA groups.
Table 4.
Fetal data from dams gavaged with 1% CMC (control), 1000 mg/kg BW/day CYA, or 1000 mg/kg BW/day MEL.
| Control | CYA | MEL | |
|---|---|---|---|
| Litter size (mean ± SEM) | 12.5 ± 0.7 | 13.2 ± 0.6 | 5.5 ± 2.0^ |
| Average fetal body weight (g ± SEM) | 4.00 ± 0.08 | 4.06 ± 0.05 | 2.85 ± 0.48^ |
| Runts (mean% ± SEM) | 3.8 ± 3.0 | 0 ± 0 | 54.2 ± 26.7^ |
| Average crown rump length (mean cm ± SEM) | 4.09 ± 0.03 | 4.10 ± 0.02 | 3.62 ± 0.23^ |
Indicates significant difference from respective control and CYA group (p < 0.05).
3.5. Wet-mount data
Control rats had no renal crystals. All but one (23 of 24, 96%) MEL-treated rats developed elongated rectangular box shaped crystals that filled the renal tubules (Tables 6 and 7, and Fig. 1). Crystals in some animals were so plentiful that they obliterated appearance of the normal architecture, forming dark striations radiating from the renal papilla to the medulla of the kidney. These crystals appeared to contain some fibrillar structures observable at the edges of broken crystals. Some of the MEL crystals had a dark brown appearance, while others were moderately transparent. The crystals were birefringent when viewed with polarized light. The crystals in the rats treated with this high dose of MEL in no way resembled the gold brown spherulite melamine–cyanurate crystals found in animals treated with both MEL and CYA in combination (Reimschuessel et al., 2008). Larger, non-pigmented pyramidal uroliths were also seen adjacent to the papilla in 4 of the MEL treated rats (Fig. 2).
Fig. 1.

Kidney wet mount fresh tissue sections from rats given oral MEL at 1000 mg/kg BW/day. (A–C) Rectangular clear or brownish melamine crystals fill the tubules. Crystal presence is marked in the medullary region of the kidney. Crystals look dark at low magnification but have a clear to brownish appearance at higher magnification. The crystals vary in shape with rectangular edges and some fibrillar structures protruding from the ends. (D) Polarized light demonstrates crystal birefringence. Black bars = 500 μm, White bars = 200 μm.
Fig. 2.

Pyramidal crystals found adjacent to the papilla in 4 of the MEL-treated rats. Lower right viewed using Polarized light. Black bars = 500 μm, White bars = 100 μm.
Only 4 (18%) of the 22 CYA-treated rats (2 pregnant and 2 non-pregnant) developed renal crystals (Tables 6 and 7 and Fig. 3). These crystals were also rectangular and filled the lumen of the tubules and had a more uniform clear appearance compared to the darker crystals found in MEL-treated rats. These crystals did not have the fibrillar structures observed in the MEL crystals. The crystals from the CYA-treated rats were also birefringent and, like the crystals found in the MEL-treated rats, did not resemble spherical melamine–cyanurate crystals.
Fig. 3.
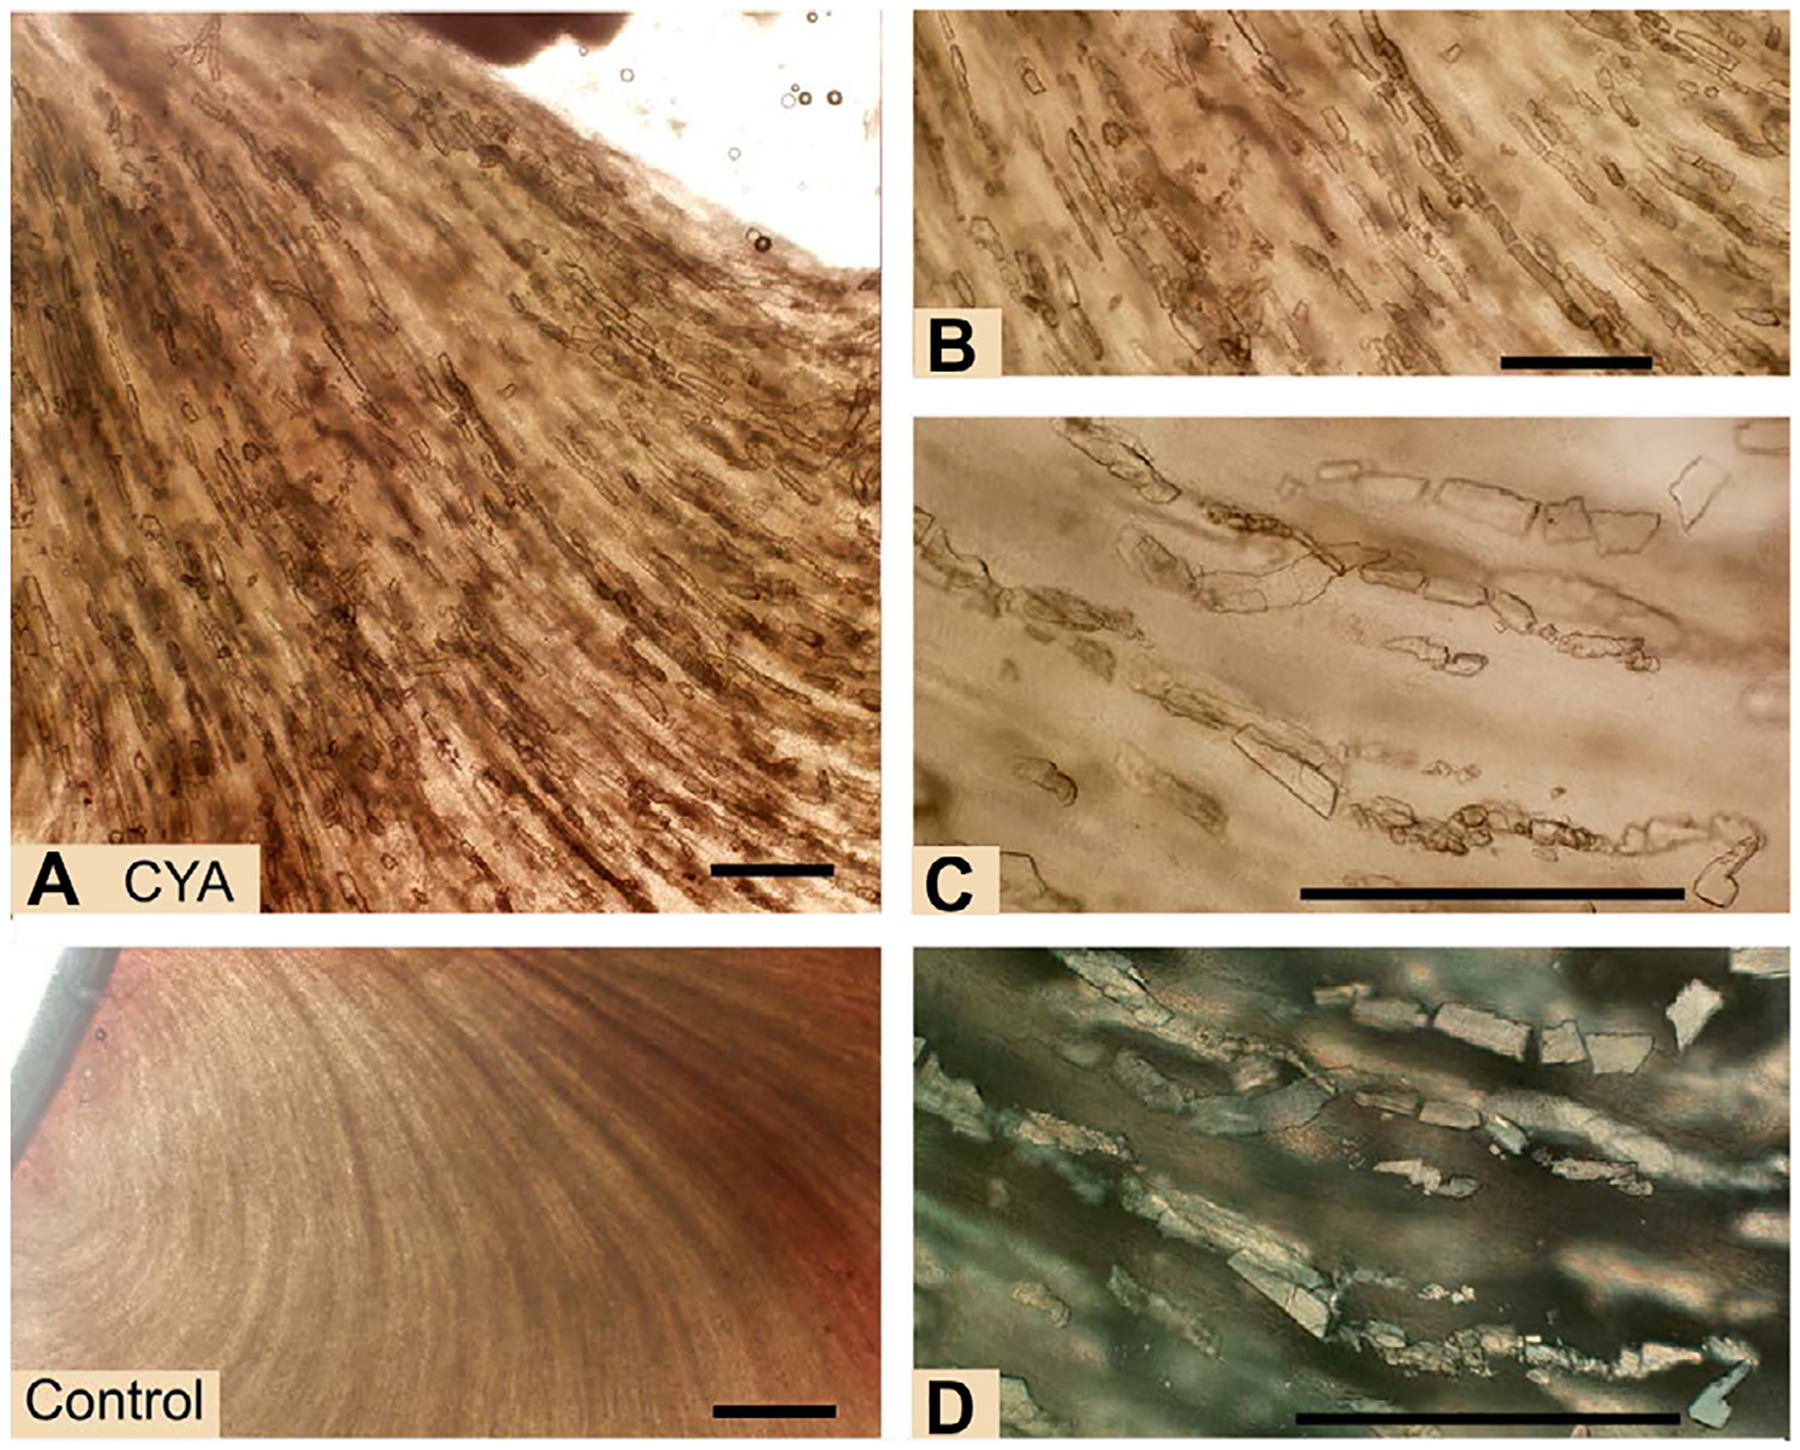
Kidney wet mount fresh tissue sections from control rats and rats given oral CYA at 1000 mg/kg BW/day. Lower Left: Control kidney – Normal appearance of renal tubules in a wet mount. No crystals are present and tubules can be seen radiating from the renal papilla to the cortex. (A-D) CYA – Rectangular cyanuric acid crystals fill renal tubules. Crystals look dark brown at low magnification but at higher magnifications can be seen as clear rectangular to rhomboid structures with right-angle edges. (D) Polarized light demonstrates crystal birefringence. Bars = 500 μm.
3.6. Formalin, ethanol, and freezing effects on crystals
Formalin fixation rapidly dissolved crystals in kidneys from both the MEL- and CYA-treated groups (Figs. 4 and 5). MEL crystal presence was greatly reduced within 2 h of exposure to formalin, and all crystals had disappeared by 24 h. CYA crystals dissolved even more rapidly, with almost all crystals gone in 30 min and no sign of crystals 1 h post-exposure of the sections to formalin. This is a very significant finding, as crystals were not found in histopathologic sections that were preserved in formalin.
Fig. 4.

Kidney wet mount fresh tissue sections from rats given oral MEL at 1000 mg/kg BW/day. Sequential exposures of the same slide flooded with 10% neutral buffered formalin. (*) indicates the same region on the slide. Within 1 h many of the crystals located in the medulla have dissolved. By 2 h the corticomedullary region has also lost most of its crystals. No crystals are present at 24 h. Bar = 200 μm.
Fig. 5.

Kidney wet mount fresh tissue sections from rats given oral CYA at 1000 mg/kg BW/day. Sequential exposures of the same slide flooded with 10% neutral buffered formalin. Most of the crystals in the renal papilla and medulla have dissolved by 30 min. No crystals are present at 1 h. Arrows point to the same region on the lower panel. Bar = 500 μm.
Exposure of wet mount sections to 100% ethanol caused crystals from MEL-treated animals to progressively dissolve over a period of 6 days.
MEL and CYA crystals were also observed in cryosections. MEL crystals were able to withstand freeze–thaw cycles, however CYA crystals in frozen tissues that were exposed to several freeze–thaw cycles also dissolved, while CYA in tissues held at −70 °C remained stable.
MEL and CYA crystals in cryosections dissolved when those sections were stained with hematoxylin and eosin, leaving empty angular tubules with rectangular eosinophilic cellular debris, described as crystal “ghosts” (Fig. 6; Khan et al., 1983; Khan and Hackett, 1987).
Fig. 6.
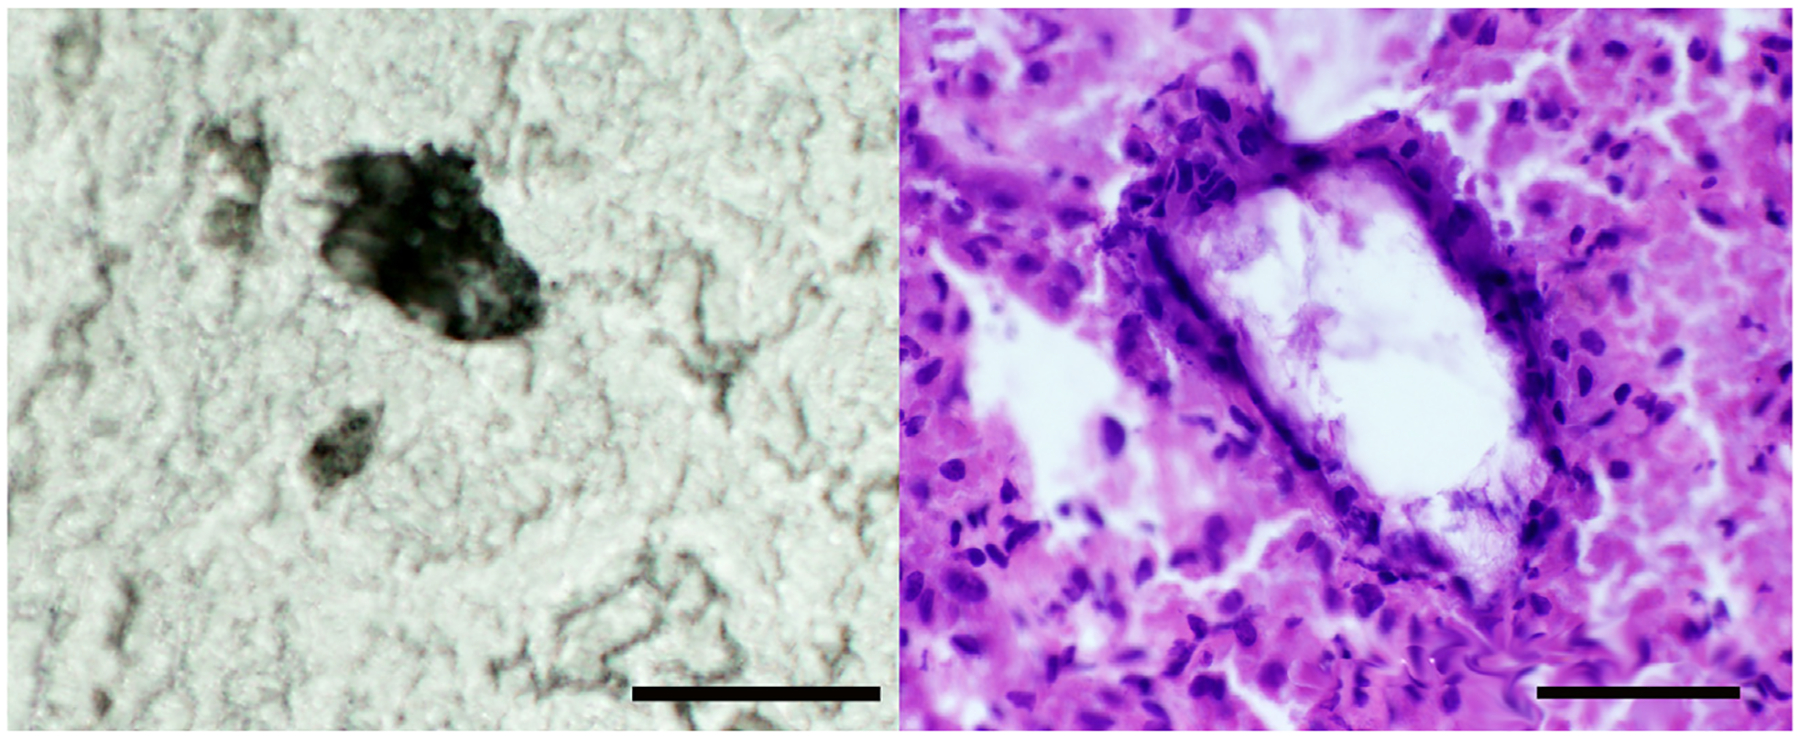
Frozen unstained and hematoxylin and eosin-stained section of kidneys of rats treated with MEL at 1000 mg/kg BW/day. Crystals were evident in frozen sections of MEL-treated rat kidney (left), but they dissolved during staining with hematoxylin and eosin (no fixation). The outline of the crystal can be clearly seen in the stained section (right). Two photomicrographs are of the same section. Bar = 50 μm.
3.7. Histopathology
The most remarkable histopathologic finding was the lack of crystals in formalin-fixed H&E sections of MEL-treated rats (Figs. 7–9). The presence of the crystals prior to fixation was evident, however, as shown in the photomicrographs of the crystal “ghosts” of empty angular tubules containing amorphous debris (Fig. 9). Dilated tubules abound in the sections; many of these tubules have prominent rectangular luminal outlines. Such right angle structures are not usually encountered in kidney tubules, whose shapes routinely are oval or round. All MEL-treated rats had tubular necrosis (100%) and most of them (92%) had tubular dilation. Only 5 of the CYA-treated rats had tubular dilation and necrosis, 4 of these had rectangular crystals observed by wet-mount. These rats also had kidneys described grossly as enlarged and with renal weights heavier than the rest of the CYA-treated rats. Thus, crystal presence correlated with increased renal size, weight, and histologic lesions.
Fig. 7.

Hematoxylin and eosin sections of kidneys of rats treated with vehicle (control), MEL, or CYA at 1000 mg/kg BW/day. Control kidneys are normal in appearance. All MEL-treated kidneys were enlarged, with markedly dilated tubules containing necrotic cells, cellular debris (arrows) and crystal ghosts (*) present. 5 CYA-treated rats also had enlarged kidneys with widely dilated tubules. No crystal ghosts were present in these sections. Bars = 200 μm, low magnification is on the left, higher magnification of the same section is on the right.
Fig. 9.

Hematoxylin and eosin sections of kidneys of rats treated with MEL or CYA at 1000 mg/kg BW/day. Higher magnification photomicrographs showing right angle straight edged tubules, some containing rectangular cellular debris demonstrating the architecture of the crystal and forming what has been called “crystal ghosts.” Occasionally inflammatory cells were noted in renal tubules. Bar = 20 μm.
Histopathology of the bladder, in general was not remarkable. Epithelial necrosis in the bladder was found in 3 pregnant, MEL-treated rats, with 2 being scored as minimal or mild, and 1 as marked necrosis. Three CYA-treated rats, 1 pregnant, 2 non-pregnant had epithelial necrosis scored as mild. Necrosis could have been due to mechanical disruption as some of the rectangular shaped crystals passed from the kidney into the bladder. No controls had epithelial necrosis in the bladder.
3.8. Raman spectroscopy
The rectangular crystals of MEL-treated rats had spectra compatible with the MEL standard, and the crystals from the CYA-treated rats had spectra compatible with the CYA standard (Fig. 10). Specifically, the MEL-exposed rat’s crystal has peaks at approximately 385 and 975 cm−1 which correlate well with the melamine standard, while the features at approximately 540 and 1725 cm−1 in the CYA-exposed rat’s crystal match with the cyanuric acid standard. The other spectral bands align well with literature, where melamine has been shown to have peaks at approximately 378, 582, 676, and 984 cm−1, with the in-plane deformation vibrational mode at 676 cm−1 being the most intense (He et al., 2008; Cheng et al., 2010) and the less intense 986 cm−1 peak due to the ring breathing mode 1 of melamine (Koglin et al., 1996). Typical Raman peaks for cyanuric acid include 525, 552, 702, 991, and 1727 cm−1, with the ring out-of-plane bending vibration assigned to the most intense peak at 702 cm−1 and C=O stretching leading to the 1727 cm−1 band (He et al., 2008). It is important to note that no spectrum contained two peaks in the 685 cm−1 area, as this would be indicative of MEL–CYA complex. Slight spectral differences, including peak shifts, between the kidney crystals and powder standards were not unexpected. These differences are in part due to potential differences in crystal structures between the wet-mounted kidney sample crystals and bulk powders as well as the potential for the kidney crystals to contain traces of additional organic/inorganic matter. Despite these differences, there was no indication that the individual triazines had significantly combined with other chemicals based on characteristic peaks.
Fig. 10.
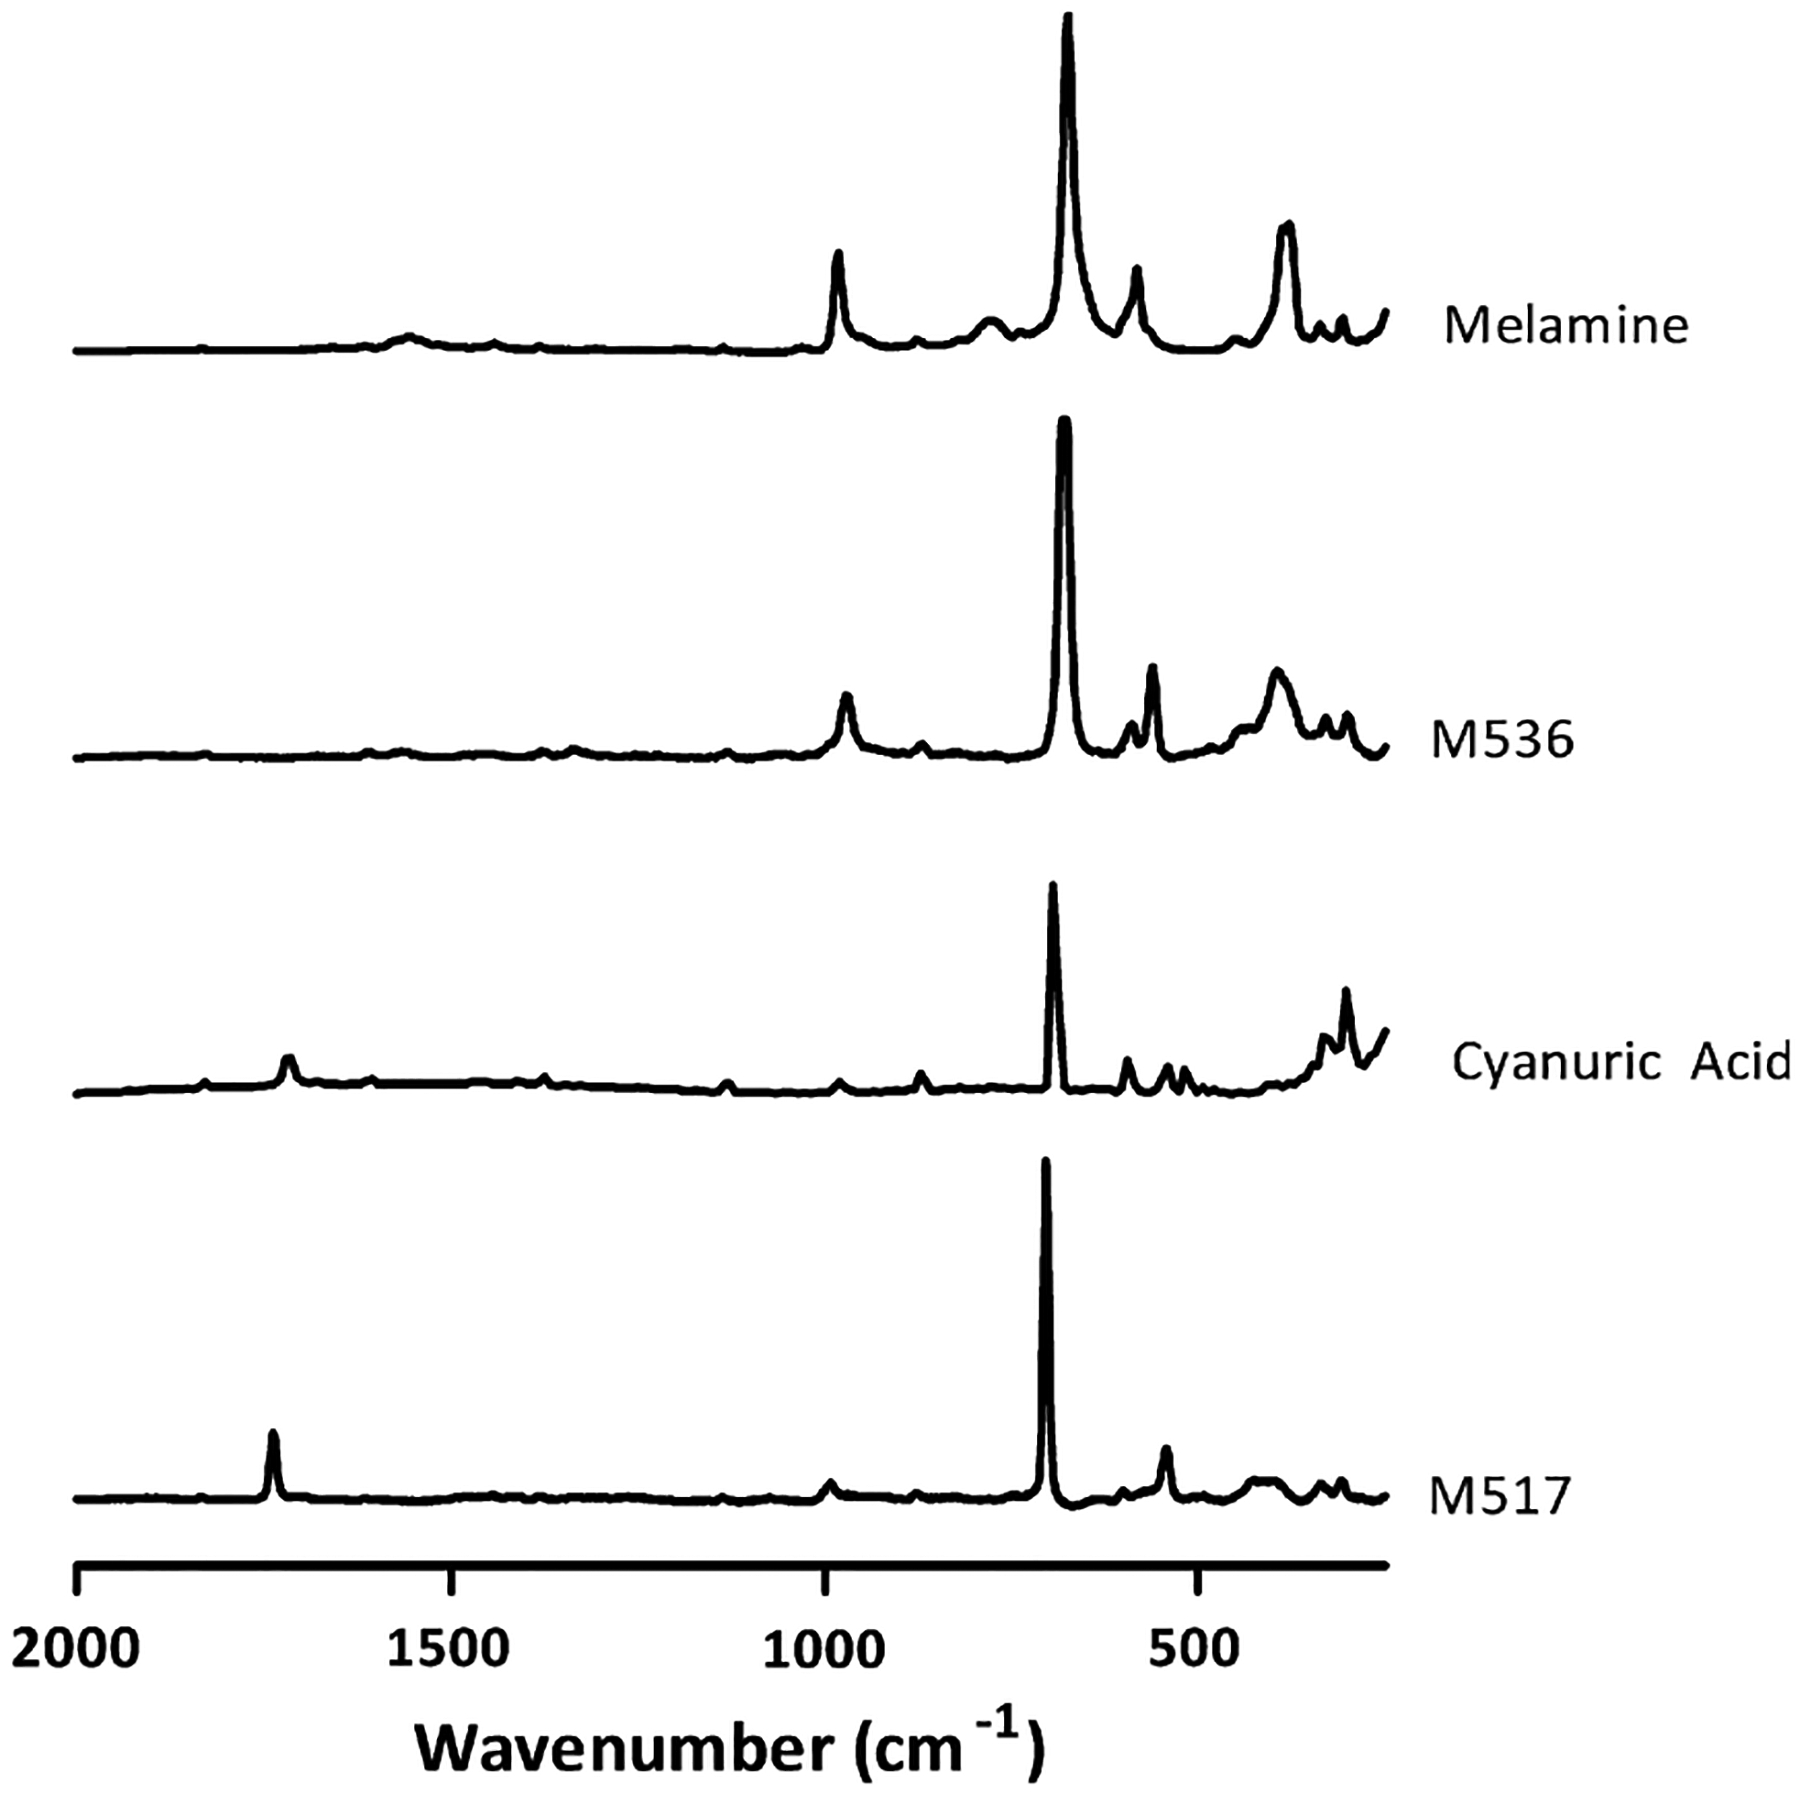
Raman spectra of melamine and cyanuric acid standards as well as unknown samples M536 (kidney slice from female rat given 1000 mg/kg BW/day MEL) and M517 (kidney slice from female rat given 1000 mg/kg BW/day CYA).
3.9. Serum chemistry, renal function
Blood urea nitrogen (BUN) and creatinine levels from MEL-treated rats were elevated approximately 2–4 times over control and CYA group levels for both pregnant and non-pregnant rats (Table 5). Qualitative assessment shows the 4 CYA-treated rats with renal crystals (2 pregnant and 2 non-pregnant) had a higher mean BUN (31 mg/dL, individual data not shown) versus that of the other CYA-treated rats (15 mg/dL) or versus the controls (16 mg/dL). The mean BUN of the 4 CYA-treated rats with crystals was, however, lower than that of the MEL-treated rats (69 mg/dL), of which all but one had crystals. Mean creatinine values for control rats and CYA-treated rats without crystals were 0.5 mg/dL while the mean creatinine of CYA-treated rats with crystals was 1.1 mg/dL and that of the MEL-treated rats was 1.4 mg/dL. MEL and CYA treatment did not appear to have an effect on uric acid serum levels versus the control rats.
Table 5.
Kidney function parameters (mg/dL) of dams gavaged with 1% CMC (control), 1000 mg/kg BW/day CYA, or 1000 mg/kg BW/day MEL.
| Not pregnant | Pregnant | |||||
|---|---|---|---|---|---|---|
| Control | CYA | MEL | Control | CYA | MEL | |
| Blood urea nitrogen (mean ± SEM) | 17.18 ± 0.71 | 17.82 ± 2.33 | 62.45 ± 17.32^ | 14.72 ± 1.05 | 17.45 ± 2.26 | 78.25 ± 18.41^ |
| Creatinine (mean ± SEM) | 0.49 ± 0.02 | 0.59 ± 0.07 | 1.28 ± 0.27^ | 0.47 ± 0.01 | 0.59 ± 0.07 | 1.45 ± 0.22^ |
| Uric acid (mean ± SEM) | 3.57 ± 0.26 | 5.26 ± 0.27& | 4.18 ± 0.29 | 3.42 ± 0.24 | 3.37 ± 0.28 | 3.45 ± 0.12 |
Indicates significant difference from respective control and CYA group (p < 0.05).
Indicates significant difference from respective control and 10% MEL group (p < 0.05).
3.10. Serum and amniotic fluid triazine analyses
Concentrations of MEL and CYA in serum of non-pregnant rats and in serum and amniotic fluid of pregnant rats following gavage treatment with 1000 mg/kg BW/day MEL, 1000 mg/kg BW/dayCY-A, or pure vehicle are presented in Tables 6 and 7, respectively, along with the rankings of crystals observed in renal tissues. The serum from all rats administered either MEL or CYA had detectable levels of the compound given. Melamine concentrations were generally higher than those of CYA in both non-pregnant and pregnant females.
Melamine serum concentrations were not statistically different in pregnant and non-pregnant rats (t = −1.209, p = 0.24 on natural log transformed data). However, CYA serum concentrations in pregnant rats were statistically higher than in non-pregnant rats (t = −2.125, p < 0.5 on natural log transformed data).
Although rats administered MEL had high levels of MEL in both serum and amniotic fluid, concentrations did not correlate (p > 0.15). Conversely, concentrations of CYA in the amniotic fluid corresponded well to those in the serum (Pearson Correlation Coefficient = 0.830, p < 0.01).
Serum or amniotic fluid was not collected from some pregnant rats and 1 non-pregnant rat in the 1000 mg/kg BW/dayMEL group because the mother died, the embryos died, or fetal resorption occurred, and no amniotic fluid was available. Additionally, in some cases the rats were taken off study early and since the embryos were small, amniotic fluid was not collected. Of note, an amniotic fluid sample from a control rat was mislabeled and thus excluded from the study (the sample tested negative for MEL and CYA).
Rectangular crystals (Fig. 1) were associated with serum MEL concentrations above 73 μg/mL in non-pregnant rats and with all serum concentrations (89–683 μg/mL) in pregnant rats (Tables 6 and 7). Rectangular clear crystals (Fig. 3) were present in kidneys of both pregnant and non-pregnant CYA exposed rats, however, their presence was dependent upon the serum concentration. Crystals were found in non-pregnant female rats with serum CYA concentrations above 54 μg/mL, whereas in pregnant rats that concentration rose to 152 μg/mL (Tables 6 and 7).
The average accuracy of the method to detect melamine and cyanuric acid at levels of 1.6 ppm, 4 ppm, and 25 ppm in serum and amniotic fluid ranged from 101–106% and 99–107%, respectively. The RSD% ranged from 2% to 7% for serum and 2–8% for amniotic fluid.
4. Discussion
Understanding the effect of repeated administration of triazines such as melamine and cyanuric acid in pregnant animals is important for determining the risk these compounds pose to the dam and to the fetus. Critical reviews of the USFDA risk assessments performed during 2007 and 2008 have remarked on the general lack of information about effects on the developing fetus (USFDA, 2009). The current study was initiated to assess serum and amniotic fluid concentrations of melamine and cyanuric acid following repeated dosing as well as the effects of these compounds on renal crystal formation and renal function in the dam and on fetal development.
4.1. Crystal formation
Crystal formation as determined by wet mount analysis was extensive in 23 of 24 MEL-treated rats and 4 of the 22 CYA-treated rats (Tables 6 and 7 and Figs. 1–3). It is important to note that the crystals found in the kidneys of rats exposed to these high doses of MEL and CYA (1000 mg/kg BW/day) are very different from the golden brown spherical melamine–cyanurate crystals present in animals exposed to a combination of MEL + CYA (see Reimschuessel et al., 2008; Stine et al., 2011; or Sprando et al., 2012 for figures of typical melamine–cyanurate crystals). The massive intrarenal obstruction caused by the rectangular MEL or CYA crystals undoubtedly contributed significantly to reduced renal function, serum concentrations, and alterations in reproductive indices in these animals.
The histopathology lesions of tubular dilation with cellular necrosis correlated well with the presence of renal crystals by wet mount. The absence of crystals, MEL or CYA, in any of the hematoxylin and eosin sections is explained by the experiment showing that those crystals dissolve rapidly in the presence of formalin. The fact that triazine crystals dissolve when tissues are preserved in formalin was first reported in 2008 (Reimschuessel et al., 2008); however, studies continue to be reported in which investigators fail to do wet mounts to evaluate tissues for crystal presence. In the case of melamine–cyanurate crystals, some of these crystals do persist despite formalin fixation, but wet mount evaluation provides a much more sensitive assay of crystal formation in experimental animals. Further, tubular dilation is one of the most consistent histological features of crystal nephropathy.
Crystalline nephropathies occur in multiple settings including, dysproteinemeia, drug inducement, calcium deposition, and metabolic disturbances. Drugs such as sulfa drugs, acyclovir and indinavir, are known to cause crystals (Herlitz et al., 2012). In the case of indinavir, distal tubular casts show needle-shaped crystalline spaces within proteinaceous luminal casts remaining where the actual crystal dissolved during processing. Uric acid crystals are also known to dissolve in formalin, leaving what is described as “empty lacunae” (Herlitz et al., 2012; Conger et al., 1976). Oxalate nephropathy, which can either arise due to ingestion of ethylene glycol or due to metabolic defects, can also produce intratubular crystals, which cause renal failure. The prominent cellular organic matrix that surrounds the crystals, and remains once the crystal is dissolved, is described as a crystal “ghost,” (Khan et al., 1983; Khan and Hackett, 1987). Specifically, the ghosts are defined as “a lacuna surrounded by a delimiting membrane” (Khan et al., 1983). These residual eosinophilic ghosts are quite similar in appearance to the structures found in Fig. 9. The crystals that formed in the rats treated with high doses of MEL have such organic matrices forming ghost lacunae.
The fact that MEL and CYA crystals dissolve so rapidly in formalin explains some of the findings reported by researchers who included histopathology, but neglected to conduct wet-mount analysis on fresh specimens. The histology of the 1983 National Toxicology Program (NTP) study on melamine was re-evaluated in 2009 by Hard et al. The authors reported tubular dilatation and a retrograde nephropathy presumably caused by tubular obstructions due to melamine. Ogasawara et al.’s study in 1995 reported observing crystals grossly, but not by histopathology. The findings of both of these studies can be understood in light of the fact that formalin dissolves the crystals in kidneys of the rats treated with high doses of MEL. In a more recent study, Early et al. (2013) gave very high doses of MEL to rats and monkeys. The authors refer to crystals in the manuscript, however, no images of those crystals are shown. The authors do show crystal ghosts and tubular dilation similar to those presented in our current study. Early et al.’s Fig. 2 shows rectangular-shaped dilated tubules, Early’s Fig. 3 lower arrow shows an eosinophilic ghost in the lumen and Early’s Fig. 8 shows 2 tubule lumens containing rectangular ghosts. Urinalysis in the treated monkeys revealed crystals that “were neither oxalic nor phosphatic crystals.” The crystals were not further characterized. It is highly probable that the crystals were composed of MEL similar to the crystals identified in our study.
Fig. 8.

Hematoxylin and eosin sections of kidneys of rats treated with vehicle (control), MEL, or CYA at 1000 mg/kg BW/day. Control kidneys are normal in appearance. Many renal tubules of the MEL-treated rats are dilated with deformed rectangular edges left by the dissolved crystals (*). No control animals had tubules containing right angle walls. Some glomeruli contain eosinophilic material and have dilated Bowman’s space (arrow). Similar lesions are found in the CYA-treated rat kidneys that contained crystals by wet mount. Bars = 50 μm, low magnification is on the left, higher magnification of the same section is on the right.
4.2. Serum
MEL serum concentrations were high (32.1–766.7 μg/ml) in both pregnant and non-pregnant rats administered 1000 mg/kg BW/day. We did not find a statistical difference in the two groups, but this could be due to low numbers analyzed as several pregnant rats were taken off the study early. The MEL concentrations in those rats, if they had survived until the end of the study, may have affected the statistical outcome. However, almost all of the rats, whether pregnant or not, had extensive renal crystals and, therefore, reduced renal function due to intratubular obstruction resulting in elevated serum MEL concentrations. The findings presented by Chu et al. (2013) support our data, as they did not find differences in the pharmacokinetic parameters of non-pregnant and GD20 pregnant rats given single bolus doses of melamine.
The CYA serum values in non-pregnant rats ranged from 2.3 to 173.2 μg/mL with renal crystals present in the rats that had the 2 highest concentrations. Pregnant rats had serum CYA concentrations of 10.8–313.7 μg/mL and again, the rats with crystals on wet mount had the 2 highest serum concentrations. The elevated serum concentrations are most likely due to the fact that crystals obstructed renal tubules and effectively stopped renal excretions. Previous studies have shown that CYA, when administered orally, has a lower area under the curve (AUC) than MEL in female rats (1375 versus 1992 ng-h/ml: Jacob et al., 2012). This parameter, in addition to a shorter half-life (0.99 versus 1.92 h: Jacob et al., 2012), would account for lower concentrations of CYA compared with MEL in the serum of our study rats, especially those CYA-treated rats without crystals. It is likely that the crystals impeded this rapid excretion. It is also possible that, in a positive feedback type system, an elevated serum concentration initiated the formation of renal crystals, which subsequently blocked flow and resulted in less excretion and even higher serum CYA.
4.3. Amniotic fluid
Not surprisingly, our study confirms previous reports of melamine transplacental carriage (Jingbin et al., 2010; Chu et al., 2010; Chan et al., 2011). However, our study provides evidence of a similar pathway for cyanuric acid as well. Concentrations of CYA in the amniotic fluid corresponded well to maternal serum concentrations. Correlation did not hold for MEL concentrations, however, perhaps because of a low sample number as we were not able to collect amniotic fluid from several MEL pregnant rats. The lack of correlation may also reflect a differential role of some as yet unknown efflux transporters as Partanen et al. (2012) provided evidence that melamine is not a substrate for the ABC transporters ABCB1, ABCC2, or ABCG2 in Madin–Darby Canine Kidney (MDCK) cells. In a repeated dosing experiment similar to ours, Jingbin et al. (2010) did not detect melamine in amniotic fluid when pregnant rats were given low doses of melamine (40 mg/kg BW) from GD13 to GD20; however, melamine was detected when rats were given higher doses (400 mg/kg BW). In contrast to our data, which suggests comparable concentrations in amniotic fluid and maternal serum, Jingbin et al. (2010) measured amniotic fluid concentrations approximately 17% that of maternal serum. As our dose of melamine was over twice as high as the previous experiment (1000 mg/kg versus 400 mg/kg), it is possible that fluid and compound influx and efflux mechanisms were overloaded in our system.
4.4. Developmental effects
Not only do high levels of melamine induce maternal toxicity (as evidenced by weight loss, reduced feed consumption, etc.), melamine exposure also causes negative developmental effects. Although implant efficiency was consistent across treatments (not surprisingly, as treatment did not begin until GD10), the number of early and late deaths present at GD20 was increased in the MEL-treated animals. Litter size, average fetal body weight, and average crown rump length were all significantly lower in the melamine group compared with not only the controls but also the cyanuric acid group. Further, approximately half of the live fetuses in the MEL-treated group were runts. Kim et al. (2011) also found a decrease in fetal weight compared with controls, but did not observe changes in fetal deaths or litter size. Our differing results may stem from our higher dose of melamine (1000 mg/kg BW/day versus 800 mg/kg BW/day). Jingbin et al. (2010) did not find any differences in MEL-treated F344 rats versus controls regarding maternal body weight, number of fetuses, or fetal weight, but their highest gavage dose (400 mg MEL/kg BW/day for 7 days) was less than half the dose in the current study. Strain differences may have affected results as Jingbin et al.’s (2010) F344 control rats had approximately 6.5 fetuses per litter whereas the control Charles River dams in the current study had approximately 12.5 fetuses per litter, so the power to detect differences in litter size would be higher using a more fecund strain. Hellwig (1996, as referenced in UNEP 2002) also did not find any developmental toxicity at 1060 mg MEL/kg BW/day dosed for 10 days, however, the Wistar rats were fed diet with melamine and Sprando et al. (2012) has previously shown that melamine’s toxicity profile is more pronounced in gavaged animals than those dosed with MEL mixed into feed. Finally, Melnick et al. (1984) did not report any microscopically-observed pathology in the ovaries or uteri of F344 rats given MEL in feed.
We suspect the developmental reproductive effects observed in the current study were likely due to renal failure in the dams as opposed to direct effects of melamine on the developing fetus. The MEL-treated dams and the 4 CYA-treated dams with renal crystals had elevated BUN and creatinine indicating renal failure. When Kim et al. (2011) exposed rats to lower doses of melamine only, they concluded that melamine was only fetotoxic at maternotoxic doses, which would support the proposal that the developmental effects on the fetus were indirectly caused through renal failure, not by direct action of the compound. Further, Tan et al. (2006) has reported early deaths, low birth weight, and fetal anomaly in women with end-stage renal failure.
Compared with controls, cyanuric acid did not appear to have an effect on any of the reproductive indices we investigated in the current study.
Concern that fetuses and neonates could be at greater risk have been expressed, however preliminary data suggest neonates may be less susceptible to the effects of these compounds (Chu et al., 2010; Partanen et al., 2012; Gamboa da Costa et al., 2013). In a previous study (unpublished data, Sprando), we evaluated kidneys by wet-mount and histology of 7 fetuses and 3 neonates from dams exposed to 1000 mg MEL/kg BW/ day and 22 fetuses and 31 neonates from dams exposed to 1000 mg CYA/kg BW/day. Because all findings were negative, we did not evaluate fetal kidneys in the current study. Anatomical nephrogenesis begins at 12.5 days gestation in the rat and completes 4–6 weeks postnatally, whereas human nephrogenesis is complete before birth (Zoetis and Hurtt, 2003; Suzuki, 2009). Functionally, glomerular filtration rate and concentrating ability are decreased and essentially non-existent, respectively, in neonatal rats and humans (Zoetis and Hurtt, 2003). Therefore it is not surprising that we did not find melamine or cyanuric acid crystals in fetal or neonatal rat kidneys as the kidneys were not functioning as concentrating excretory organs capable of creating obstructive crystals.
4.5. Conclusions
We have found that high doses of melamine and cyanuric acid given separately form renal crystals with morphology differing from the melamine–cyanurate crystals found during the pet food contamination crisis in 2007. Of note, Raman spectroscopy indicates the crystals in our study are predominantly singular in nature (e.g., MEL or CYA alone), thus differing from the melamine-uric acid calculi found in Chinese children’s kidneys, ureters, and bladders in 2008. Similarly to the pet food and milk contamination crises, the crystal nephropathy due to single triazine exposure does cause renal failure. Extensive crystal formation in the MEL-treated dams caused renal compromise as measured by elevated BUN, creatinine, and renal weight. These parameters were also elevated in the 4 CYA-treated rats that developed crystals. We found this renal failure causes reproductive toxicities. Specifically, MEL-treated dams had higher early and late deaths than controls or CYA-treated dams. As melamine was found in the amniotic fluid, this study confirms transfer of melamine from mammalian mother to fetus. Additionally, our study provides evidence that cyanuric acid also appears in the amniotic fluid if mothers are exposed to high doses.
Footnotes
Conflict of Interest
The authors declare that there are no conflicts of interest.
Transparency Document
The Transparency document associated with this article can be found in the online version.
References
- Chan JY, Lau CM, Ting TL, Mak TC, Chan MH, Lam CW, Ho CS, Wang CC, Fok TF, Fung KP, 2011. Gestational and lactational transfer of melamine following gavage administration of a single dose to rats. Food Chem. Toxicol 49 (7), 1544–1548. [DOI] [PubMed] [Google Scholar]
- Cheng Y, Dong YY, Wu JH, Yang XR, Bai H, Zheng HY, Ren DM, Zou YD, Li M, 2010. Screening melamine adulterant in milk powder with laser Raman spectrometry. J. Food Compos. Anal 23 (2), 199–202. [Google Scholar]
- Chu CY, Chu KO, Chan JY, Liu XZ, Ho CS, Wong CK, Lau CM, Ting TL, Fok TF, Fung KP, Wang CC, 2010. Distribution of melamine in rat foetuses and neonates. Toxicol. Lett 199 (3), 398–402. [DOI] [PubMed] [Google Scholar]
- Chu CY, Chu KO, Ho CS, Kwok SS, Chan HM, Fung KP, Wang CC, 2013. Melamine in prenatal and postnatal organs in rats. Reprod. Toxicol 35, 40–47. [DOI] [PubMed] [Google Scholar]
- Conger JD, Falk SA, Guggenheim SJ, Burke TJ, 1976. A micropuncture study of the early phase of acute urate nephropathy. J Clin. Invest 58 (3), 681–689. [DOI] [PMC free article] [PubMed] [Google Scholar]
- Early RJ, Yu H, Mu XP, Xu H, Guo L, Kong Q, Zhou J, He B, Yang X, Huang H, Hu E, Jiang Y, 2013. Repeat oral dose toxicity studies of melamine in rats and monkeys. Arch. Toxicol 87 (3), 517–527. [DOI] [PubMed] [Google Scholar]
- Gamboa da Costa G Loukotková L, VonTungeln LS, Olson G, Sprando RL, Hattan DG, Stine CB, Reimschuessel R, Beland FA, 2013. Nephrotoxicity of melamine, cyanuric acid, and their combination in newborn F344 rats. 52nd annual meeting of the society of toxicology, San Antonio, TX, March 10–14. [Google Scholar]
- Hard GC, Flake GP, Sills RC, 2009. Re-evaluation of kidney histopathology from 13-week toxicity and two-year carcinogenicity studies of melamine in the F344 rat: morphologic evidence of retrograde nephropathy. Vet. Pathol 46 (6), 1248–1257. [DOI] [PubMed] [Google Scholar]
- He L, Liu Y, Lin M, Awika J, Ledoux DR, Li H, Mustpha A, 2008. A new approach to measure melamine, cyanuric acid, and melamine cyanurate using surface enhanced Raman spectroscopy coupled with gold nanosubstrates. Sens. Instrum. Food Qual. Saf 2 (1), 66–71. [Google Scholar]
- Hellwig J, 1996. Melamine – Prenatal Toxicity in Wistar Rats after Oral Administration (Diet). unpublished report. Testing laboratory: BASF AG, Department of Toxicology. Study number: 32R0242/94007 Report date: 1996–04–15.
- Herlitz LC, D’Agati VD, Markowitz GS, 2012. Crystalline nephropathies. Arch. Pathol. Lab. Med 136 (7), 713–720. [DOI] [PubMed] [Google Scholar]
- Ingelfinger JR, 2008. Melamine and the global implications of food contamination. N. Engl. J. Med 359 (26), 2745–2748. [DOI] [PubMed] [Google Scholar]
- Jacob CC, Von Tungeln LS, Vanlandingham M, Beland FA, Gamboa da Costa G, 2012. Pharmacokinetics of melamine and cyanuric acid and their combinations in F344 rats. Toxicol. Sci 126 (2), 317–324. [DOI] [PMC free article] [PubMed] [Google Scholar]
- Jingbin W, Ndong M, Kai H, Matsuno K, Kayama F, 2010. Placental transfer of melamine and its effects on rat dams and fetuses. Food Chem. Toxicol 48 (7), 1791–1795. [DOI] [PubMed] [Google Scholar]
- Khan SR, Hackett RL, 1987. Crystal-matrix relationships in experimentally induced urinary calcium oxalate monohydrate crystals, an ultrastructural study. Calcified Tissue Int 41 (3), 157–163. [DOI] [PubMed] [Google Scholar]
- Khan SR, Finlayson B, Hackett RL, 1983. Stone matrix as proteins adsorbed on crystal surfaces: a microscopic study. Scan Electron. Microsc. Pt 1, 379–385. [PubMed] [Google Scholar]
- Kim SH, Lee IC, Lim JH, Shin IS, Moon C, Kim SH, Park SC, Kim HC, Kim JC, 2011. Effects of melamine on pregnant dams and embryo-fetal development in rats. J. Appl. Toxicol 31 (6), 506–514. [DOI] [PubMed] [Google Scholar]
- Koglin E, Kip BJ, Meier RJ, 1996. Adsorption and displacement of melamine at the Ag/electrolyte interface probed by surface-enhanced Raman microprobe spectroscopy. J. Phys. Chem 100 (12), 5078–5089. [Google Scholar]
- Melnick RL, Boorman GA, Haseman JK, Montali RJ, Huff J, 1984. Urolithiasis and bladder carcinogenicity of melamine in rodents. Toxicol. Appl. Pharmacol 72, 292–303. [DOI] [PubMed] [Google Scholar]
- NTP, 1983. Carcinogenesis bioassay of melamine (CAS No. 108-78-1) in F344/N rats and B6C3F1 mice (feed study). Research Triangle Park, NC, and Bethesda, MD, United States Department of Health and Human Services, Public Health Service, National Institutes of Health, National Toxicology Program (NTP Technical Report Series No. 245; NTP-81–86; NIH Publication No. 83–2501; <http://ntp.niehs.nih.gov/ntp/htdocs/LT_rpts/tr245.pdf>).
- Ogasawara H, Imaida K, Ishiwata H, Toyoda K, Kawanishi T, Uneyama C, Hayashi S, Takahashi M, Hayashi Y, 1995. Urinary bladder carcinogenesis induced by melamine in F344 male rats: correlation between carcinogenicity and urolith formation. Carcinogenesis 16, 2773–2777. [DOI] [PubMed] [Google Scholar]
- Partanen H, Vähäkangas K, Woo CS, Auriola S, Veid J, Chen Y, Myllynen P, El Nezami H, 2012. Transplacental transfer of melamine. Placenta 33 (1), 60–66. [DOI] [PubMed] [Google Scholar]
- Puschner B, Reimschuessel R, 2011. Toxicosis caused by melamine and cyanuric acid in dogs and cats: uncovering the mystery and subsequent global implications. Clin. Lab. Med 31, 181–199. [DOI] [PubMed] [Google Scholar]
- Reimschuessel R, Gieseker CM, Miller RA, Ward J, Boehmer J, Rummel N, Heller DN, Nochetto C, de Alwis GK, Bataller N, Andersen WC, Turnipseed SB, Karbiwnyk CM, Satzger RD, Crowe JB, Wilber NR, Reinhard MK, Roberts JF, Witkowski MR, 2008. Evaluation of the renal effects of experimental feeding of melamine and cyanuric acid to fish and pigs. Am. J. Vet. Res 69, 1217–1228. [DOI] [PubMed] [Google Scholar]
- Sprando RL, Reimschuessel R, Stine CB, Black T, Olejnik N, Scott M, Keltner Z, Bandele O, Ferguson M, Nemser SM, Tkachenko A, Evans E, Crosby T, Woodling K, Loukotková L, da Costa GG, 2012. Timing and route of exposure affects crystal formation in melamine and cyanuric exposed male and female rats: gavage vs. feeding. Food Chem. Toxicol 50 (12), 4389–4397. [DOI] [PMC free article] [PubMed] [Google Scholar]
- Stine CB, Reimschuessel R, Gieseker CM, Evans ER, Mayer TD, Hasbrouck NR, Tall E, Boehmer J, da Costa GG, Ward JL, 2011. A no observable adverse effects level (NOAEL) for pigs fed melamine and cyanuric acid. Reg. Tox. Pharm 60 (30), 363–372. [DOI] [PMC free article] [PubMed] [Google Scholar]
- Stine CB, Nochetto CB, Evans ER, Gieseker CM, Mayer TD, Hasbrouck NR, Reimschuessel R, 2012. Depletion of melamine and cyanuric acid in serum from catfish Ictalurus punctatus and rainbow trout Onchorhynchus mykiss. Food Chem. Toxicol 50 (10), 3426–3432. [DOI] [PMC free article] [PubMed] [Google Scholar]
- Suzuki M, 2009. Children’s toxicology from bench to bed–Drug-induced renal injury (4): effects of nephrotoxic compounds on fetal and developing kidney. J. Toxicol. Sci 34 (Suppl 2), SP267–71. [DOI] [PubMed] [Google Scholar]
- Tan LK, Kanagalingam D, Tan HK, Choong HL, 2006. Obstetric outcomes in women with end-stage renal failure requiring renal dialysis. Int. J. Gynaecol. Obstet 94 (1), 17–22. [DOI] [PubMed] [Google Scholar]
- UNEP Chemicals. OECD screening information dataset (SIDS) – melamine [Internet]. Geneva (Switzerland): UNEP Chemicals, 2002. June (cited 16.09.13), 198pp. <http://www.chem.unep.ch/irptc/sids/OECDSIDS/108781.pdf>. [Google Scholar]
- USFDA. 2001. Guidance for Industry #145: Bioanalytical method validation United States Food and Drug Administration, 25pp. <http://www.fda.gov/downloads/Drugs/GuidanceComplianceRegulatoryInformation/Guidances/UCM070107.pdf> (accessed 07.2012). [Google Scholar]
- USFDA 2009. External Peer Review of the FDA/CFSAN Draft Report Interim Safety and Risk Assessment of Melamine and its Analogues in Food for Humans (October 3, 2008) and Update (November 28, 2008) <http://www.fda.gov/Food/FoodborneIllnessContaminants/ChemicalContaminants/ucm174165.htm> (accessed 8.2013).
- WHO (World Health Organization), 2008. Toxicological and Health Aspects of Melamine and Cyanuric Acid. Report of a WHO Expert Meeting In collaboration with FAO <http://whqlibdoc.who.int/publications/2009/9789241597951_eng.pdf>.
- Xia X, Ding S, Li X, Gong X, Zhang S, Jiang H, Li J, Shen J, 2009. Validation of a confirmatory method for the determination of melamine in egg by gas chromatography-mass spectrometry and ultra-performance liquid chromatography-tandem mass spectrometry. Anal. Chim. Acta 651 (2), 196–200. [DOI] [PubMed] [Google Scholar]
- Zoetis T, Hurtt ME, 2003. Species comparison of anatomical and functional renal development. Birth Defects Res. B Dev. Reprod. Toxicol 68 (2), 111–120. [DOI] [PubMed] [Google Scholar]