

Abstract
Passive laboratory-based surveillance data from Alberta Agriculture Food and Rural Development were analyzed for common Salmonella serovars, prevalences, trends, and for the presence of temporal clusters. There were 1767 isolates between October 1990 and December 2001 comprising 63 different serovars, including 961 isolates from chickens, 418 from cattle, 108 from pigs, 102 from turkeys, and 178 from all other species combined. Salmonella Typhimurium, Heidelberg, Hadar, Kentucky, and Thompson were the 5 most frequently isolated serovars. Approximately 60% of the S. Typhimurium were isolated from cattle, whereas over 90% of the S. Heidelberg, Hadar, Kentucky, and Thompson were isolated from chickens. Salmonella Enteritidis was rarely isolated. There was an increasing trend in isolates from chickens, cattle, and pigs, and a decreasing trend in isolates from turkeys. Temporal clusters were observed in 11 of 15 serovars examined in chickens (S. Anatum, Heidelberg, Infantis, Kentucky, Mbandaka, Montevideo, Nienstedten, Oranienburg, Thompson, Typhimurium, and Typhimurium var. Copenhagen), 5 of 5 serovars in cattle (S. Dublin, Montevideo, Muenster, Typhimurium, and Typhimurium var. Copenhagen), and 1 of 3 serovars in pigs (S. Typhimurium). Short-duration clusters may imply point source infections, whereas long-duration clusters may indicate an increase in the prevalence of the serovar, farm-to-farm transmission, or a wide-spread common source. A higher concentration of clusters in the winter months may reflect greater confinement, reduced ventilation, stressors, or increased exposure to wildlife vectors that are sharing housing during the winter. Detection of large clusters of Salmonella may have public health implications in addition to animal health concerns.
Résumé
Dans le cadre d’une surveillance passive de Salmonella, les résultats obtenus par les laboratoires du «Alberta Agriculture Food and Rural Development» ont été analysés pour déterminer les sérovars fréquents, les prévalences, les tendances et la possibilité de regroupements temporels. Durant la période de octobre 1990 à décembre 2001, un total de 1767 isolats fut obtenu, représentant 63 sérovars différents et répartis comme suit : 961 isolats provenant de poulets, 418 de bovins, 108 de porcs, 102 de dinde et 178 d’espèces diverses. Les cinq sérovars les plus fréquents étaient Salmonella Typhimurium, Heidelberg, Hadar, Kentucky et Thompson. Environ 60 % des isolats de Salmonella Typhimurium provenaient des bovins, alors que plus de 90 % des isolats de Salmonella Heidelberg, Hadar, Kentucky et Thompson provenaient de poulets. Salmonella Enteritidis a rarement été isolé. Une augmentation des isolats provenant des poulets, bovins et porcs a été notée alors que pour les isolats provenant des dindes une tendance à la baisse était notée. Des regroupements temporels ont été observés pour 11 des 15 sérovars examinés chez les poulets (Salmonella Anatum, Heidelberg, Infantis, Kentucky, Mbandaka, Montevideo, Nienstedten, Oranienburg, Thompson, Typhimurium et Typhimurium var. Copenhagen), 5 des 5 sérovars de bovins (Salmonella Dublin, Montevideo, Muenster, Typhimurium et Typhimurium var. Copenhagen), et 1 des 3 sérovars provenant de porcs (Salmonella Typhimurium). Des regroupements de courte durée peuvent indiquer une source d’infection ponctuelle, alors que des regroupements de longue durée peuvent indiquer une augmentation de la prévalence du sérovar, une propagation entre les fermes ou une contamination extensive à partir d’une source commune. Une plus grande concentration de regroupements durant les mois d’hiver peut refléter un plus grand confinement des animaux, une diminution de la ventilation, des facteurs de stress ou une augmentation de l’exposition à des vecteurs provenant de la faune partageant les bâtiments durant l’hiver. La détection de regroupements importants de Salmonella peut avoir des implications en santé publique en plus d’être une préoccupation pour la santé des animaux.
(Traduit par Docteur Serge Messier)
Introduction
Salmonella is an important pathogenic organism in both humans and animals (1). Host-adapted serovars (S. Dublin in cattle and S. Pullorum in chickens) often cause severe illness in infected herds or flocks, and may also result in illness in humans (outbreaks of S. Dublin have occurred due to the ingestion of contaminated raw or improperly treated milk) (2). Subclinical infection is common and many animals become asymptomatic carriers, intermittently shedding the bacteria into the environment for variable periods of time (2,3). The latter situation is particularly important in the transmission of salmonellae (2).
Data from enteric disease surveillance in Canada have been used to examine temporal variations of Salmonella serovars from both humans and animals. From 1985 to 1995, the total number of Salmonella isolates from non-human sources increased (4), while between 1990 and 1999, the overall number remained fairly steady (5). However, trends for individual serovars may deviate from this pattern. For example, the annual number of S. Typhimurium isolates from non-human sources steadily declined from 1983 to 1995 (1,4), while the annual number of S. Heidelberg isolates rose substantially between 1983 and 1999 (1,4,5). Annual numbers of S. Hadar isolates generally increased between 1983 and 1995, but fluctuated considerably with peaks in the late 1980’s and mid-1990’s (1,4); however, the trend after 1995 showed a continual decline (5).
A seasonal trend, with higher rates in the summer and fall, was noted by Pollari and Powers (4) when Salmonella isolates from non-human sources in 1995 were examined. However, when Canadian surveillance data were evaluated over a longer period (1996 to 1999), the seasonal distribution showed multiple peaks in all years (5), demonstrating that when inspected over a long enough period of time, the seasonal distributions of Salmonella from non-human sources do not necessarily follow a distinct pattern.
Few studies (6,7) have quantitatively explored the spatial and temporal distributions of Salmonella serovars in animals. While classifying Salmonella isolates by serovar has been useful as a way of following trends over time (8), it may also be useful in identifying common isolates that cluster over time or space. A temporal cluster is a group of isolates of a particular serovar that aggregate together in time. It may be differentiated from a seasonal pattern in that the increase in isolates may not necessarily occur repeatedly at the same time from year to year. Thus, identifying clusters can provide information that may be used to establish possible causes of the disease and methods that can be used for control and prevention (9). Our main objective was to identify temporal clusters of Salmonella serovars in animals in the province of Alberta by examining isolates reported through passive laboratory-based surveillance systems between 1990 and 2001. In addition, within each animal species, we aimed to summarize serovar prevalence and, where possible, describe long-term trends and seasonal patterns for all serovars combined and for the most commonly isolated serovars.
Materials and methods
The data were extracted from 3 computer systems in Alberta Agriculture, Food and Rural Development (AAFRD), including the Animal Health Information System (AHIS), the Animal Health Surveillance System (ANHSURS), and the Passive Animal Health Surveillance System (PAHSS) databases. The AHIS data set included diagnostic cases where samples were submitted for Salmonella culture, as well as submissions from the Poultry Health Program (PHP), from October 1990 to December 1997. The PHP Salmonella cases were those associated with the Canadian Food Inspection Agency activities and the AAFRD S. Gallinarum and S. Pullorum eradication program, and included samples from both the birds and their environment. After 1997, the laboratory system in Alberta became privatized and new systems were implemented. Thus, 4 separate files were contained within the ANHSURS data set from 1998 to 2001. These included: 1) disease investigations; 2) diagnostic cases; 3) PHP cases; and 4) quality assurance cases. Disease investigations were diagnostic cases with at least 1 follow-up investigation per case. Quality assurance submissions were cases in which a practicing veterinarian requested post-mortem assistance. The PAHSS data set contained records from 1 private diagnostic laboratory on Salmonella cases collected through passive surveillance between February 1998 and December 2001, and privatized poultry cases (commercial poultry cases) from February 2000 to August 2001.
Over the course of the study period, Salmonella culture protocols varied by laboratory, sample purpose (diagnostic versus PHP), and sample type (fecal/intestine/reproductive tract, other organs, feed, etc.). There were 4 laboratories until 1996, including the main reference laboratory in Edmonton, and each was technically independent of the Edmonton lab. In 1996, there were 2 laboratories that used the same protocols. Then in 2000, they became a single laboratory (Rashed Cassis, 2004, personal communication). Samples to be tested for Salmonella spp. were processed according to Standard Operating Procedures used by Agri-Food Laboratories Branch, Food Safety Division of AAFRD. Throughout the study period, all laboratories used at least one type of enrichment media for both diagnostic and PHP samples. Briefly, in the early to mid-1990’s, pre-enrichment and selective media included selenite broth, selenite then rappaport broth, selenite cystine (Oxoid Ltd., Basingstoke, United Kingdom) then rappaport broth, peptone-glucose then rappaport broth, or buffered peptone (Difco, Detroit, Michingan, USA) then tetrathionate broth (Difco). From 1996 onward, additional enrichment media included tryptic soy broth (Difco), tryptic soy then selenite broth, or buffered peptone to each of selenite and tetrathionate broth. Culture plates used over the years included: 1) hektoen, bismuth sulfite, and brilliant green agar (Difco) (1992 and earlier); 2) hektoen and brilliant green agar (1994); 3) XLT4 (Difco) and rambach agar (1996 onward); and 4) rappaport-vassiliadis semi-solid media specifically for the S. Enteritidis protocol (Difco) (1998) (Rashed Cassis, 2004, personal communication). After incubation, viable colonies were biochemically and serologically confirmed as Salmonella species. Standard culture protocols used by the Agri-Food Laboratories Branch to isolate Salmonella from fecal and environmental samples have been described elsewhere (10).
Salmonella taxonomy and nomenclature
Salmonella taxonomy and nomenclature used in this study follow the scheme provided by the World Health Organization Collaborating Centre for Reference and Research on Salmonella (11). Isolates that were reported using “O” and “H” antigenic formulas, or as “serologically rough,” were denoted as “antigenic,” except for S. enterica subspecies arizonae, diarizonae, and houtenae, where these were specified in the data set.
Data management
Data manipulation was performed with commercial software (Microsoft Excel, 2000; Microsoft Corporation, Redmond, Washington, USA) (12). Our intent was to identify multi-farm clusters throughout the province rather than clusters in a single herd or flock. Hence, the data within each file were examined for duplicate case numbers, serovars, and phagetypes (where available), with the goal of collapsing the data such that each unique case number contained 1 Salmonella serovar cultured from submissions received from 1 location on 1 day. If more than 1 serovar was isolated, both were included. It was not possible to ascertain whether the samples were submitted from the same location more than once during a 30-day period, as the data did not include the identification of individual farms (this was due to privacy issues), with the exception of the diagnostic case file of the AHIS data set. In this file, if more than 30 d had elapsed between the original and follow-up cases, both were included in the data set. If a different serovar was identified in the follow-up case, it was also included in the data set. In circumstances where it was not possible to definitively identify the original case, the follow-up case was included.
Analysis
Long-term trends and seasonal patterns in Salmonella isolates from all non-human sources combined, from each animal species, and from the more common serovars within each animal species, were evaluated by plotting a 5-month rolling average of the number of isolates followed by visual inspection of the graphs. A 5-month rolling average was chosen to facilitate visualization of the data; this was calculated by adding the number of isolates reported each month with isolates reported in the preceding and subsequent 2 mo, then dividing by 5.
In addition to graphical evaluation, least squares regression (Stata Statistical Software, Release 7.0; Stata Corporation, College Station, Texas, USA) (13) was used with the chicken and cattle data in order to characterize the effect of year (trend) and month (pattern) on the number of isolates reported within each species (all serovars combined). Year and month were treated as categorical independent variables. For each species, the year and month with the highest number of isolates was used as the referent group. The assumptions of least squares were examined using residual plots and the Shapiro-Wilk (14) and Cook-Weisberg (15) tests. A significance level of 5% was set. For the swine and turkey data, regression analyses were not conducted due to the small number of isolates reported. Instead, for each of these species, the total number of isolates (all serovars combined) were summed per year and, separately, per month, and inspected graphically.
Cluster detection software (SaTScan, version 3.0; National Cancer Institute, Bethesda, Maryland, USA) (16) was used to test the null hypothesis that, within a group of animals, Salmonella serovars are randomly distributed with respect to time. The software uses the temporal scan statistic and conditions on the total number of cases and controls in the data set (17), thus identifying clusters of isolates over and above any background trends and seasonal patterns. The Bernoulli model for event data was used, where the temporal distribution of cases is contrasted with that of a control group. A case was defined as an isolate of a specific serovar within each animal species, while the control group included all isolates except the serovar of interest within the same species during the same time period.
The temporal scan statistic has a window that moves over time (17). The window examines every possible time period in accordance with the size of the scanning window specified. For each scanning window, the alternative hypothesis is that there is an elevated risk of a specific serovar within the window compared to outside the window. Significance testing for the most likely cluster is based on the likelihood ratio test, whose P-value is acquired through Monte Carlo simulations (18). A P-value of < 0.05 was deemed significant. The absence of a statistically significant cluster implies that the temporal distribution of the serovar of interest was not different from the temporal distribution of all other serovars. For our study, serovars that comprised ≥ 1% of the total number of isolates within a group of animals were analyzed. All dates were collapsed to a monthly basis. One- through 12-month scanning windows were used for cluster detection.
Results
Overall patterns
There were 1767 Salmonella isolates between October 1990 and December 2001, comprising 63 different serovars. Seventeen percent of the isolates were not serotyped. There were 961 isolates from chickens, 418 from cattle, 108 from pigs, 102 from turkeys, and 178 from all other species combined (Table I). The 5 most common serovars were S. Typhimurium (23%), Heidelberg (13%), Hadar (9%), Kentucky (6%), and Thompson (4%). Approximately 60% of the S. Typhimurium were isolated from cattle, whereas over 90% of the S. Heidelberg, Hadar, Kentucky, and Thompson were isolated from chickens. Salmonella Enteritidis was rarely isolated (1%).
Table I.
Number of Salmonella isolates, by serovar and animal group, reported in Alberta between October 1990 and December 2001
| Serovar | Chickens | Cattle | Pigs | Turkeys | Other | Total |
|---|---|---|---|---|---|---|
| Agona | 10 | 0 | 1 | 8 | 1 | 20 |
| Anatum | 10 | 0 | 3 | 7 | 3 | 23 |
| “antigenic” | 22 | 0 | 0 | 1 | 0 | 23 |
| Derby | 0 | 0 | 11 | 0 | 0 | 11 |
| Dublin | 0 | 29 | 0 | 0 | 0 | 29 |
| Enteritidis | 18 | 0 | 3 | 0 | 1 | 22 |
| Hadar | 137 | 0 | 1 | 9 | 3 | 150 |
| Heidelberg | 208 | 1 | 2 | 14 | 1 | 226 |
| Infantis | 11 | 4 | 7 | 0 | 1 | 23 |
| Kentucky | 102 | 0 | 0 | 1 | 0 | 103 |
| Mbandaka | 52 | 0 | 1 | 5 | 4 | 62 |
| Montevideo | 27 | 11 | 0 | 0 | 2 | 40 |
| Muenster | 0 | 25 | 0 | 1 | 5 | 31 |
| Nienstedten | 13 | 1 | 0 | 1 | 0 | 15 |
| Oranienburg | 15 | 0 | 0 | 0 | 1 | 16 |
| Thompson | 69 | 0 | 3 | 2 | 1 | 75 |
| Typhimurium | 76 | 243 | 41 | 1 | 48 | 409 |
| Typhimurium var. Copenhagen | 15 | 22 | 2 | 0 | 4 | 43 |
| Other serovars | 77 | 7 | 13 | 17 | 33 | 147 |
| Unknown serovars | 99 | 75 | 20 | 35 | 70 | 299 |
| Total | 961 | 418 | 108 | 102 | 178 | 1,767 |
Among the isolates from chickens, S. Heidelberg, Hadar, and Kentucky were the most common serovars (22%, 14%, and 11%, respectively). Among cattle, S. Typhimurium was the major serovar (58%). Among pigs, S. Typhimurium was the most common serovar (38%), followed by S. Derby (10%) and Infantis (7%). Although phagetype data were incomplete, at least 19% of the S. Typhimurium and 23% of the S. Typhimurium var. Copenhagen isolates were phagetype 104.
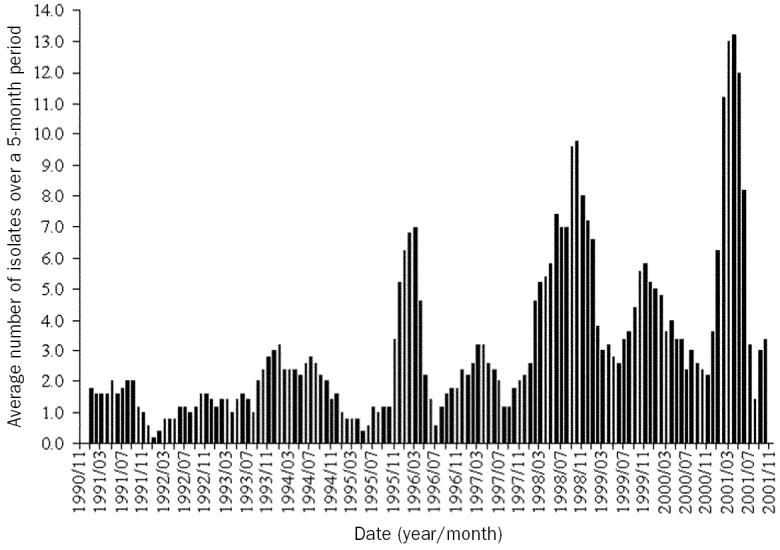
Overall, there appeared to be an increasing trend in the number of isolates reported from non-human sources (Figure 1). Some fluctuation was evident within the study period, with the most obvious peaks occurring in 1998 and 2001. A seasonal pattern was not apparent, as the months with the highest number of isolates differed from year to year.
Figure 1.

Trend in the overall number of Salmonella isolates reported from non-human sources in Alberta between October 1990 and December 2001 (n = 1767). A 5-month rolling average of the number of isolates is presented.
Temporal studies by animal species
Chickens
The median number of reported Salmonella isolates per month was 6 with interquartile ranges of 4 and 10. There appeared to be an overall increasing trend in isolates over the study period (Figure 2); all years except 1992, 1999, 2000, and 2001 had significantly fewer isolates than 1998. February and December had significantly fewer isolates than May. Salmonella Heidelberg isolates increased substantially, especially from early 1996 to 2001 (Figure 3). Salmonella Hadar and Thompson isolates decreased slightly with the largest number occurring in 1992, while S. Kentucky isolates generally increased with a peak in mid-1995. Salmonella Typhimurium isolates increased slightly over the time period, although the levels fluctuated considerably.
Figure 2.

Trend in the overall number of Salmonella isolates reported in chickens in Alberta between October 1990 and December 2001 (n = 961). A 5-month rolling average of the number of isolates is presented.
Figure 3.

Trend in the number of Salmonella Heidelberg isolates reported in chickens in Alberta between October 1990 and December 2001 (n = 208). A 5-month rolling average of the number of isolates is presented. Arrow indicates a significant cluster of isolates.
Results of the cluster detection analysis are summarized in Table II; only clusters significant at the 5% level are reported. Details regarding when the cluster occurred, size of the scanning window used to identify the cluster, number of cases comprising a cluster, number of isolates in the control group during the cluster period, relative risks, and P-values are included. For some serovars (S. Heidelberg), as the size of the scanning window widened, the duration of the cluster lengthened, while for others (S. Anatum), the cluster did not enlarge. For still others (S. Typhimurium var. Copenhagen), clustering at 2 different time periods was noted depending on the size of the scanning window examined. More clusters occurred in the winter months than in the summer months when 1- or 2-month windows were examined. Salmonella Agona, Enteritidis, Hadar, and “antigenic” Salmonella did not have significant clusters (P > 0.05).
Table II.
Temporal clusters of Salmonella serovars isolated from chickens in Alberta between October 1990 and December 2001
| Serovar | Cluster (Start-Finish)a | Scanning window (months) | Cases | Controls | Relative risk | P-valueb |
|---|---|---|---|---|---|---|
| Anatum (n = 10) | 91/11–91/11 | 1–12 | 2 | 2 | 48.1 | 0.012–0.036 |
| Heidelberg (n = 208) | 01/01–01/01 | 1 | 10 | 4 | 3.3 | 0.003 |
| 00/12–01/01 | 2 | 15 | 4 | 3.6 | 0.001 | |
| 00/12–01/02 | 3 | 20 | 8 | 3.3 | 0.001 | |
| 00/12–01/03 | 4, 5 | 22 | 9 | 3.3 | 0.001 | |
| 00/12–01/05 | 6 | 30 | 16 | 3.0 | 0.001 | |
| 01/01–01/07 | 7 | 40 | 32 | 2.6 | 0.001 | |
| 00/12–01/07 | 8 | 45 | 32 | 2.7 | 0.001 | |
| 00/12–01/08 | 9, 10 | 52 | 37 | 2.7 | 0.001 | |
| 00/12–01/10 | 11 | 61 | 48 | 2.6 | 0.001 | |
| 00/12–01/11 | 12 | 63 | 49 | 2.6 | 0.001 | |
| Infantis (n = 11) | 92/04–92/04 | 1, 2 | 2 | 3 | 34.9 | 0.021–0.039 |
| Kentucky (n = 102) | 95/06–95/06 | 1 | 3 | 0 | 9.4 | 0.020 |
| 95/05–95/06 | 2–11 | 6 | 3 | 6.3 | 0.006–0.015 | |
| 94/11–95/10 | 12 | 18 | 43 | 2.8 | 0.006 | |
| Mbandaka (n = 52) | 96/10–97/08 | 11, 12 | 14 | 65 | 3.3 | 0.004–0.005 |
| Montevideo (n = 27) | 98/05–99/01 | 9, 10 | 10 | 95 | 3.4 | 0.043–0.044 |
| 98/05–99/03 | 11, 12 | 11 | 111 | 3.2 | 0.033 | |
| Nienstedten (n = 13) | 91/01–91/01 | 1–11 | 3 | 8 | 20.2 | 0.007–0.033 |
| 91/01–91/12 | 12 | 6 | 66 | 6.2 | 0.020 | |
| Oranienburg (n = 15) | 92/08–92/09 | 2, 3 | 4 | 19 | 11.1 | 0.016–0.019 |
| 93/09–93/12 | 4–6 | 4 | 17 | 12.2 | 0.015–0.016 | |
| 92/08–93/02 | 7 | 6 | 53 | 6.5 | 0.013 | |
| 92/08–93/03 | 8–12 | 7 | 63 | 6.4 | 0.007 | |
| Thompson (n = 69) | 92/10–92/11 | 2 | 8 | 14 | 5.1 | 0.006 |
| 92/09–92/11 | 3 | 11 | 23 | 4.5 | 0.003 | |
| 92/08–92/11 | 4–12 | 13 | 32 | 4.0 | 0.003–0.004 | |
| Typhimurium (n = 76) | 98/02–98/03 | 2 | 6 | 9 | 5.1 | 0.049 |
| Typhimurium var. Copenhagen (n = 15) | 98/12–99/01 | 2, 3 | 4 | 17 | 12.2 | 0.010–0.014 |
| 98/12–99/03 | 4–6 | 5 | 33 | 8.4 | 0.014–0.015 | |
| 00/02–00/08 | 7 | 6 | 54 | 6.4 | 0.015 | |
| 00/02–00/09 | 8, 9 | 7 | 63 | 6.4 | 0.007 | |
| 00/02–00/11 | 10–12 | 8 | 73 | 6.3 | 0.001 |
Dates are reported as year/month
For some clusters, the P-value increased as the scanning window size widened, thus a range of P-values is presented
Cattle
The median number of reported Salmonella isolates per month was 2 with interquartile ranges of 1 and 4. The years 1998 and 2001 had the highest number of isolates, however, 1998 was chosen as the referent year (consistent with the chicken results). There appeared to be an overall increasing trend in isolates over the study period although the levels fluctuated substantially (Figure 4); 1990 through 1997 and 2000 had significantly fewer isolates than 1998. June and July had significantly fewer isolates than April. Salmonella Typhimurium isolates increased, especially during the latter half of the study, although some fluctuation existed throughout the years. Additional serovars were not examined for trends, as fewer than 30 isolates were reported during the study period for all other serovars in cattle. Cluster detection results are summarized in Table III and are interpreted similar to clusters in chickens. Clusters occurred more often in the winter and spring than in other months.
Figure 4.
Trend in the overall number of Salmonella isolates reported in cattle in Alberta between November 1990 and December 2001 (n = 418). A 5-month rolling average of the number of isolates is presented.
Table III.
Temporal clusters of Salmonella serovars isolated from cattle in Alberta between November 1990 and December 2001
| Serovar | Cluster (Start-Finish)a | Scanning window (months) | Cases | Controls | Relative risk | P-valueb |
|---|---|---|---|---|---|---|
| Dublin (n = 29) | 93/11–93/12 | 2 | 5 | 4 | 8.0 | 0.008 |
| 93/11–94/01 | 3 | 6 | 6 | 7.2 | 0.002 | |
| 93/09–93/12 | 4 | 6 | 5 | 7.9 | 0.002 | |
| 93/09–94/01 | 5 | 7 | 7 | 7.2 | 0.001 | |
| 93/07–93/12 | 6 | 7 | 7 | 7.2 | 0.001 | |
| 93/07–94/01 | 7 | 8 | 9 | 6.8 | 0.001 | |
| 93/05–93/12 | 8 | 8 | 8 | 7.2 | 0.001 | |
| 93/05–94/01 | 9–11 | 9 | 10 | 6.8 | 0.001 | |
| 93/05–94/04 | 12 | 10 | 14 | 6.0 | 0.001 | |
| Montevideo (n = 11) | 96/02–96/02 | 1 | 5 | 7 | 15.8 | 0.001 |
| 96/01–96/02 | 2 | 9 | 15 | 14.3 | 0.001 | |
| 96/01–96/03 | 3 | 10 | 19 | 13.1 | 0.001 | |
| 96/01–96/04 | 4–12 | 11 | 22 | 12.7 | 0.001 | |
| Muenster (n = 25) | 98/07–98/07 | 1 | 4 | 1 | 13.4 | 0.001 |
| 98/07–98/08 | 2 | 7 | 8 | 7.8 | 0.001 | |
| 98/07–98/09 | 3 | 10 | 14 | 7.0 | 0.001 | |
| 98/07–98/10 | 4–12 | 14 | 16 | 7.8 | 0.001 | |
| Typhimurium (n = 243) | 01/04–01/04 | 1 | 27 | 1 | 1.7 | 0.001 |
| 01/03–01/04 | 2 | 46 | 1 | 1.7 | 0.001 | |
| 01/03–01/05 | 3 | 56 | 1 | 1.7 | 0.001 | |
| 01/03–01/06 | 4 | 58 | 1 | 1.7 | 0.001 | |
| 01/02–01/06 | 5 | 64 | 2 | 1.7 | 0.001 | |
| 01/01–01/06 | 6 | 65 | 2 | 1.7 | 0.001 | |
| 00/11–01/05 | 7 | 67 | 2 | 1.7 | 0.001 | |
| 00/11–01/06 | 8 | 69 | 2 | 1.7 | 0.001 | |
| 00/11–01/07 | 9 | 70 | 2 | 1.7 | 0.001 | |
| 00/10–01/07 | 10 | 75 | 3 | 1.7 | 0.001 | |
| 01/02–01/12 | 11 | 80 | 4 | 1.6 | 0.001 | |
| 00/06–01/05 | 12 | 81 | 3 | 1.7 | 0.001 | |
| Typhimurium var. Copenhagen (n = 22) | 99/12–00/01 | 2 | 5 | 7 | 7.9 | 0.008 |
| 99/11–00/01 | 3 | 6 | 12 | 6.3 | 0.008 | |
| 99/10–00/01 | 4–11 | 7 | 14 | 6.3 | 0.007–0.009 | |
| 99/02–00/01 | 12 | 11 | 39 | 4.2 | 0.002 |
Dates are reported as year/month
For some clusters, the P-value increased as the scanning window size widened, thus a range of P-values is presented
Pigs
The number of reported isolates showed an overall increasing trend visually, with a large peak in 1998 and a smaller peak in 1993. The trend in S. Typhimurium was similar. Monthly patterns showed fewer isolates in January and July through September. A cluster of 6 isolates of S. Typhimurium was detected between May 2000 and March 2001 using wide (10- through 12-month) scanning windows; this cluster was not revealed with narrower scanning windows. Salmonella Derby and Infantis did not have significant temporal clusters.
Turkeys
The number of reported isolates showed an overall decreasing trend visually, with peaks in 1991, 1993, and 1999. Monthly patterns showed higher numbers of isolates in January and March through May. As more than one-third of the isolates from turkeys were not serotyped (Table I), cluster detection was not performed.
Discussion
There was an overall increasing trend in the number of Salmonella isolates reported between 1991 and 2001. This observation, and the more common serovars isolated, are similar to results of passive surveillance in Canada between 1983 and 1995 (1,4). Given our objectives to identify unusual clusters, long-term changes (trends), and seasonal patterns, one weakness of our study, and of many passive surveillance systems, is the lack of denominator data. Since we had only numerator data, we could not differentiate between a change in the number of isolates because of submission patterns (7) versus a change in the percentage of samples submitted that were positive. Census data indicate that livestock numbers increased in Alberta between 1996 and 2001, specifically, hens and chickens increased 28%, cattle and calves 11%, pigs 17%, sheep and lambs 18%, and turkeys 3% (19), thus, given a constant submission rate, the increasing trend may be a reflection of an increase in the livestock population in the province. In addition, the laboratory system in Alberta became privatized in 1998 and this change affected the methods and quantity of reporting. Submissions from veterinarians to rule out salmonellosis was one of the services that continued to be offered in the provincial laboratories after routine diagnostics were privatized and this was available at no charge, so veterinarians tended to submit samples for Salmonella culture in that time period (Mary VanderKop, 2003, personal communication). Differences in the microbiological methods used by the various laboratories to isolate Salmonella and changes in those methods over time may have affected the number of positive cultures. While the net effect of these changes is unknown, the sensitivity of detecting Salmonella has presumably improved with time (10), contributing further to the increasing trend in isolates. The reason samples were submitted (diagnostic, monitoring, or outbreak) was not always clear, and up to one-third of the isolates were not serotyped depending on the animal species. Notwithstanding these limitations, although biases likely exist and reasons for submissions vary between animal species and commodities, since Pullorum-Typhoid is a federal reportable disease in poultry, and salmonellosis is a reportable disease in cattle and swine in Alberta, isolates captured through the laboratory diagnostic system gave us information on the serovars present in animals in Alberta.
More than 90% of the S. Heidelberg, Hadar, Kentucky, and Thompson isolates were obtained from chicken sources, with S. Heidelberg and Kentucky showing increasing trends over time. Approximately two-thirds of the S. Heidelberg, Hadar, and Thompson isolates, and 95% of the S. Kentucky isolates from chickens were from monitoring programs (PHP), indicating that while these serovars can cause illness in the birds, the majority of these isolates likely reflect the background subclinical infection status of chickens. Since the majority of samples from the PHP are from broiler breeder flocks, with only a few layer breeder flocks (Mary VanderKop, 2003, personal communication), investigation of the broiler breeder industry may assist in reducing the potential for human illness from these serovars. For example, results of passive surveillance in Canada (1995) have shown that S. Heidelberg and Hadar isolates were primarily from poultry sources, and the majority of the chicken isolates were from food products and the environment, with a lesser proportion from the birds themselves (4). Further, S. Kentucky and Heidelberg were the most common serovars identified in 1998 to 1999 by the United States Department of Agriculture survey of large broiler Hazard Analysis and Critical Control Point plants (broiler carcass rinse samples) (20), emphasizing the importance of these serovars in chicken products.
One notable finding was that S. Enteritidis was rarely isolated. In chickens, this serovar is much more of an issue in laying flocks because of their longer life span and egg transmission (Mary VanderKop, 2003, personal communication). Since the majority of samples from the PHP are from broiler breeder flocks and 1-day-old broiler chicks rather than layer flocks, this may explain the low number of S. Enteritidis isolates. Historically in Canada, S. Enteritidis has been infrequently isolated from non-human sources, ranging from a low of 0.8% to a high of 8.6% between 1983 and 1992 (1); the majority of these were from chickens (21,22). In contrast, S. Enteritidis was among the most frequently isolated serovars from chickens in Belgium (23) and The Netherlands (24). Williams (25) found that serovars uncommon in one region or country may become increasingly common, but commonly isolated serovars in poultry, in any one location, are often characteristic of that area and do not fluctuate in frequency over short periods of time. Therefore, once a serovar is established, it tends to remain in the population (except where there are stringent eradication programs).
The 3 most common serovars isolated from turkeys were S. Heidelberg, Hadar, and Agona. The PHP in Alberta included sample collection from three turkey breeders (Narine Singh, 2003, personal communication). However, unlike our chicken isolates, more than 90% of the turkey isolates were recovered from diagnostic samples rather than PHP samples, suggesting that routine testing of breeder flocks has not provided much evidence of Salmonella contamination in this segment of the poultry industry. In the late 1980’s, turkey growers in the U.S. began to chlorinate drinking water in an effort to improve the overall health of the birds (8). Similarly, all turkey producers in Alberta are expected to have water treatment systems (the most commonly used product is chlorine), and so the 3 turkey breeders in the province chlorinate the water given to their breeder birds (Narine Singh, 2004, personal communication). This may provide some explanation for the low number of isolates and the declining trend in our study, especially considering the 3% to 4% increase in the number of turkeys in the province between 1991 and 2001 (19).
Among cattle in Alberta, S. Typhimurium accounted for 58% of the reported isolates (63% if var. Copenhagen was included), followed by S. Dublin (7%) and Muenster (6%). This pattern is similar to that found in a California study on adult dairy cattle with diarrhea (1991 to 1998), where S. Typhimurium (including var. Copenhagen) accounted for 44% of the isolates, and S. Montevideo and Muenster accounted for 10% and 5% of the isolates, respectively (7). In Belgium (2001), the most frequent serovars from cattle were S. Typhimurium (58%) (including var. Copenhagen) and Dublin (37%) (23). In The Netherlands (1984 to 2001), S. Dublin (53%) and Typhimurium (39%) were the most prevalent serovars in cattle; S. Dublin replaced Typhimurium as the most common serovar between 1990 and 2001 (24). Salmonella Dublin is generally one of the more commonly isolated serovars in cattle, particularly from young calves (3,26) and it is relatively host-specific (26). Outbreaks in cattle have been reported (27–30). From an economic standpoint, outbreaks of S. Dublin may be burdensome to cattle owners, especially those with young calves, and cluster detection (particularly where the serovar is uncommon) may be an important means of identifying the source and preventing the spread of the organism between herds, as well as preventing the establishment of this pathogenic serovar in the cattle population as has occurred in The Netherlands (24). While S. Montevideo ranked in the top 3 serovars in prevalence studies of Salmonella in cattle in the U.S. (31,32), in U.S. surveillance data (33), and in adult diarrheic dairy cows in California (7), it has not been commonly reported in Canada (1,4). Differences between study results may be related to several factors, including the duration of study, the age and type of cattle included, the percentage of untyped isolates, the types of samples submitted, different management practices, differences in the method in which samples are submitted or reported to national notifiable databases (4), and reasons for collection (clinical cases versus non-clinical sources, such as monitoring and surveillance, feed sample testing, environmental testing, research projects, and food testing) (34).
The most common serovar isolated from pigs was S. Typhimurium. Pigs were the 3rd most common source of S. Typhimurium in Alberta, similar to other Canadian surveillance data (4). There was an increasing trend in Salmonella isolates from swine, and this may partially be due to the increase in the number of pigs in the province between 1996 and 2001 (19). Also, swine practitioners in Alberta have observed salmonellosis more frequently in young pigs and sows during the last few years (Andrijana Rajic, 2003, personal communication). This increase might be related to changes in the industry over the last decade, as the number of small family farms decreased while the number of large, more intensive farms (including multi-site operations) increased. Still, it is unclear why there were so few Salmonella isolates from pigs overall, given the widespread prevalence of infection in pigs in other countries, such as Denmark (35). One possible reason is that submissions from pigs in our study were primarily from animals or farms with clinical signs of salmonellosis rather than routine submissions for surveillance purposes as is done in Denmark (35). Other possibilities may include practices aimed at decreasing exposure, such as the use of all-in/all-out systems in finishing units and the purchase of feeder pigs from specific pathogen-free herds (3), or the empirical treatment of young pigs with diarrhea with antibiotics, without the submission of fecal samples to a laboratory.
A distinct summertime seasonal pattern of salmonellosis, characterized by a recurring increase in the number of isolates at the same time each year, has been well-documented in humans (5,8). In our study, clear seasonal patterns were not obvious graphically when isolates from all non-human sources were pooled together, nor were they evident when isolates from chicken and cattle sources were examined (both pooled and individual serovars). The lack of a distinct seasonal pattern in isolates from non-human sources has been noted by others (5). It has been suggested that in humans, inappropriate handling and storage of food leads to problems during the warmer months, or infection trends in animal hosts may contribute to the seasonal pattern observed (8). However, in animals, a clear-cut seasonal pattern may be difficult to establish due to the numerous reasons for sample submission (clinical cases, monitoring, environmental testing, etc.), and the different commodities and management practices within each animal species.
Our regression analysis showed that in chickens, fewer isolates were reported in February and December. The reason for this unclear; however, while there were fewer isolates reported overall in these months, there was a tendency for specific serovars to cluster in the winter months (see below).
In cattle, factors that may have contributed to lower numbers isolates in June and July include: 1) unobserved episodes of diarrhea (and thus under-reporting) due to increased time spent on pasture; 2) control of the spread of infection between cattle in a herd due the dispersal of animals during the summer (10); 3) increased shedding of salmonellae among calves in the autumn due to the stress transportation, mixing, and close confinement in feedlots (3,10); and 4) increased levels of shedding in the late winter and early spring the cow/calf industry secondary to stresses associated with calving, followed by lower levels in the summer.
From our swine data, we noted that January and July through September were the months with the lowest number of isolates. Our findings are in contrast to a Danish study (35) that found that the seroprevalence of Salmonella-positive slaughter pigs peaked in the late winter and early fall, possibly as a result of new infections swine herds that occur primarily in the late summer. The authors also found that the prevalence of S. Typhimurium in pork samples began increasing in the spring with a peak in August to September, possibly due to the replication of the bacteria in elevated summer temperatures. Due to the small number of isolates from pigs in our study, our results and comparisons to other studies must be interpreted cautiously.
Our key objective was to look for the presence of temporal clusters of Salmonella serovars in animal groups throughout the province. As mentioned previously, a cluster was defined as a group of isolates of a particular serovar that aggregated together in time, above that which was expected due to chance. These clusters differ from seasonal patterns in that the increase in the number of isolates does not occur repeatedly at the same time each year. Of the 15 serovars chickens, 5 in cattle, and 3 in pigs that we examined for the presence of temporal clusters, 11, 5, and 1, respectively, were significantly clustered, most likely due to a common source, mode of transmission, or stressor (such as those that occur during the winter). We consider this the most likely explanation for clusters of short duration (1 to 4 mo). Clusters that extend over long time periods or multiple months (11 or 12 mo) could indicate an increase in the prevalence of the serovar or, as suggested by Sato et al (7), may indicate farm-to-farm transmission rather than point-source infections (which would result in a significant 1-month cluster), even if the initial outbreak originated from a point source (a feed mill or an infected herd supplying replacement cattle) or from an increase in the susceptible population. Monitoring for short-duration clusters followed by prompt investigation may be an important method of preventing and controlling Salmonella infections. Investigations may include exploring feed mills or specific herds, flocks, or hatcheries for the particular serovar in question. Veterinarians are in a good position to assist investigations by identifying the source of new animals or feed, being aware of the Salmonella status of herds or flocks in their practice area, collecting adequate numbers and types of samples from the animals and their environment during the early stage of a cluster, making appropriate management decisions to reduce Salmonella in the farm environment, and making informed decisions about culling infected individuals or flocks. Thus, keeping producers, veterinarians, and other members of the industry informed of the occurrence of clusters may improve biosecurity in general. In addition, surveillance programs aimed at detecting clusters of longer duration may identify serovars that are becoming more prevalent in animal populations, which, in turn, may stimulate research that assesses their impact on animal and human health and potential interventions.
There were several serovars from chickens where the clusters consisted of a sizable number of isolates and extended over multiple months (long duration clusters), and may be important from a public health perspective. For example, the detection of a large cluster of 63 isolates of S. Heidelberg from December 2000 to November 2001, combined with a sharp increase in the number of isolates since 1996, is an indicator that this serovar is becoming increasingly prevalent in the chicken population in Alberta. Two separate outbreak investigations have linked S. Heidelberg in chicken products with illness in humans (36,37). Together these findings should prompt more diligent control measures within the poultry industry and research activities aimed at investigating the source, mode of transmission, and impact of this serovar on human and chicken health. Parenthetically, in a similar study of Salmonella serovars in humans in Alberta (38), 2 large clusters of S. Heidelberg isolates (August 1998 to July 1999 and September to December 2001) were observed.
On the other hand, several of the clusters in chickens were quite small and, although statistically significant, their importance with respect to causing problems in the poultry industry may not be of great significance. For example, the S. Anatum cluster was extremely small consisting of only 2 isolates in November 1991 and, as the scanning window increased in size, the cluster did not enlarge, suggesting that this small cluster was not problematic. Thus, the development of surveillance systems that utilize cluster detection for early recognition of outbreaks should incorporate baseline frequencies of Salmonella serovars within a defined population and pre-define a cluster size where the number of isolates are deemed high enough to warrant investigations.
Among the serovars from chickens that clustered, when the narrowest scanning window was examined (1- or 2-month windows), we found that more clusters occurred in the winter months than in the summer months. Replication of salmonellae can occur in contaminated feed under appropriate conditions of moisture and temperature, and growth of the bacteria on the egg shell surface is enhanced by a higher relative humidity (25). Salmonellae can be present in the air for several weeks or months, and infection may spread from one hatch to the next by this means (25). It is possible that reduced ventilation and higher relative humidity in poultry houses in the winter could account for these clusters. Other contributory factors may include increased exposure to rodents overwintering in buildings and increased difficulty in adequately cleaning poultry houses between flocks in the winter. However, since samples are collected for various purposes (monitoring, clinical disease) and flock management is not the same for the different poultry commodities (Mary VanderKop, 2003, personal communication), future studies may consider examining different sample types and poultry commodities separately in order to further explore winter clustering.
Among our cattle isolates, the 5 most frequent serovars all demonstrated significant temporal clustering. Clusters of S. Typhimurium were apparent at scanning windows ranging from 1 to 12 mo. Similar results (2 to 8 mo windows) have been reported (7). For a serovar such as S. Typhimurium, which is non-host specific, detecting temporal clusters may be important in preventing outbreaks in a variety of species as well as humans. While it was endemic in the adult dairy cow population in California, there were time periods of increased prevalence suggestive of epidemics (7). The authors stated that temporal clusters of S. Typhimurium may be due to random precipitating factors, such as environmental or nutritional stress, and because it tends to cause more severe disease in cattle than other serovars, a diagnostic investigation (and hence reporting) is more likely to occur.
Salmonella Montevideo was infrequently isolated from cattle in Alberta, yet a cluster that included all 11 isolates was detected between January and April 1996. Most (if not all) of these were from an abortion outbreak on a southern Alberta farm that then spread to a veterinary clinic and resulted in environmental contamination of the clinic (Mary VanderKop, 2003, personal communication). Although this cluster was identified with 1- through 12-month scanning windows, it did not extend beyond 4 mo and it was highly significant when a 1-month window was evaluated, thus it is a good illustration of infection originating from a point source (a short duration cluster). This is in contrast to the more sporadic endemic situation in California where temporal clusters of S. Montevideo isolates were detected at larger monthly intervals (7).
Salmonella Dublin was infrequently isolated from cattle in Alberta; however, a cluster of 10 isolates extended from May 1993 to April 1994 (12-month window). The cluster was initially detected with a narrow scanning window of 2 mo and increased in duration as the scanning window widened. This cluster was associated with the importation of veal calves from dairies in southern British Columbia (Mary VanderKop, 2003, personal communication), and illustrates a multiple-month cluster where cases originated from a common source (although we can not be certain how many of these were primary cases and how many were due to inter-farm transmission). Salmonella Dublin isolates were not significantly clustered in adult diarrheic dairy cattle in California (7), however, this was attributed to the inclusion of only adult cattle, which are more likely to be carriers of the serovar than to show clinical signs of disease.
Salmonella Muenster was infrequently isolated from cattle with a total of 25 isolates, however, a cluster of 14 isolates was detected between July and October 1998. The other 11 isolates were all reported between November 1998 and December 1999; this serovar was not reported in cattle outside of this time period. Many of these isolates may have been from a 140-cow dairy herd in Alberta that were infected with S. Muenster over a 2-year period (July 1998 to April 2000), with the greatest prevalence occurring between August 1998 and January 1999 (39). The serovar was likely introduced into the herd by the addition of new cattle, and all but one cow became infected within 6 mo.
Three prospective studies have been conducted in recent years in Alberta in order to determine the prevalence of Salmonella spp. in the cattle industry (10,40,41). In each study, the prevalence was less than 2%. These studies provide useful information to complement our diagnostic results, as samples were obtained primarily from healthy cattle. The isolation of S. Montevideo, Typhimurium, and Typhimurium var. Copenhagen from ground beef samples in Alberta (10), and the detection of clusters of these serovars from cattle in our study, indicate that these serovars can contaminate human food sources as well as cause clinical disease in cattle.
When we examined the narrowest scanning window for each serovar that clustered in cattle, we noted that 3 serovars exhibited clustering in the winter months (similar to poultry), while 1 clustered in the spring. Consistent with our stated beliefs about factors causing short-term clusters, conditions that may cause clustering in the winter or spring include restricted housing in sheltered paddocks or barns combined with contaminated feed or water, increased exposure to overwintering wildlife vectors (birds and rodents), nutritional, environmental, or pregnancy-related stresses (42), and/or the stress of calving (most cow/calf operations calve from January to March in Alberta).
The cluster of S. Typhimurium in pigs was quite small and was detected only with the use of wide scanning windows. Due to the small size of the cluster and the proportion of swine isolates that were untyped, these results must not be over-interpreted.
By utilizing a formal cluster detection method to study Salmonella serovars in livestock in Alberta, we were able to identify clusters, test their statistical significance, and determine when the clusters occurred. At least 2 of the clusters in cattle were likely associated with outbreaks on individual farms. However, in addition to serious outbreaks known to Alberta Agriculture, additional clusters were detected emphasizing the value of looking for temporal clusters. While we have used cluster detection retrospectively over a long time frame to gain knowledge about the behavior of temporal clusters, its most practical use would be in the routine examination of surveillance data at specified intervals, for example, at the end of each month or quarter. In addition, so that the results of cluster detection analyses would be more useful to those who work in surveillance, the quality of data could be improved by: 1) serotyping all isolates; 2) incorporating data that provide some idea of submission rates, such as the number of specimens and the number of units (animals, herds) cultured for Salmonella; 3) clearly indicating the reason for submission (outbreak, diagnostic, monitoring, food or feed testing, etc.); 4) indicating whether a sample is primary or a follow-up to a previous sample (including an identifying link); and 5) providing identification of individual farms to exclude multiple submissions from the same premises. The identification could be coded if the data are used by persons outside of the agency concerned, so that confidentiality is maintained. Early recognition of clusters could reduce economic losses to producers, improve the overall health of their animals and reduce the zoonotic potential to those who work directly with the animals, as well as helping to prevent outbreaks of salmonellosis in humans.
Acknowledgments
The authors are grateful to AAFRD for providing the data, and would especially like to thank Louise Szaszvari (administrative specialist) for her work in the extraction and manipulation of the data, Dr. Mary VanderKop (surveillance veterinarian and veterinary epidemiologist), Narine Singh (poultry specialist) for reviewing the manuscript and providing valuable insight into the surveillance systems and poultry industry in Alberta, and Rashed Cassis (laboratory scientist) for providing information regarding laboratory changes over time.
Footnotes
Dr. Andrijana Rajic’s current address is Policy Advice and Effectiveness Program, Laboratory for Foodborne Zoonoses, Public Health Agency of Canada, 160 Research Lane, Unit 103, Guelph, Ontario N1G 5B2.
References
- 1.Khakhria R, Woodward D, Johnson WM, Poppe C. Salmonella isolated from humans, animals and other sources in Canada, 1983–1992. Epidemiol Infect. 1997;119:15–23. doi: 10.1017/s0950268897007577. [DOI] [PMC free article] [PubMed] [Google Scholar]
- 2.Humphrey TJ, Threlfall EJ, Cruickshank JG. Salmonellosis. In: Palmer SR, Soulsby EJL, Simpson DIH, eds. Zoonoses: Biology, Clinical Practice, and Public Health Control. New York: Oxford University Press, 1998:191–206.
- 3.Fraser CM, Bergeron JA, Mays A, Aiello SE, eds. The Merck Veterinary Manual: A Handbook of Diagnosis, Therapy, and Disease Prevention and Control for the Veterinarian. 7th ed. Rahway, New Jersey: Merck & Company, 1991.
- 4.Pollari F, Powers C. Canadian Integrated Surveillance Report for 1995 on Salmonella, Campylobacter and Pathogenic Escherichia coli [Web Page]. 1998. Available at http://www.hc-sc.gc.ca/pphb-dgspsp/publicat/ccdr-rmtc/98vol24/24s5/index.html Last accessed April 1, 2003. [PubMed]
- 5.Health Canada. Canadian Integrated Surveillance Report: Salmonella, Campylobacter, pathogenic E. coli and Shigella, from 1996 to 1999 [Web Page]. 2003. Available at http://www.hc-sc.gc.ca/pphb-dgspsp/publicat/ccdr-rmtc/03vol29/29s1/index.html Last accessed June 2, 2003. [PubMed]
- 6.Paré J, Carpenter TE, Thurmond MC. Analysis of spatial and temporal clustering of horses with Salmonella Krefeld in an intensive care unit of a veterinary hospital. J Am Vet Med Assoc. 1996;209:626–628. [PubMed] [Google Scholar]
- 7.Sato K, Carpenter TE, Case JT, Walker RL. Spatial and temporal clustering of Salmonella serotypes isolated from adult diarrheic dairy cattle in California. J Vet Diagn Invest. 2001;13:206–212. doi: 10.1177/104063870101300304. [DOI] [PubMed] [Google Scholar]
- 8.Olsen SJ, Bishop R, Brenner FW, et al. The changing epidemiology of Salmonella: trends in serotypes isolated from humans in the United States, 1987–1997. J Infect Dis. 2001;183:753–761. doi: 10.1086/318832. [DOI] [PubMed] [Google Scholar]
- 9.Ward MP, Carpenter TE. Techniques for analysis of disease clustering in space and in time in veterinary epidemiology. Prev Vet Med. 2000;45:257–284. doi: 10.1016/s0167-5877(00)00133-1. [DOI] [PubMed] [Google Scholar]
- 10.Sorensen O, Van Donkersgoed J, McFall M, Manninen K, Gensler G, Ollis G. Salmonella spp. shedding by Alberta beef cattle and the detection of Salmonella spp. in ground beef. J Food Prot. 2002;65:484–91. doi: 10.4315/0362-028x-65.3.484. [DOI] [PubMed] [Google Scholar]
- 11.Popoff MY, Le Minor L. Antigenic formulas of the Salmonella serovars, 7th revision. Institut Pasteur, Paris, France. 1997.
- 12.Microsoft Corporation. Microsoft Excel 2000. Microsoft Corporation, Redmond, Washington. 2001.
- 13.StataCorp. Stata Statistical Software: Release 7.0. Stata Corporation, College Station, Texas. 2001.
- 14.Shapiro SS, Wilk MB. An analysis of variance test for normality (complete samples) Biometrika. 1965;52:591–611. [Google Scholar]
- 15.Cook RD, Weisberg S. Diagnostics for heteroscedasticity in regression. Biometrika. 1983;70:1–10. [Google Scholar]
- 16.Kulldorff M, Green D, Rand K, Gherman G, Williams G, DeFrancesco D. SaTScan version 3.0: Software for the spatial and space-time scan statistics. National Cancer Institute, Bethesda, Maryland. 2002.
- 17.Kulldorff M. SaTScan User Guide for version 3.0. National Cancer Institute, Bethesda, Maryland. 2002.
- 18.Dwass M. Modified randomization tests for nonparametric hypotheses. Ann Math Stat. 1957;28:181–187. [Google Scholar]
- 19.Statistics Canada. Census of Agriculture [Web Page]. 2001. Available at http://www.statcan.ca/english/Pgdb/census.htm Last accessed July 8, 2002.
- 20.Food Safety and Inspection Service. Salmonella serotypes isolated from raw meat and poultry January 26, 1998 to January 25, 1999 [Web Page]. 1999. Available at http://www.fsis.usda.gov/ophs/haccp/sero1yr.htm Last accessed April 3, 2003.
- 21.Poppe C, Irwin RJ, Forsberg CM, Clarke RC, Oggel J. The prevalence of Salmonella Enteritidis and other Salmonella spp. among Canadian registered commercial layer flocks. Epidemiol Infect. 1991a;106:259–70. doi: 10.1017/s0950268800048408. [DOI] [PMC free article] [PubMed] [Google Scholar]
- 22.Poppe C, Irwin RJ, Messier S, Finley GG, Oggel J. The prevalence of Salmonella Enteritidis and other Salmonella spp. among Canadian registered commercial chicken broiler flocks. Epidemiol Infect. 1991b;107:201–11. doi: 10.1017/s0950268800048822. [DOI] [PMC free article] [PubMed] [Google Scholar]
- 23.Imberechts, H. Salmonella serotypes analysed at the VAR in 2001, Evolution among poultry, cattle and pig isolates from 1992 to 2001 with results of antimicrobial resistance testing [Web Page]. 2002. Available at http://www.var.fgov.be/SalmonellaRapport2001.pdf Last accessed October 1, 2002.
- 24.van Duijkeren E, Wannet WJ, Houwers DJ, van Pelt W. Serotype and phage type distribution of Salmonella strains isolated from humans, cattle, pigs, and chickens in the Netherlands from 1984 to 2001. J Clin Microbiol. 2002;40:3980–3985. doi: 10.1128/JCM.40.11.3980-3985.2002. [DOI] [PMC free article] [PubMed] [Google Scholar]
- 25.Williams JE. Avian Salmonellosis, Paratyphoid Infections. In: Hofstad MS, ed. Diseases of Poultry. 8th ed. Ames, Iowa: Iowa State University Press, 1984:91–129.
- 26.Hirsh DC. Salmonella. In: Biberstein EL, Zee YC, eds. Review of Veterinary Microbiology. Boston, Massachusetts: Blackwell Publications Professional, 1990:110–115.
- 27.Peters AR. An estimation of the economic impact of an outbreak of Salmonella Dublin in a calf rearing unit. Vet Rec. 1985;117:667–668. doi: 10.1136/vr.117.25-26.667. [DOI] [PubMed] [Google Scholar]
- 28.Sato Y, Schneebeli M, Matsukawa K, Chimana H, Sinsungwe H, Sato G. Outbreaks of Salmonella Dublin infection among calves on a dairy farm applying Salmonella bacterins in Zambia. J Vet Med Sci. 1993;55:511–513. doi: 10.1292/jvms.55.511. [DOI] [PubMed] [Google Scholar]
- 29.Rice DH, Besser TE, Hancock DD. Epidemiology and virulence assessment of Salmonella Dublin. Vet Microbiol. 1997;56:111–124. doi: 10.1016/S0378-1135(96)01352-1. [DOI] [PubMed] [Google Scholar]
- 30.van Schaik G, Schukken YH, Nielen M, Dijkhuizen AA, Barkema HW, Benedictus G. Probability of and risk factors for introduction of infectious diseases into Dutch SPF dairy farms: a cohort study. Prev Vet Med. 2002;54:279–289. doi: 10.1016/s0167-5877(02)00004-1. [DOI] [PubMed] [Google Scholar]
- 31.Fedorka-Cray PJ, Dargatz DA, Thomas LA, Gray JT. Survey of Salmonella serotypes in feedlot cattle. J Food Prot. 1998;61:525–530. doi: 10.4315/0362-028x-61.5.525. [DOI] [PubMed] [Google Scholar]
- 32.Wells SJ, Fedorka-Cray PJ, Dargatz DA, Ferris K, Green A. Fecal shedding of Salmonella spp. by dairy cows on farm and at cull cow markets. J Food Prot. 2001;64:3–11. doi: 10.4315/0362-028x-64.1.3. [DOI] [PubMed] [Google Scholar]
- 33.Ferris KE, Timm JM, Aalsburg AM, Munoz M. 2001 USAHA Proceedings: Salmonella serotypes from animals and related sources reported during July 2000 – June 2001 [Web Page]. 2001. Available at http://www.usaha.org/speeches/speech01/s01ferre.html Last accessed April 16, 2003.
- 34.Centers for Disease Control and Prevention. National Salmonella Surveillance System Annual Summary, 2000 [Web Page]. 2002. Available at http://www.cdc.gov/ncidod/dbmd/phlisdata/salmtab/2000/SalmonellaAnnualSummary2000.PDF Last accessed April 2, 2003.
- 35.Hald T, Andersen JS. Trends and seasonal variations in the occurrence of Salmonella in pigs, pork and humans in Denmark, 1995–2000. Berl Münch Tierärztl Wochenschr. 2001;114:346–349. [PubMed] [Google Scholar]
- 36.Weisse P, Libbey E, Nims L, et al. Salmonella Heidelberg outbreak at a convention — New Mexico. MMWR Morb Mortal Wkly Rep. 1986;35:91. [PubMed] [Google Scholar]
- 37.Layton MC, Calliste SG, Gomez TM, Patton C, Brooks S. A mixed foodborne outbreak with Salmonella Heidelberg and Campylobacter jejuni in a nursing home. Infect Control Hosp Epidemiol. 1997;18:115–121. doi: 10.1086/647565. [DOI] [PubMed] [Google Scholar]
- 38.Guerin MT, Martin SW, Darlington GA. Temporal clusters of Salmonella serovars in humans in Alberta between 1990 and 2001. Can J Public Health 2005 (in press). [DOI] [PMC free article] [PubMed]
- 39.Radke BR, McFall M, Radostits SM. Salmonella Muenster infection in a dairy herd. Can Vet J. 2002;43:443–453. [PMC free article] [PubMed] [Google Scholar]
- 40.Van Donkersgoed J, Graham T, Gannon V. The prevalence of verotoxins, Escherichia coli O157:H7, and Salmonella in the feces and rumen of cattle at processing. Can Vet J. 1999;40:332–338. [PMC free article] [PubMed] [Google Scholar]
- 41.Sorensen O, McFall M, Manninen K. Prevalence of Salmonella in dairy herds in Alberta. Can Vet J. 2003;44:230–231. [PMC free article] [PubMed] [Google Scholar]
- 42.Davies TG, Renton CP. Some aspects of the epidemiology and control of Salmonella Typhimurium infection in outwintered suckler cows. Vet Rec. 1992;131:528–531. [PubMed] [Google Scholar]