

Abstract
Aims:
Endothelin-1 (ET-1) is elevated in patients with obesity and adipose tissue of obese mice fed high-fat diet (HFD); however, its contribution to the pathophysiology of obesity is not fully understood. Genetic loss of endothelin type B receptors (ETB) improves insulin sensitivity in rats and leads to increased circulating adiponectin, suggesting that ETB activation on adipocytes may contribute to obesity pathophysiology. We hypothesized that elevated ET-1 in obesity promotes insulin resistance by reducing the secretion of insulin sensitizing adipokines, via ETB receptor.
Methods:
Male adipocyte-specific ETB receptor knockout (adETBKO), overexpression (adETBOX), or control littermates were fed either normal diet (NMD) or high-fat diet (HFD) for 8 weeks.
Results:
RNA-Sequencing of epididymal adipose (eWAT) indicated differential expression of over 5,500 genes (p<0.05) in HFD compared to NMD controls, and changes in 1,077 of these genes were attenuated in HFD adETBKO mice. KEGG analysis indicated significant increase in metabolic signaling pathway. HFD adETBKO mice had significantly improved glucose and insulin tolerance compared to HFD control. In addition, adETBKO attenuated changes in plasma adiponectin, insulin and leptin that is observed in HFD vs. NMD control mice. Treatment of primary adipocytes with ET-1 caused a reduction in adiponectin production that was attenuated in cells pretreated with an ETB antagonist.
Conclusion:
These data indicate elevated ET-1 in adipose tissue of mice fed HFD inhibits adiponectin production and causes insulin resistance through activation of the ETB receptor on adipocytes.
Keywords: Obesity, Endothelin-1, Insulin Sensitivity, Adipocytes
INTRODUCTION
Obesity is a state characterized by excessive fat accumulation in adipose tissue and other organs, leading to metabolic syndrome and its associated comorbidities. These include type 2 diabetes, hypertension, nonalcoholic steatohepatitis, cardiovascular disease, and cancer. 1 Adipose tissue has long been thought of as a storage site for lipids in the form of triglycerides, but its role in modulating the body’s response to insulin has become much more appreciated over the last few decades. Insulin promotes glucose uptake in adipocytes and switches the adipocyte to a state of lipid storage postprandially. 2 Insulin resistance in adipocytes leads to increased triglycerides and free fatty acids in the plasma, promoting the risk of cardiovascular disease. In addition, adipocytes affect peripheral insulin signaling through the release of adipokines, such as adiponectin, which improves insulin sensitivity and reduces gluconeogenesis by the liver.3 Further, decreased adipocyte secretion of adiponectin induces mitochondrial dysfunction and insulin resistance in muscle.4 In mouse models of obesity, including high-fat or Western diet-induced, ob/ob and db/db mice, adipocyte dysfunction occurs leading to a reduction in circulating adiponectin; however, mechanisms that promote adipose tissue dysfunction in obesity are not completely understood.5–7
Endothelin-1 (ET-1) is a 21-amino acid peptide primarily released by endothelial cells whose major physiological function is maintaining vascular homeostasis.8, 9 ET-1 is also produced by other cell types such as vascular smooth muscle cells, hepatocytes, neurons, kidney mesangial cells, macrophages, and adipocytes.10, 11 ET-1 activates two Gq-coupled G-protein coupled receptors. Activation of the endothelin type A receptor (ETA) primarily causes vasoconstriction by acting on smooth muscle cells, while activation of the endothelin type B receptor (ETB), primarily located on vascular endothelial cells, causes nitric oxide/prostaglandin E2-mediated vasodilation.12, 13 It is well established that ET-1 production is elevated in several pathological states including obesity, arterial/pulmonary hypertension, type 2 diabetes, atherosclerosis, sepsis, and heart failure.14–17 Our lab has recently demonstrated that ET-1 is significantly elevated in adipose tissue of obese mice,18 and mounting evidence suggests a pathophysiological role for ET-1 in glucose homeostasis and insulin resistance.19 First, infusion of ET-1 causes impaired glucose uptake in humans and rodents.20, 21 Additionally, ETB receptor blockade improves insulin and glucose tolerance in a mouse model of obstructive sleep apnea, and whole body loss of the ETB receptor improves insulin sensitivity in rats, which is accompanied by a reduction in visceral adiposity when animals are placed on a high salt diet leading to increased vascular ET-1 production.22, 23 In addition, pharmacological blockade of the ETA and ETB receptor results in higher Pparg expression levels in epidydimal white adipose tissue (eWAT) and increased circulating adiponectin in mice fed high-fat diet (HFD). Even though the ETB receptor predominates over ETA on visceral adipocytes, little is known about the physiological role of the ETB receptor in adipocytes, especially in the setting of obesity.
Given the relationship between obesity, ET-1, and the potential role of the ETB receptor in contributing to insulin resistance and dyslipidemia seen in obesity, we hypothesized that elevated ET-1, acting through the ETB receptor in adipocytes, promotes insulin resistance by reducing adipose PPARγ leading to an altered secretion of adipokines, including a reduction in adiponectin. The major goal of this study is to determine if knockout of the ETB receptor in adipocytes attenuates insulin resistance and restores the pro-insulin sensitive adipokine profile in mice fed a high-fat diet.
METHODS
All submitted material conforms with good publishing practices in physiology.24
Animals
Animal husbandry and generation of models.
Mice were bred on the same rack and room at the University of Mississippi Medical Center (UMMC) under 12-h light/12-h dark conditions and allowed food and water ad libitum. Female mice did not have a similar impairment of insulin or glucose tolerance following 8 weeks of high-fat feeding compared to males;18 therefore, only male mice were studied. Adipocyte- specific ETB receptor knockout (adETBKO) mice were generated from heterozygous adiponectin Cre+ (adipoQCre+) mice purchased from Jackson Laboratories and were bred with Ednrb floxed mice.25 Mice overexpressing the human ETB on adipocytes (adETBOX) were generated using mice in which human Ednrb was inserted downstream of a CAG promoter with a floxed stop codon and upstream of an mCherry reporter gene (Fig 1E). Fertilized eggs from C57bl/6 mice were injected with Cas9 and gRNA of the “CAG-loxP-Stop-loxP-EDNRB-2A-mCherry-polyA” cassette containing homologous regions to target intron 1 of the Rosa26 gene located on chromosome 6. Founders were genotyped using two sets of primers that amplified regions of homology and overlapped 3’ and 5’ ends of the transgene. Sequencing of PCR products confirmed successful insertion. Founders were bred with wild type to generate F1 animals and confirm germline transmission. F1 mice were bred with heterozygous adipoQCre+ mice. In the absence of Cre recombinase, overexpression will not occur because the floxed stop codon will stop translation.
Figure 1:

Generation and detection of adETBKO or adETBOX mice. A and B) ETB receptor western blot of membrane and cytosolic fraction of visceral adipose from floxed control, adipocyte ETB overexpression, and adipocyte knockout mice (A&B). C) PCR product using primers around the floxed region of the EDNRB gene. Recombination was found only in epididymal, subcutaneous, and brown adipose tissue of adiponectin Cre+ EDNRBflox/flox mice. E) Schematic of human EDNRB cloned into intron 1 of the ROSA26 gene and inserted using Crispr/Cas9. Upstream of the EDNRB gene is a floxed PolyA site to stop transcription. In the presence of Cre recombinase, the PolyA site will be removed leading to transcription and overexpression of the hEDNRB gene tagged with an mCherry reporter. F and G) mCherry florescence in various tissues (A-brain, B-lung, C-heart, D-inguinal adipose, E-liver, F-spleen, G-kidney, H-gonadal adipose, I-skeletal muscle) or live animals to detect recombination in either adiponectin Cre- or Cre+ transgenic mice. mCherry reporter was only detected in adipose tissue of Cre+ hEDNRB transgenic mice (2,5, and 7).
Confirmation of recombination.
Western blot of visceral adipose showed a reduction in ETB receptor abundance in adETBKO mice, while adETBOX had higher abundance compared to adipoQCre− controls (Fig 1A and 1B). Immunohistochemistry revealed presence of ETB receptors in cultured preadipocytes from floxed control mice that were differentiated to adipocytes. ETB reactivity was not found in differentiated preadipocytes from adETBKO mice. Cre recombination in both adETBKO and adETBOX was tested in several tissues using primers around the floxed region or mCherry expression. Recombination was found only in eWAT, inguinal white adipose tissue (iWAT), and brown adipose of adipoQCre+ mice (adETBKO, Fig 1D; adETBOX, Fig 1F–G). Control (CON) mice used in each experiment were Cre− littermates with intact floxed sites from the respective colony and will be referred to as floxed or CON. Experiments on adipoQCre+ Ednrbwt/wt mice showed no phenotypic changes (insulin tolerance and glucose tolerance; (Supplemental Figure 1) between wild type and adipoQCre+. All protocols were approved by the Institutional Animal Care and Use Committee at UMMC.
Experimental Protocol.
At 8 weeks of age, mice were randomized into groups with genotypes blinded until data analysis. Animals were individually housed. Mice were fed normal diet (NMD; 12.6% kcal fat, 30% kcal carbohydrate, Envigo, TD.05230) or high-fat diet (HFD; 42% kcal fat, 42.7% kcal carbohydrate, Envigo TD.88137) for 8 weeks. Lean mass and fat mass were measured using Echo MRI (4-in-1 EchoMRI-900TM, Echo Medical System, Houston, TX) at weeks 0, 4, and 8 of diet. Diets were continued for an additional week while insulin and glucose tolerance experiments were performed as previously described.18 All procedures and euthanasia were performed after a 6-hour fast between zeitgeber time 6–8, and tissues were collected and snap-frozen in liquid nitrogen.
Assays
Plasma/Media adiponectin, insulin, and leptin concentrations were measured by mouse enzyme-linked immunoassay (ELISA) (Crystal Chem, 90080, 80569, 90030) Hepatic triglyceride content was determined using triglyceride quantification kit (BioVision, K622–100).
Primary adipocyte isolation and culture
White adipocytes were isolated from eWAT of NMD control, HFD control, HFD adETBKO, and HFD adETBOX mice after 8 weeks on diets (n=3 for all groups).26 Adipocytes from eWAT of lean floxed control or adETBKO mice were used for culture of primary adipocytes. Each sample represents adipocytes from eWAT of one mouse. Isolated adipocytes were plated using Mature Adipocyte Aggregate Cultures (MAAC).26 After a 24-hour incubation, adipocytes were treated with either vehicle (PBS/DMSO 0.1%), 100nM ET-1 (Cayman Chemical) or 1μM BQ-788 (ETB antagonist) (Tocris) for 5 days, with media changed on the third day. After the fifth day of treatment, media was collected, and RNA isolated from adipocytes. Adiponectin release into the media was measured by ELISA.
Preadipocyte culture and differentiation
Visceral adipose was excised from 4–6 week old mice and minced. Tissue was homogenized to a single cell suspension in gentleMACS C tubes (Miltenyi Biotec) in HBSS supplemented with albumin (3.5%), glucose (0.55mM), Collagenase Type I (1mg/ml), penicillin-streptomycin (pen-strep; 40 unit/ml-40μg/ml), gentamicin (40μg/mL), and Amphotericin B (500ng/mL). The lower stromal vascular fraction was separated from the floating adipocytes and plated on a mounting slide for histology. Cells were grown to 70–80% confluency in growth medium (DMEM supplemented with 10 mg/ml pen-strep, 10 mg/ml gentamycin, and 10% fetal bovine serum). To induce differentiation into adipocytes, insulin (850 nM), Dexamethasone (1μM), IBMX (500μM), and Indomethacin (125 μM) is added to the growth medium for two days. Media is then replaced with growth media plus insulin (850 nM) for maintenance. After 5 days, cells were fixed in paraformaldehyde for immunohistochemistry (IHC).
Western Blot and IHC
Epididymal white adipose was homogenized in a high sucrose buffer (250 mM sucrose, 50 mM Tris-HCl, 5 mM EDTA, and 15uM PMSF) and centrifuged at 1000g for 30 minutes. Supernatant was transferred to an ultracentrifuge tube and centrifuged at 30,000g for 45 minutes. The supernatant containing cytosolic fraction was separated from the pellet. The pellet containing membrane was resuspended in buffer. Protein was measured by Bradford assay for normalization for Western blot. Protein was subject to SDS page on a 4–20% acrylamide (Biorad) then transferred to a nitrocellulose gel. Membrane was blocked with Li-Cor blocking buffer for 1 hour. Membrane was incubated overnight with mouse anti ETB receptor primary (1:1000, ThermoFisher catalogue number PA3–066). Membrane was washed 3X for 5 minutes in TBST, then incubated with goat anti mouse Alexafluor 680 secondary (1:5000, ThermoFisher). Membrane was imaged on Chemidoc (BioRad). For IHC, fixed cells were exposed to the same ETB primary antibody (1:100) and Alexafluor 555 secondary (1:1000). Nuclei were stained with DAPI. Imaging was performed on a Nikon confocal microscope.
Histology
Freshly isolated eWAT from NMD control, HFD control, HFD adETBKO, and HFD adETBOX mice after 8 weeks on diet were immediately fixed in 10% buffered formalin overnight (n=3 for all groups). The tissue was washed twice with PBS, placed in 70% EtOH and embedded in paraffin as previously reported. Paraffin-embedded tissue sections were stained with hematoxylin-eosin (H-E) using standard protocol. Quantification of adipocyte area was performed on H-E stained sections using 6 images per mouse at 20X magnification and quantified using color deconvolution in ImageJ 1.7v software.
Droplet Digital PCR and RNA-sequencing
Total RNA was isolated using Direct-zol™ RNA MiniPrep kit (Zymo, R2052). Gene expression was carried out by Droplet Digital PCR (ddPCR; BioRad) using Taqman primer assays listed in Supplemental Table 1. Data is reported as copies/25ng RNA. For RNA sequencing, RNA was assessed for quality control parameters of minimum concentration and fidelity (i.e., 18S and 28S bands, RIS >8) by the UMMC Molecular and Genomics Core. cDNA libraries were prepared using the TruSeq mRNA Stranded Library Prep Kit (Set-A/B-indexes), quantified with the Qubit Fluorometer (Invitrogen), and assessed for quality and size using Qiagen QIAxcel Advanced system as done previously.27, 28 Samples were uniquely barcoded to minimize technical variation, pooled into single library and sequenced using the NextSeq 500 High Output Kit (150 cycles, paired end 75bp) on the Illumina NextSeq 500 platform. >95% reads per sample were mapped to the reference genome. Two outliers were detected, one within the HFD control group and one within the HFD adETBOX group and were excluded from the analysis. Differential expression was determined with DESeq2. Gene expression differences are denoted as Log2 (ratio) and q<0.05. KEGG pathway analysis was performed on differentially expressed genes between HFD control and HFD ETBKO with q<0.01 using Generally Applicable Gene-set/Pathway Analysis (GAGE) software.29 ClustVis was used to generate heat maps of differentially expressed genes within “metabolic pathways” shown to be differentially regulated between HFD control and HFD adETBKO.30
Statistics
All data are expressed as mean ± SEM. Data were tested for statistical significance by one-way analysis of variance (ANOVA) for one variable datasets, two-way ANOVA to compare 2 variable datasets, or three-way repeated measures ANOVA (Echo MRI data). Tukey’s post hoc test was used to compare the means of all groups following ANOVA. a<0.05 was considered statistically significant. Sample size was calculated through power analysis of previously collected insulin tolerance data with a power of 80%, significance a=0.05, and effect size of 50% AUC of NMD controls. Four mice were excluded for lack of body weight gain while on HFD and no further analyses were performed on these mice. All analyses were performed using GraphPad Prism V9.5 software.
RESULTS
Chronic endothelin-1 treatment decreases Pparg and adiponectin in mouse primary adipocytes.
To determine whether ET-1 directly inhibits expression of Pparg and production of adiponectin, adipocytes from eWAT of lean floxed control and adETBKO were chronically treated with ET-1 (100nM). ET-1 treatment significantly reduced Pparg, adipoQ, Irs-1 and Irs-2 expression compared to non-treated adipocytes. This decrease in expression in response to ET-1 was significantly attenuated in adETBKO adipocytes (Fig. 2A–2D). Similarly, ET-1 treated adipocytes from floxed control mice had significantly lower expression of Pparg, adipoQ, Irs-1, and SLC2A4 (Glut4) compared to vehicle treated. Treatment with BQ-788, an ETB receptor antagonist, attenuated the decrease in Pparg, adipoQ, and Irs-1 expression, although there was no significant difference in SLC2A4 expression between ET-1 and ET-1+BQ-788 treated adipocytes (Fig. 2E–2H). We then measured adiponectin protein levels in the media (5 days of treatment) of control ET-1/BQ-788 treated adipocytes. ET-1 treated adipocytes had a significant 26% lower adiponectin release into the media compared to non-treated adipocytes, an effect that was significantly attenuated in adipocytes pretreated with the ETB antagonist, BQ-788 (Fig. 2I).
Figure 2.

Endothelin-1 decreases peroxisome proliferator-activated receptor gamma (Pparg) and adiponectin production in mouse primary adipocytes via ETB receptor. Droplet digital PCR of Pparg, Adiponectin, insulin receptor substrate-1 (Irs-1), insulin receptor substrate-2 (Irs-2), and glucose transporter 4 (SLC2A4) from epididymal white adipose (eWAT) primary adipocytes of floxed control and adETBKO mice (n=6) treated with ET-1 for 5 days (A-D) and from eWAT primary adipocytes of floxed control mice (n=3) treated with ET-1 in the presence or absence of BQ-788, a specific ETB inhibitor, for 5 days (E-H). Adiponectin release by primary adipocytes from eWAT of Floxed control mice (n=6) treated with ET-1 and BQ-788 for 5 days (I). Data are expressed as mean ± SEM. * = p<0.05, † = p<0.01.
Adipocyte ETB receptor knockout or overexpression does not alter body composition in HFD fed mice.
adETBKO, adETBOX, and control mice from respective colonies were fed a NMD or HFD control for 8 weeks. As expected, control mice fed HFD had significantly higher body weight and fat mass compared to control and adETBKO fed NMD with no significant differences between HFD adETBKO and HFD control mice (Fig. 3A and 3C). Interestingly, NMD adETBOX had similar body weight to HFD fed control and adETBOX (Fig. 3B); however, there was no detectable difference in fat or lean mass as a percentage of BW between NMD control and adETBOX (Fig. 3D and 3E), suggesting a proportional increase in fat and lean content over the experimental period in NMD adETBOX, while HFD control mice had an increase in BW due mainly to higher fat mass. As expected, adipocyte hypertrophy was observed in epididymal adipose of mice fed HFD compared to NMD fed mice as measured by adipocyte area. There was no significant difference between control, adETBKO, and adETBOX fed HFD (Fig. 3E).
Figure 3.
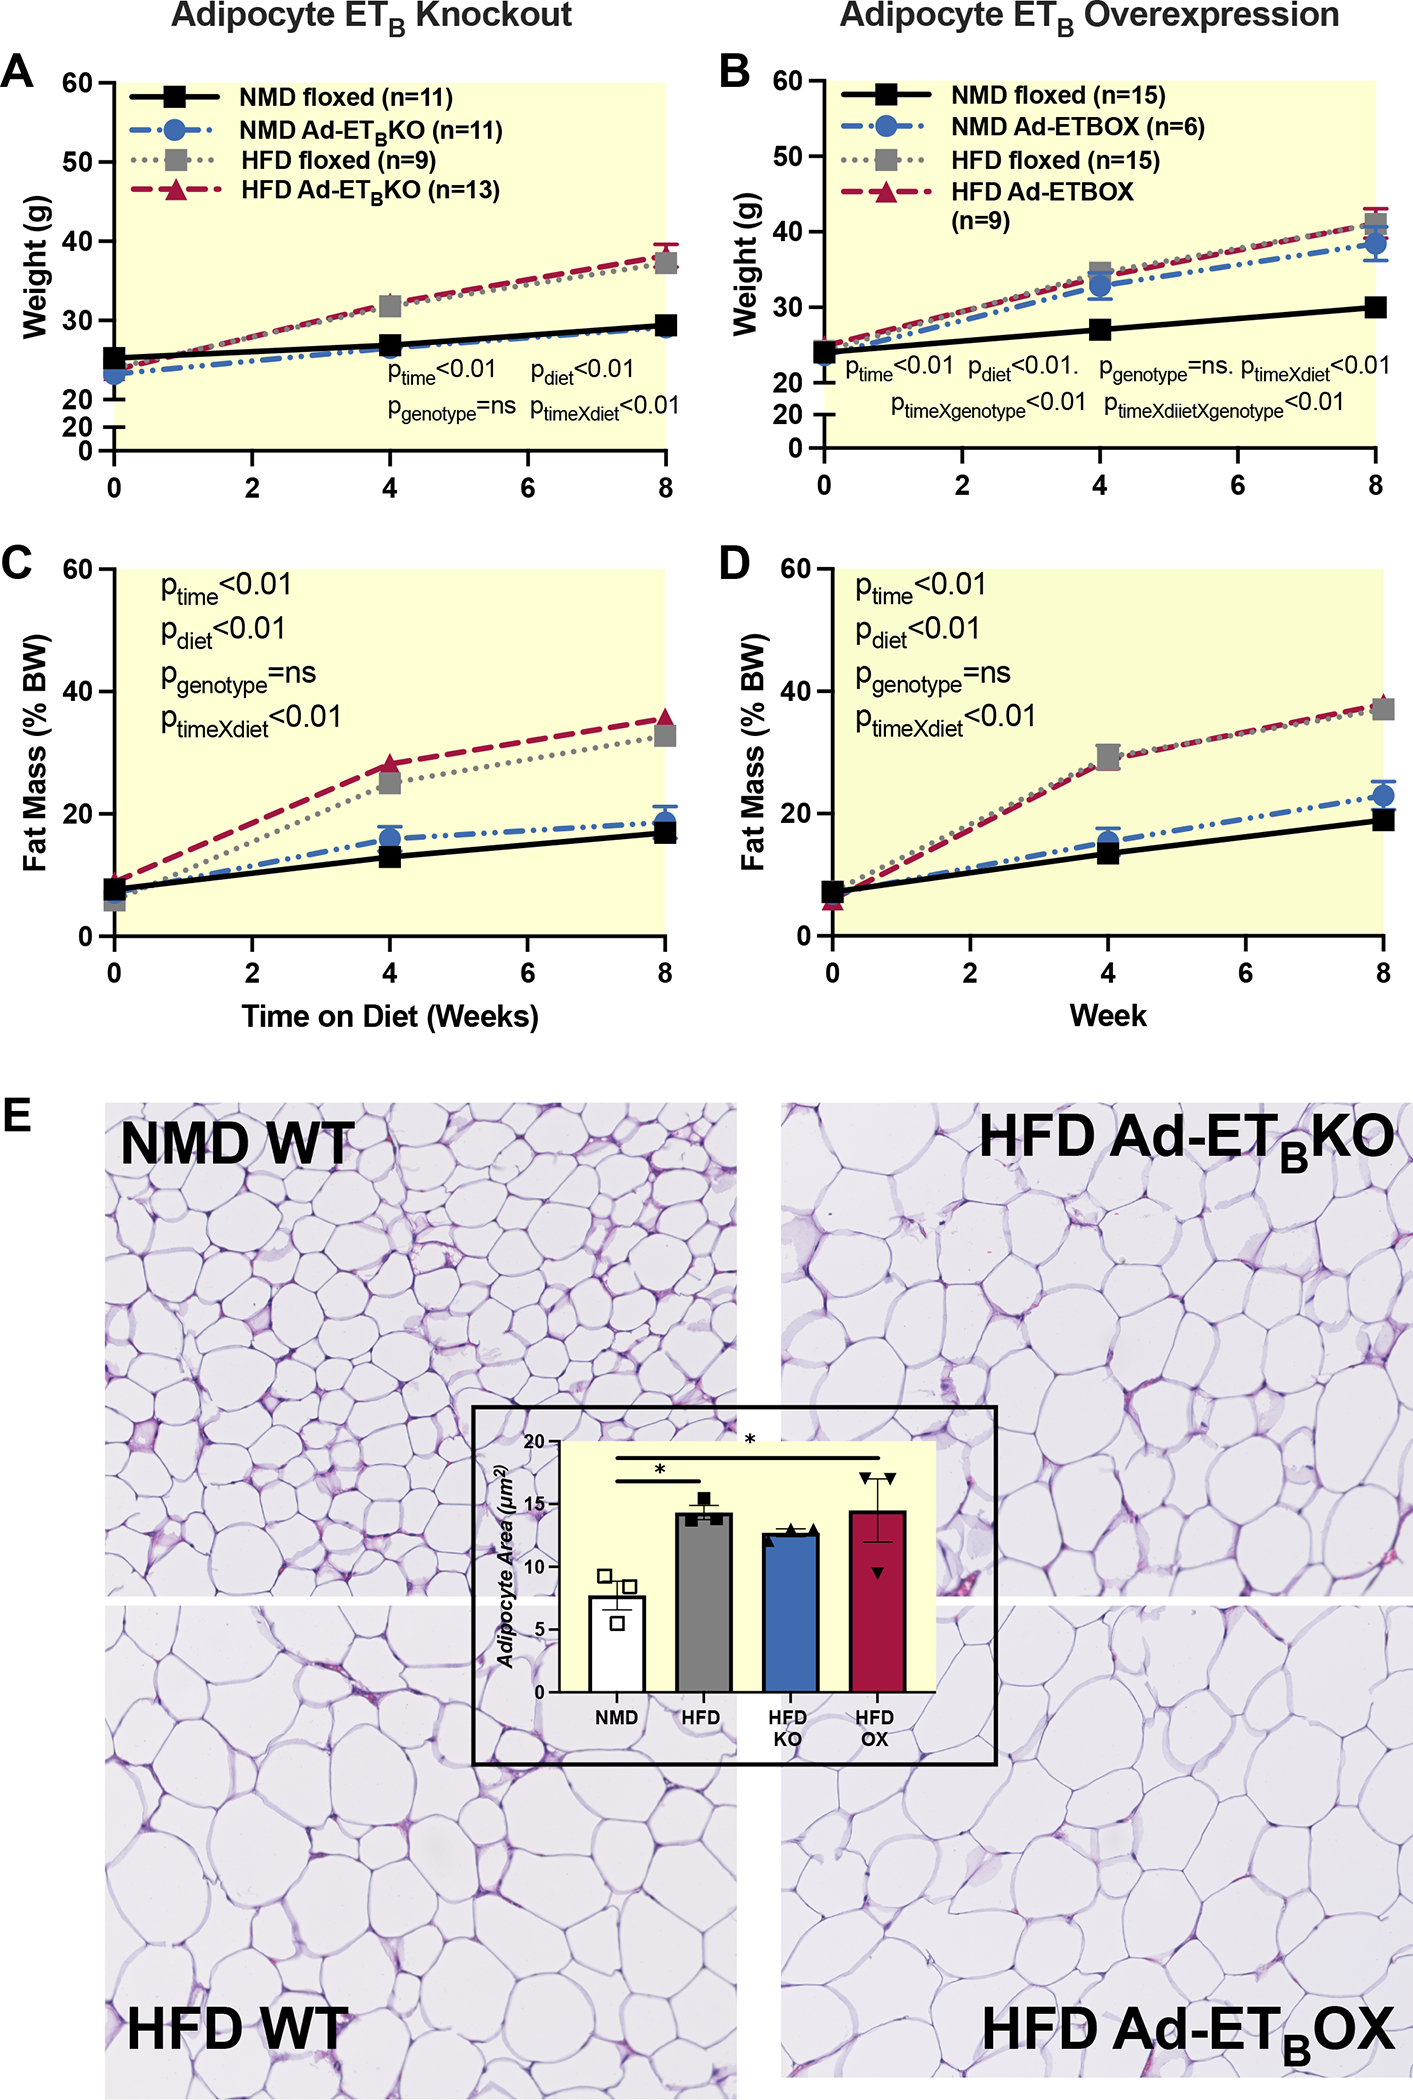
Adipocyte ETB receptor knockout or overexpression does not alter body composition in HFD fed mice. Body weight (A&B), percent fat mass (C&D), measured by echo MRI in adETBKO and adETBOX and the respective controls at 0, 4, and 8 weeks of NMD or HFD. E) H&E stain of eWAT and quantification of adipocyte size. NMD=normal diet; HFD=High fat diet; Ad-ETBKO=Adipocyte ETB knockout; Ad-ETBOX=Adipocyte ETB overexpression. Data were analyzed by three-way RM ANOVA. P values represent probability that a given variable or interaction of variables contributes to variation. If p value is not presented, the interaction was ns.
Body composition data in Figure 3 established that any phenotypic differences that may be observed between control and transgenic animals are not due to differences in adiposity. Therefore, we next determined the expression of components of the ET-1 system and a major transcriptional regulator of ET-1 production, hypoxia inducible factor alpha (Hif1α). Hif1α (Fig. 4 A–B) and EDN1 (Fig. 4 C–D) mRNA expression were significantly elevated in iWAT and eWAT of HFD fed mice, with no detectable difference between HFD control, adETBKO, and adETBOX. Characterization of ET-1 receptors in adipose tissue indicate more ETB receptor mRNA copy count compared to ETA in both eWAT and iWAT (Fig. 4 E–H). There was no detectable difference between NMD fed control, HFD control or transgenic mice in either receptor subtype (Fig 4 E–H).
Figure 4.
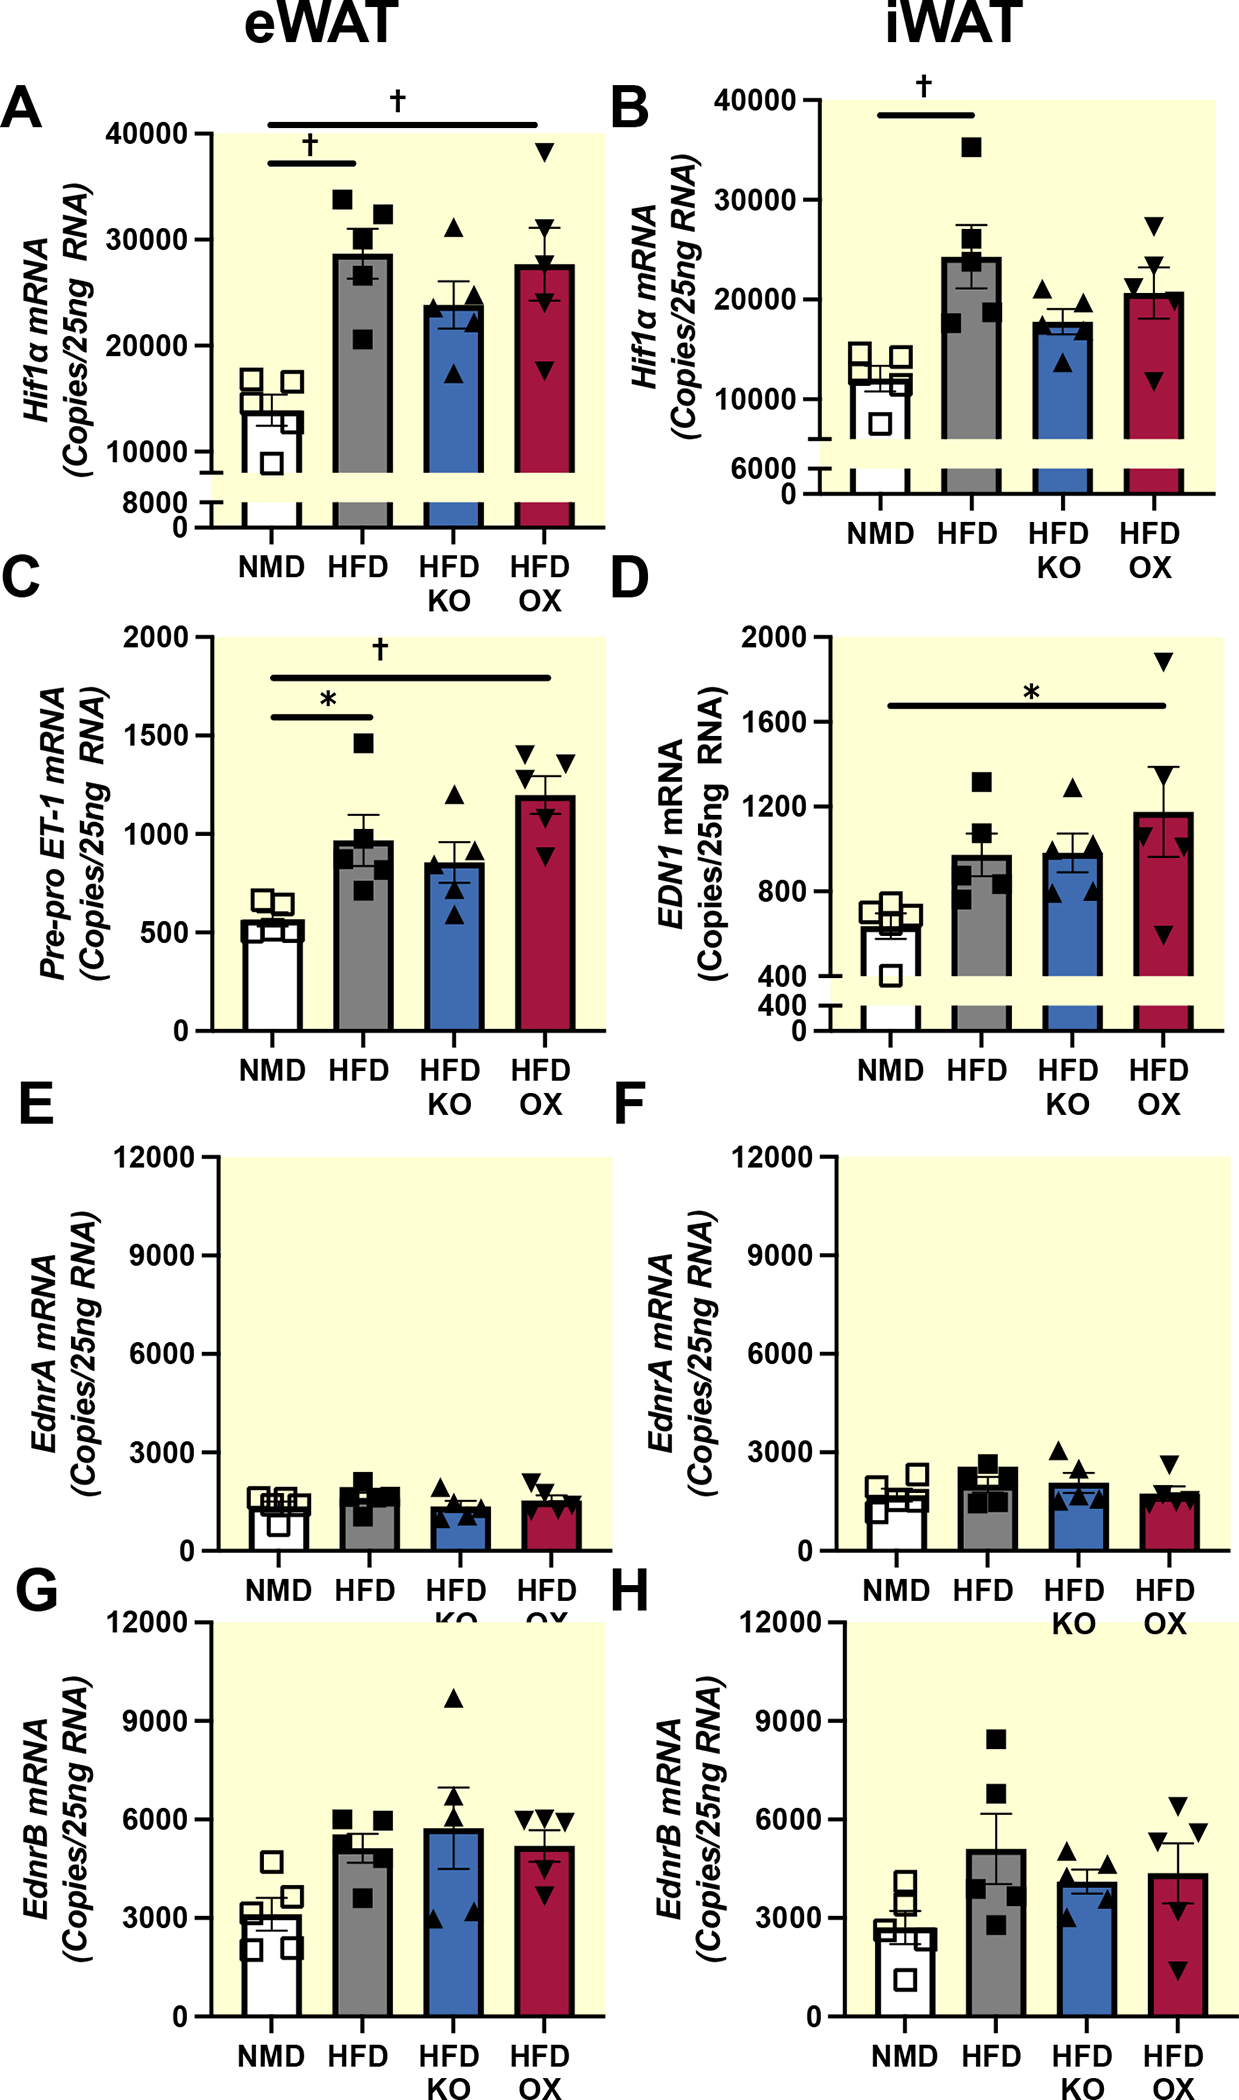
High-fat diet increases ET-1 and Hif1α in adipose tissue. Droplet digital PCR of Hif1α, ET-1, EdnrA, and EdnrB in eWAT (n=5) (A,C,E, and G respectively), and iWAT (n=5) (B, D, F, and H respectively) of NMD control, HFD control and HFD adETBKO mice after 8 weeks on diet, respectively. Data are expressed as mean ± SEM. * = p<0.05, † = p<0.01 following Tukey’s post hoc test.
ET-1 causes impaired glucose homeostasis and insulin sensitivity in HFD-fed mice via adipocyte ETB receptor.
It has been established so far that ET-1 is significantly elevated in adipose tissue of this model of diet induced obesity, likely leading to overactivation of the predominant ETB receptor on adipocytes; therefore, we sought to determine the pathways affected by ETB signaling and the physiological implications of ETB receptor activation in the visceral adipose of obese mice. RNA sequencing was performed on eWAT to determine major pathways affected by knockout or overexpression of the ETB receptor on adipocytes. In all, there were 3,436 upregulated and 3,238 downregulated genes in floxed mice fed HFD compared to NMD. Of these, 1,077 (Complete lists of differentially expressed genes sorted by log2(fold change) are provided in Supplemental Tables 2–4) were significantly attenuated (p<0.01) in adETBKO compared to HFD controls. Kegg pathway analysis of differentially expressed genes (p<0.01) between HFD and indicated upregulation of metabolic (Figure 5A; 113 genes p=0.003) and insulin signaling pathways (21 genes p=0.054) in HFD adETBKO compared to HFD control. (Full list of pathways can be found in Supplemental Table 5). On the other hand, only 4 genes were differentially expressed between HFD adETBOX and HFD control. One of the genes significantly upregulated in HFD adETB OX adipose tissue was EDNRB, further validating this model (Supplemental Table 4).
Figure 5:

Adipocyte ETB receptor knockout improves expression of genes enriched in metabolic and insulin signaling pathways. A) RNA sequencing heat map of differentially expressed genes (HFD vs. HFD adETBKO) within metabolic pathways identified by KEGG analysis. B) Principal component analysis plot of top 500 expressed genes from NMD control (n=5), HFD control (n=4), HFD adETBKO (n=5), and HFD adETBOX (n=4). C) List of top five upregulated (red) and top 5 downregulated (blue) pathways between HFD control and HFD adETBKO.
Several major components of the insulin signaling pathway were measured by droplet digital PCR in order to verify RNA seq data. Data were generated from two different white adipose depots and adipocytes isolated from eWAT of a separate group of mice. Insulin receptor substrate 1 (IRS-1) message was significantly reduced in eWAT of control HFD fed mice compared to control NMD (Fig. 6D; 223±42 vs. 629±45 copies respectively). SLC2A4 was significantly reduced in the iWAT (Fig. 6C; 2198±290 vs. 4808±634 copies), eWAT (Fig. 6F; 1683±123 vs. 4576±348 copies), and adipocytes from eWAT (Fig. 6I; 5987±1513 vs. 23467±1620 copies) of HFD fed mice compared to control mice. The reduction in both IRS1 and SLC2A4 was attenuated in HFD fed adETBKO (Fig 6D, 6C, and 6F) by 64% (eWAT IRS1), 46% (iWAT SLC2A4), and 54% (adipocyte SLC2A4). No detectable differences were observed between HFD control or HFD adETBOX for any genes in iWAT and eWAT. IRS2 was significantly upregulated in iWAT of HFD control mice vs. NMD control and expression was similar between all HFD genotypes (Fig 6B), although there was a significant downregulation in the adipocytes from eWAT of HFD control vs. NMD control (Fig 6H; 34967±8690 vs. 90133±4999 copies) that was attenuated by about 40% in HFD fed adETBKO. No detectable difference in IRS2 was observed between HFD control, adETBKO, or adETBOX in either adipose depot or adipocytes.
Figure 6.

Adipocyte ETB receptor knockout attenuates HFD induced reduction in major mediators of insulin signaling. Droplet digital PCR of Irs-1, Irs-2, and SLC2A4 from iWAT (n=5) (A-C), eWAT (n=5) (D-F), and Adipocytes from eWAT (n=3; G-I), of NMD FLOXED, HFD FLOXED, HFD adETBKO, and HFD adETBOX mice after 8 weeks on diet. Data are expressed as mean ± SEM. * = p<0.05, † = p<0.01 following Tukey’s post hoc test.
To determine the physiological implication of adipocyte ETB receptor activation in obesity, markers of insulin sensitivity were measured. In both NMD and HFD fed mice, adETBKO significantly improved insulin tolerance (Fig. 7A and 7B for AUC; pinteraction=0.45, pgenotype<.0001, pdiet=0.03). In addition, impaired glucose tolerance observed in HFD control mice compared to NMD control mice was significantly attenuated in HFD adETBKO (Fig. 7C and 7D for AUC; pinteraction<0.01, pgenotype=.04, pdiet=0.01). On the other hand, HFD led to significant impairment of both insulin and glucose tolerance of control and adETBOX (Fig. 7E and 7G respectively; Figure 7F and 7H for AUC). Genotype had no significant effect on insulin tolerance of adETBOX mice (Fig. 7F; pinteraction=0.23, pgenotype<.0001, pdiet=0.02). However, HFD fed adETBOX had a significantly worse glucose tolerance compared to HFD control (Fig. 7H; p=0.04 by Tukey’s post hoc test). These data suggest that activation of ETB receptors on adipocytes contributes to obesity-related insulin resistance.
Figure 7.

Adipocyte ETB receptor knockout improves insulin sensitivity in HFD-fed mice. Intraperitoneal insulin tolerance (ITT, 0.75 IU/kg) and oral glucose tolerance (GTT, 2 g/kg) in adETBKO (A & C) and adETBOX (E and G) and respective controls after 8 weeks on NMD or HFD. Area under the curve for each mouse was analyzed for ITT (B & F) and GTT (D & H). Data were analyzed by two-way ANOVA and are expressed as mean ± SEM. * = p<0.05, † = p<0.01following Tukey’s post hoc test.
Adipocyte ETB receptor knockout improves adipokine expression profile in HFD-fed mice.
Given that the adipocyte accounts for a small portion of acute changes in blood glucose in response to a glucose load or during an insulin tolerance test, it was postulated that ETB receptor activation on adipocytes promotes peripheral insulin resistance by contributing to dysregulation of adipokine secretion from adipocytes observed in obesity. As expected, HFD mice had a significant reduction in adipoQ expression in eWAT (Figure 8G) and adipocytes from eWAT (Fig. 8K) compared to NMD mice, which translated into a 38% reduction in circulating adiponectin (Fig. 8A; 6.7±0.2 vs. 10.8±0.6 mg/ml). Interestingly, reduction in adipoQ mRNA and circulating adiponectin protein was attenuated in HFD-fed adETBKO (9.9±0.4 mg/ml). While HFD fed adETBOX mice had significantly lower adipoQ mRNA in eWAT compared to HFD control, circulating adiponectin was similar between HFD control and HFD adETBOX (Fig. 8A; 6.7±0.2 vs. 7.6±0.5 mg/ml).
Figure 8.

Adipocyte ETB receptor knockout improves adipokine expression profile in HFD-fed mice. Analysis of fasting plasma adiponectin and plasma leptin (A & B) in NMD floxed (n=10), HFD floxed (n=10), HFD adETBKO (n=12), and HFD adETBOX mice after 8 weeks on diet. Droplet digital PCR of Adiponectin, Adipsin, Leptin and Resistin in iWAT (n=5) (C-F), eWAT (n=5) (G-J), and adipocytes from eWAT (n=3) (K-N), of NMD and HFD adETBKO adETBOX mice after 8 weeks on diet, respectively. Data are expressed as mean ± SEM; * = p<0.05, † = p<0.01.
Leptin expression was significantly increased in both fat depots and adipocytes of HFD control compared to NMD control mice (Fig 8D,8H, and 8L) leading to an approximate 4-fold increase in circulating leptin (Fig. 8B). The increase in lep mRNA was significantly attenuated in HFD adETBKO compared to HFD control while no detectable difference was observed in HFD adETBOX. Adipsin expression was significantly reduced in all adipose depots of HFD mice compared to NMD mice. The low expression levels of adipsin were significantly attenuated in the iWAT, eWAT and Adipocyte-eWAT of HFD adETBKO mice (Fig. 8E, 8I, 8M), while expression was similar between HFD control and adETBOX. Finally, resistin expression was significantly reduced in the eWAT of HFD mice compared to NMD mice. The reduction in resistin expression was significantly attenuated in HFD adETBKO mice, but similar in HFD adETBOX, compared to HFD control (Fig. 8F, 8J, 8N).
DISCUSSION
ET-1 is implicated in several pathophysiological conditions associated with obesity, including dyslipidemia and insulin resistance.31, 32 Although the deleterious effects of ET-1 in multiple pathologies have been tied to prolonged ETA receptor activation, recent evidence suggests that the ETB receptor may be implicated in impaired glucose homeostasis and insulin resistance.22, 23, 33 The major findings of this study are that knockout of the ETB receptor in adipocytes improves glucose handling, dyslipidemia, and circulating adipokine levels in obese HFD-fed mice independent of changes in body weight or body composition. Overall, these results support the hypothesis that elevated ET-1 observed in obesity promotes insulin resistance via ETB receptors on adipocytes, in part by inhibiting Pparg in adipocytes, leading to a reduction in insulin sensitizing adipokines.
Van Harmelen et al. were the first to describe a potential effect of ETB receptor activation to promote insulin resistance on human adipocytes.34 These experiments demonstrated that ET-1 inhibits the anti-lipolytic effect of insulin on primary adipocytes from human visceral adipose tissue and reported a higher expression of ETB to ETA receptors in cultured human adipocytes, a finding confirmed in mouse adipocytes by the current study.34 However, their experiments stopped at the in vitro level. Here, we show that elevated adipose tissue ET-1 and chronic activation of ETB receptors on adipocytes of obese mice not only causes insulin resistance at the level of the adipocyte, but also impairs glucose and insulin tolerance. In addition, while it was previously suggested that ET-1 is expressed by adipocytes and is elevated in obesity, our data indicate that murine primary adipocytes not only express ET-1 mRNA, but that adipocytes from HFD-fed mice have significantly increased ET-1 expression compared to lean counterparts. Given the adipose tissue only accounts for around 10 percent of glucose uptake following a glucose load, we predicted that ET-1 affects adipokine secretion by adipocytes. Indeed, adipocytes chronically treated with ET-1 for 5 days have significantly reduced mRNA expression of insulin associated genes such as Irs-1, Irs-2, and SLC2A4. Further, ET-1 significantly reduced Pparg, a transcriptional regulator of several adipokines including adiponectin mRNA expression, and adiponectin release from primary adipocytes, a response attenuated by pharmacological blockade of the ETB receptor and in adipocytes from adETBKO mice. These data are congruent with a study by Bedi et al., showing that ET-1 treatment (24 hours) inhibits adiponectin secretion in 3T3-L1 differentiated adipocytes.35 Overall, these data suggest that prolonged activation of ETB receptors on adipocytes causes insulin resistance by inhibiting Pparg, leading to a reduction in adipokine secretion.
In vitro experiments presented in the current study were recapitulated in vivo where the reduction in circulating adiponectin and increase in leptin production in HFD fed mice was attenuated in HFD fed adETBKO mice. Additionally, adipocytes from HFD fed adETBKO mice had significantly improved mRNA expression of adiponectin, adipsin, leptin, and resistin, which is indicative of a more insulin sensitive adipose tissue.36 Adiponectin exerts its insulin sensitizing effects on peripheral insulin sensitive tissues by reducing triglyceride content, decreasing hepatic gluconeogenesis, and increasing fatty acid metabolism and glucose uptake.37 Similarly, adipsin plays an important role in preserving β-cells of the pancreas and has been shown as a powerful antihyperglycemic agent in obese mice capable of augmenting insulin secretion.38 In contrast to adiponectin and adipsin, high circulating leptin directly correlates with adiposity, specifically adipocyte hypertrophy, which in overweight/obese individuals is thought to cause leptin “resistance” in the brain, impairing the effects of the central nervous system on energy expenditure along with promoting inflammation in WAT.39 Although high levels of circulating resistin are directly associated with insulin resistance and obesity, WAT mRNA expression of resistin has been shown to negatively correlate with circulating levels in HFD-fed mice.40 It is therefore possible that the regression of resistin mRNA levels back to normal in the adipose of HFD fed adETBKO mice may represent a reduction in circulating resistin and contribute to improved insulin sensitivity. These data support the hypothesis that elevated ET-1 production in adipose tissue of obese mice promotes whole body insulin resistance partially by altering adipokines that would otherwise act to sensitize muscle and liver tissue to insulin.
Higher circulating ET-1 levels are associated with overweight and obese states, comprising of increased ET-1 activity via ETA receptor activation, evidenced by impaired flow mediated dilation in patients with obesity.16 A likely source for higher levels of ET-1 in obesity may be visceral adipose tissue, which becomes hypoxic as a result of hypertrophy and hyperplasia.41, 42 The ET-1 promoter is highly responsive to hypoxia, comprising a HIF1a and HIF1β binding site,43 which lends to the notion that increased hypoxia in adipose tissue could result in elevated levels of ET-1. Our lab recently reported that hypoxia increases ET-1 production by cultured 3T3-L1 adipocytes, a response that is abolished by inhibition of HIF1a.18 In support, HFD and HFD adETBKO mice had higher Hif1a and ET-1 mRNA levels in iWAT, eWAT, and Adipocyte-eWAT, as compared to NMD mice, suggesting a hypoxic environment, and confirming higher expression levels in obese mice. Given that Hif1a expression was not attenuated in adETBKO compared to HFD mice, it appears that effects to improve circulating adipokines in adETBKO mice were not due to improved blood flow or increased oxygen tension, but rather through a direct effect of ETB receptor activation on adipocytes.
RNA sequencing revealed a number of differentially regulated pathways in adipose tissue of mice that lack ETB receptors on adipocytes compared to floxed controls. Upregulation of the “insulin signaling” pathway and downregulation of several inflammatory pathways indicate an insulin sensitive adipocyte that is more similar to lean controls. It also confirms the physiological relevance of adipose tissue ET-1 to obesity related insulin resistance. We and others have shown that whole body loss of ETB receptor function improves insulin sensitivity in rodents.44, 45 The current data indicate the adipocyte as one of the major sites of ET-1 action to promote insulin resistance via ETB receptor activation. More work is needed to determine if targeting the adipocyte with currently approved ET-1 receptor antagonists can be achieved at the accepted doses. Our previous work indicates that mice treated with bosentan, a dual ETA/ETB antagonist does not restore circulating adiponectin as shown in the current adETBKO mouse using the same HFD model.46
Conclusions
ET-1 appears to be a major contributor to obesity-related pathophysiology. Much attention has been given to the ETA receptor in hypertension and renal disease, while the ETB receptor has often been regarded as protective through its blood pressure lowering and anti-inflammatory properties;47 however, the current research indicates that the ETB receptor on adipocytes contributes to insulin resistance in obese mice. Currently, there are two types of ET-1 receptor antagonist that are FDA approved and prescribed for the treatment of pulmonary hypertension and more recently, essential hypertension. One selectively inhibits ETA (ambrisentan) while others are less discriminatory and inhibit both ETA and ETB receptors (bosentan and macitentan).48 ETA antagonism (atrasentan) has been proven beneficial to insulin sensitivity and lipid metabolism by reducing circulating lipids and reducing HOMA-IR in patients with diabetic nephropathy;49 however, these endpoints have not been reported from trials that used a dual ETA/ETB antagonist such as bosentan or macitentan. The current data suggest that patients suffering from obesity may gain long-term therapeutic benefit from a dual antagonist class rather than ETA receptor blockade alone. A clinical trial with endpoints related to insulin sensitivity and dyslipidemia is certainly warranted.
Supplementary Material
Supplemental Figure 1: Intraperitoneal Insulin tolerance test and oral glucose tolerance test in wild type (AdipoQCre−/−) and Adoponectin Cre+ mice (AdipoQCre+/−) AUC was analyzed by two-way ANOVA. *p<0.05, **p<0.01 by Tukey’s post hoc test.
Acknowledgments
The authors would like to thank Dr. Jennifer Pollock at the University of Alabama at Birmingham for providing Ednrb floxed mice.
Funding:
This work was supported by National Institutes of Health grants R01 DK124327 to JSS, F31DK125035 to ORG, and T32 HL105324 to MFM, BDK, and MKN. The work performed through the UMMC Molecular and Genomics Facility is supported, in part, by funds from the NIGMS, including Mississippi INBRE (P20GM103476), and Obesity, Cardiorenal and Metabolic Diseases- COBRE (P20GM104357).
Footnotes
Disclosures: The authors declare no conflicts of interest.
Animal ethics statement: All protocols involving mice were approved by the Institutional Care and Use Committee at the University of Mississippi Medical Center.
Data Availability:
All raw data will be may available upon request.
References
- 1.Apovian CM. Obesity: definition, comorbidities, causes, and burden. Am J Manag Care. 2016;22(7 Suppl):s176–85. [PubMed] [Google Scholar]
- 2.Dimitriadis G, Mitrou P, Lambadiari V, Maratou E, Raptis SA. Insulin effects in muscle and adipose tissue. Diabetes research and clinical practice. 2011;93:S52–S9. [DOI] [PubMed] [Google Scholar]
- 3.Miller RA, Chu Q, Le Lay J, Scherer PE, Ahima RS, Kaestner KH, Foretz M, Viollet B, Birnbaum MJ. Adiponectin suppresses gluconeogenic gene expression in mouse hepatocytes independent of LKB1-AMPK signaling. J Clin Invest. 2011;121(6):2518–28. Epub 2011/05/25. doi: 10.1172/JCI45942. [DOI] [PMC free article] [PubMed] [Google Scholar]
- 4.Civitarese AE, Ukropcova B, Carling S, Hulver M, DeFronzo RA, Mandarino L, Ravussin E, Smith SR. Role of adiponectin in human skeletal muscle bioenergetics. Cell Metab. 2006;4(1):75–87. doi: 10.1016/j.cmet.2006.05.002. [DOI] [PMC free article] [PubMed] [Google Scholar]
- 5.Mukherjee S, Chattopadhyay M, Bhattacharya S, Dasgupta S, Hussain S, Bharadwaj SK, Talukdar D, Usmani A, Pradhan BS, Majumdar SS, Chattopadhyay P, Mukhopadhyay S, Maity TK, Chaudhuri MK, Bhattacharya S. A Small Insulinomimetic Molecule Also Improves Insulin Sensitivity in Diabetic Mice. PLoS One. 2017;12(1):e0169809. Epub 2017/01/11. doi: 10.1371/journal.pone.0169809. [DOI] [PMC free article] [PubMed] [Google Scholar]
- 6.Fruhbeck G, Catalan V, Rodriguez A, Ramirez B, Becerril S, Portincasa P, Gomez-Ambrosi J. Normalization of adiponectin concentrations by leptin replacement in ob/ob mice is accompanied by reductions in systemic oxidative stress and inflammation. Sci Rep. 2017;7(1):2752. Epub 2017/06/07. doi: 10.1038/s41598-017-02848-0. [DOI] [PMC free article] [PubMed] [Google Scholar]
- 7.Landrier JF, Kasiri E, Karkeni E, Mihaly J, Beke G, Weiss K, Lucas R, Aydemir G, Salles J, Walrand S, de Lera AR, Ruhl R. Reduced adiponectin expression after high-fat diet is associated with selective up-regulation of ALDH1A1 and further retinoic acid receptor signaling in adipose tissue. FASEB J. 2017;31(1):203–11. Epub 2016/10/13. doi: 10.1096/fj.201600263RR. [DOI] [PMC free article] [PubMed] [Google Scholar]
- 8.Nishiyama SK, Zhao J, Wray DW, Richardson RS. Vascular function and endothelin-1: tipping the balance between vasodilation and vasoconstriction. Journal of Applied Physiology. 2017;122(2):354–60. [DOI] [PMC free article] [PubMed] [Google Scholar]
- 9.Sorokin A, Kohan DE. Physiology and pathology of endothelin-1 in renal mesangium. American Journal of Physiology-Renal Physiology. 2003;285(4):F579–F89. [DOI] [PubMed] [Google Scholar]
- 10.Davenport AP, Hyndman KA, Dhaun N, Southan C, Kohan DE, Pollock JS, Pollock DM, Webb DJ, Maguire JJ. Endothelin. Pharmacological reviews. 2016;68(2):357–418. [DOI] [PMC free article] [PubMed] [Google Scholar]
- 11.van Harmelen V, Eriksson A, Åström G, Wåhlén K, Näslund E, Karpe F, Frayn K, Olsson T, Andersson J, Rydén M. Vascular peptide endothelin-1 links fat accumulation with alterations of visceral adipocyte lipolysis. Diabetes. 2008;57(2):378–86. [DOI] [PubMed] [Google Scholar]
- 12.Clozel M, Gray GA, Breu V, Löffler B-M, Osterwalder R. The endothelin ETB receptor mediates both vasodilation and vasoconstriction in vivo. Biochemical and biophysical research communications. 1992;186(2):867–73. [DOI] [PubMed] [Google Scholar]
- 13.Van Renterghem C, Vigne P, Barhanin J, Schmid-Alliana A, Frelin C, Lazdunski M. Molecular mechanism of action of the vasoconstrictor peptide endothelin. Biochemical and biophysical research communications. 1988;157(3):977–85. [DOI] [PubMed] [Google Scholar]
- 14.Fan J, Unoki H, Iwasa S, Watanabe T. Role of Endothelin-1 in Atherosclerosis a. Annals of the New York Academy of Sciences. 2000;902(1):84–94. [DOI] [PubMed] [Google Scholar]
- 15.Seligman B, Biolo A, Polanczyk CA, Gross JL, Clausell N. Increased plasma levels of endothelin 1 and von Willebrand factor in patients with type 2 diabetes and dyslipidemia. Diabetes care. 2000;23(9):1395–400. [DOI] [PubMed] [Google Scholar]
- 16.Weil BR, Westby CM, Van Guilder GP, Greiner JJ, Stauffer BL, DeSouza CA. Enhanced endothelin-1 system activity with overweight and obesity. American Journal of Physiology-Heart and Circulatory Physiology. 2011;301(3):H689–H95. [DOI] [PMC free article] [PubMed] [Google Scholar]
- 17.Zolk O, Quattek J, Sitzler G, Schrader T, Nickenig G, Schnabel P, Shimada K, Takahashi M, Böhm M. Expression of endothelin-1, endothelin-converting enzyme, and endothelin receptors in chronic heart failure. Circulation. 1999;99(16):2118–23. [DOI] [PubMed] [Google Scholar]
- 18.Rivera-Gonzalez O, Wilson NA, Coats LE, Taylor EB, Speed JS. Endothelin receptor antagonism improves glucose handling, dyslipidemia, and adipose tissue inflammation in obese mice. Clin Sci (Lond). 2021. Epub 2021/07/20. doi: 10.1042/CS20210549. [DOI] [PMC free article] [PubMed] [Google Scholar]
- 19.Piatti P, Monti L, Galli L, Fragasso G, Valsecchi G, Conti M, Gernone F, Pontiroli A. Relationship between endothelin-1 concentration and metabolic alterations typical of the insulin resistance syndrome. Metabolism. 2000;49(6):748–52. [DOI] [PubMed] [Google Scholar]
- 20.Juan C-C, Fang VS, Huang Y-J, Kwok C-F, Hsu Y-P, Ho L-T. Endothelin-1 induces insulin resistance in conscious rats. Biochemical and biophysical research communications. 1996;227(3):694–9. [DOI] [PubMed] [Google Scholar]
- 21.Ottosson-Seeberger A, Lundberg J, Alvestrand A, Ahlborg G. Exogenous endothelin-1 causes peripheral insulin resistance in healthy humans. Acta physiologica scandinavica. 1997;161(2):211–20. [DOI] [PubMed] [Google Scholar]
- 22.Polak J, Punjabi NM, Shimoda LA. Blockade of endothelin-1 receptor type B ameliorates glucose intolerance and insulin resistance in a mouse model of obstructive sleep apnea. Frontiers in endocrinology. 2018;9:280. [DOI] [PMC free article] [PubMed] [Google Scholar]
- 23.Rivera-Gonzalez OJ, Kasztan M, Johnston JG, Hyndman KA, Speed JS. Loss of endothelin type B receptor function improves insulin sensitivity in rats. Canadian journal of physiology and pharmacology. 2020;98(9):604–10. [DOI] [PMC free article] [PubMed] [Google Scholar]
- 24.Jensen BL, Persson PB. Good publication practice in physiology 2021. Acta Physiol (Oxf). 2022;234(1):e13741. Epub 20211202. doi: 10.1111/apha.13741. [DOI] [PubMed] [Google Scholar]
- 25.Bagnall AJ, Kelland NF, Gulliver-Sloan F, Davenport AP, Gray GA, Yanagisawa M, Webb DJ, Kotelevtsev YV. Deletion of endothelial cell endothelin B receptors does not affect blood pressure or sensitivity to salt. Hypertension. 2006;48(2):286–93. Epub 2006/06/28. doi: 10.1161/01.HYP.0000229907.58470.4c. [DOI] [PubMed] [Google Scholar]
- 26.Alexandersson I, Harms MJ, Boucher J. Isolation and Culture of Human Mature Adipocytes Using Membrane Mature Adipocyte Aggregate Cultures (MAAC): MyJoVE Corporation; 2016. [DOI] [PubMed]
- 27.Johnson AC, Wu W, Attipoe EM, Sasser JM, Taylor EB, Showmaker KC, Kyle PB, Lindsey ML, Garrett MR. Loss of Arhgef11 in the Dahl Salt-Sensitive Rat Protects Against Hypertension-Induced Renal Injury. Hypertension. 2020;75(4):1012–24. Epub 2020/03/10. doi: 10.1161/HYPERTENSIONAHA.119.14338. [DOI] [PMC free article] [PubMed] [Google Scholar]
- 28.Dungan WC, Garrett MR, Welch BA, Lawson WJ, Himel AR, Dungey A, Vick KD, Grayson BE. Whole genome transcriptome analysis of the stomach resected in human vertical sleeve gastrectomy: cutting more than calories. Physiol Genomics. 2021;53(5):193–205. Epub 20210419. doi: 10.1152/physiolgenomics.00082.2020. [DOI] [PMC free article] [PubMed] [Google Scholar]
- 29.Luo W, Friedman MS, Shedden K, Hankenson KD, Woolf PJ. GAGE: generally applicable gene set enrichment for pathway analysis. BMC Bioinformatics. 2009;10:161. Epub 20090527. doi: 10.1186/1471-2105-10-161. [DOI] [PMC free article] [PubMed] [Google Scholar]
- 30.Metsalu T, Vilo J. ClustVis: a web tool for visualizing clustering of multivariate data using Principal Component Analysis and heatmap. Nucleic Acids Res. 2015;43(W1):W566–70. Epub 20150512. doi: 10.1093/nar/gkv468. [DOI] [PMC free article] [PubMed] [Google Scholar]
- 31.Feingold KR. Obesity and dyslipidemia. Endotext [Internet]. 2020.
- 32.Kahn SE, Hull RL, Utzschneider KM. Mechanisms linking obesity to insulin resistance and type 2 diabetes. Nature. 2006;444(7121):840–6. [DOI] [PubMed] [Google Scholar]
- 33.Abumrad NA, Davidson NO. Role of the gut in lipid homeostasis. Physiological reviews. 2012;92(3):1061–85. [DOI] [PMC free article] [PubMed] [Google Scholar]
- 34.van Harmelen V, Eriksson A, Astrom G, Wahlen K, Naslund E, Karpe F, Frayn K, Olsson T, Andersson J, Ryden M, Arner P. Vascular peptide endothelin-1 links fat accumulation with alterations of visceral adipocyte lipolysis. Diabetes. 2008;57(2):378–86. Epub 20071119. doi: 10.2337/db07-0893. [DOI] [PubMed] [Google Scholar]
- 35.Bedi D, Clarke KJ, Dennis JC, Zhong Q, Brunson BL, Morrison EE, Judd RL. Endothelin-1 inhibits adiponectin secretion through a phosphatidylinositol 4, 5-bisphosphate/actin-dependent mechanism. Biochemical and biophysical research communications. 2006;345(1):332–9. [DOI] [PubMed] [Google Scholar]
- 36.Rabe K, Lehrke M, Parhofer KG, Broedl UC. Adipokines and insulin resistance. Molecular medicine. 2008;14(11):741–51. [DOI] [PMC free article] [PubMed] [Google Scholar]
- 37.Ziemke F, Mantzoros CS. Adiponectin in insulin resistance: lessons from translational research. The American journal of clinical nutrition. 2010;91(1):258S–61S. [DOI] [PMC free article] [PubMed] [Google Scholar]
- 38.Gómez-Banoy N, Guseh JS, Li G, Rubio-Navarro A, Chen T, Poirier B, Putzel G, Rosselot C, Pabón MA, Camporez JP. Adipsin preserves beta cells in diabetic mice and associates with protection from type 2 diabetes in humans. Nature medicine. 2019;25(11):1739–47. [DOI] [PMC free article] [PubMed] [Google Scholar]
- 39.Couillard C, Mauriege P, Imbeault P, Prud'homme D, Nadeau A, Tremblay A, Bouchard C, Despres J. Hyperleptinemia is more closely associated with adipose cell hypertrophy than with adipose tissue hyperplasia. International journal of obesity. 2000;24(6):782–8. [DOI] [PubMed] [Google Scholar]
- 40.Fukui Y, Motojima K. Expression of resistin in the adipose tissue is modulatedby various factors including peroxisome proliferator-activated receptor α. Diabetes, Obesity and Metabolism. 2002;4(5):342–5. [DOI] [PubMed] [Google Scholar]
- 41.Kourembanas S, Marsden P, McQuillan L, Faller D. Hypoxia induces endothelin gene expression and secretion in cultured human endothelium. The Journal of clinical investigation. 1991;88(3):1054–7. [DOI] [PMC free article] [PubMed] [Google Scholar]
- 42.Trayhurn P, Wang B, Wood IS. Hypoxia in adipose tissue: a basis for the dysregulation of tissue function in obesity? British Journal of Nutrition. 2008;100(2):227–35. [DOI] [PubMed] [Google Scholar]
- 43.Yamashita K, Discher DJ, Hu J, Bishopric NH, Webster KA. Molecular regulation of the endothelin-1 gene by hypoxia: contributions of hypoxia-inducible factor-1, activator protein-1, GATA-2, and p300/CBP. Journal of Biological Chemistry. 2001;276(16):12645–53. [DOI] [PubMed] [Google Scholar]
- 44.Feger M, Meier L, Strotmann J, Hoene M, Vogt J, Wisser A, Hirschle S, Kheim MJ, Hocher B, Weigert C, Foller M. Endothelin receptor B-deficient mice are protected from high-fat diet-induced metabolic syndrome. Mol Metab. 2024;80:101868. Epub 20231228. doi: 10.1016/j.molmet.2023.101868. [DOI] [PMC free article] [PubMed] [Google Scholar]
- 45.Rivera-Gonzalez OJ, Kasztan M, Johnston JG, Hyndman KA, Speed JS. Loss of endothelin type B receptor function improves insulin sensitivity in rats. Can J Physiol Pharmacol. 2020;98(9):604–10. Epub 20200221. doi: 10.1139/cjpp-2019-0666. [DOI] [PMC free article] [PubMed] [Google Scholar]
- 46.Rivera-Gonzalez O, Wilson NA, Coats LE, Taylor EB, Speed JS. Endothelin receptor antagonism improves glucose handling, dyslipidemia, and adipose tissue inflammation in obese mice. Clin Sci (Lond). 2021;135(14):1773–89. doi: 10.1042/CS20210549. [DOI] [PMC free article] [PubMed] [Google Scholar]
- 47.Davenport AP, Hyndman KA, Dhaun N, Southan C, Kohan DE, Pollock JS, Pollock DM, Webb DJ, Maguire JJ. Endothelin. Pharmacol Rev. 2016;68(2):357–418. doi: 10.1124/pr.115.011833. [DOI] [PMC free article] [PubMed] [Google Scholar]
- 48.Jenkins HN, Rivera-Gonzalez O, Gibert Y, Speed JS. Endothelin-1 in the pathophysiology of obesity and insulin resistance. Obes Rev. 2020;21(12):e13086. Epub 20200706. doi: 10.1111/obr.13086. [DOI] [PMC free article] [PubMed] [Google Scholar]
- 49.Smeijer JD, Kohan DE, Rossing P, Correa-Rotter R, Liew A, Tang SCW, de Zeeuw D, Gansevoort RT, Ju W, Lambers Heerspink HJ. Insulin resistance, kidney outcomes and effects of the endothelin receptor antagonist atrasentan in patients with type 2 diabetes and chronic kidney disease. Cardiovasc Diabetol. 2023;22(1):251. Epub 20230916. doi: 10.1186/s12933-023-01964-8. [DOI] [PMC free article] [PubMed] [Google Scholar]
Associated Data
This section collects any data citations, data availability statements, or supplementary materials included in this article.
Supplementary Materials
Supplemental Figure 1: Intraperitoneal Insulin tolerance test and oral glucose tolerance test in wild type (AdipoQCre−/−) and Adoponectin Cre+ mice (AdipoQCre+/−) AUC was analyzed by two-way ANOVA. *p<0.05, **p<0.01 by Tukey’s post hoc test.
Data Availability Statement
All raw data will be may available upon request.