

Abstract
Glomalean fungi induce and colonize symbiotic tissue called arbuscular mycorrhiza on the roots of most land plants. Other fungi also colonize plants but cause disease not symbiosis. Whole-transcriptome analysis using a custom-designed Affymetrix Gene-Chip and confirmation with real-time RT-PCR revealed 224 genes affected during arbuscular mycorrhizal symbiosis. We compared these transcription profiles with those from rice roots that were colonized by pathogens (Magnaporthe grisea and Fusarium moniliforme). Over 40% of genes showed differential regulation caused by both the symbiotic and at least one of the pathogenic interactions. A set of genes was similarly expressed in all three associations, revealing a conserved response to fungal colonization. The responses that were shared between pathogen and symbiont infection may play a role in compatibility. Likewise, the responses that are different may cause disease. Some of the genes that respond to mycorrhizal colonization may be involved in the uptake of phosphate. Indeed, phosphate addition mimicked the effect of mycorrhiza on 8% of the tested genes. We found that 34% of the mycorrhiza-associated rice genes were also associated with mycorrhiza in dicots, revealing a conserved pattern of response between the two angiosperm classes.
Keywords: expression profiling, Glomus, Oryza sativa, pathogenesis, phosphate
Symbioses known as arbuscular mycorrhiza (AM) originated >400 million years ago, coincident with land colonization by plants (1–5). The ancient nature of the AM symbiosis suggests that it is ancestral to other plant–microbe interactions (reviewed in refs. 6 and 7). There are genes in legumes that affect symbiosis with both eukaryotic AM fungi and prokaryotic Rhizobia (8–12), indicating conservation of symbiotic mechanisms. Furthermore, both bacterial and fungal root symbioses share signal-transduction components with root-knot nematodes, indicating the recruitment of symbiont-response pathways by the pathogen (13).
The mutualism of the life-long AM association is manifested in a bidirectional nutrient exchange between the partners. The fungus provides the plant with minerals, mainly phosphate, and, in turn, obtains carbohydrates. AM fungi are obligate biotrophs and associate intimately with the root cortex of their host. They frequently establish intracellular highly differentiated haustoria (arbuscules), which are the key structures thought to be involved in bidirectional nutrient exchange (14, 15). Development of the symbiosis requires significant physiological changes of both partners (14, 16), which must result from plant–fungal communication and should, in part, be mirrored by changes in transcription of particular genes.
Many groups have pioneered molecular techniques to screen for dicotyledonous-plant genes regulated in response to mycorrhizal colonization. These techniques include hybridization of subtracted cDNA libraries (17), differential display (18–20), suppressive subtractive hybridization (21–24), large-scale EST sequencing of various root cDNA libraries (25, 26), and hybridization of cDNA macro- and microarrays (22, 26–28). Although the techniques allowed only partial characterization of host transcriptomes, an extensive list of candidate genes was obtained, indicating a broad host-response to the interaction.
Monocotyledonous plants such as rice enter into AM symbioses, but global profiling to detect mycorrhiza-regulated genes has not been reported. Arabidopsis is refractory to colonization by AM fungi, so rice is currently the only mycorrhizal plant with a completely sequenced genome and whole-genome profiling tools (29, 30). Here, we present a microarray study of rice after colonization by a symbiotic fungus. Studying the expression of the resulting genes on pathogenic interactions, we discovered a common set of genes that respond to fungal colonization. A subset of the AM-affected genes are changed by elevated Pi fertilization, indicating that rice may be responding to AM as a source of Pi. The data reveal genes in both mono- and dicotyledonous plants that respond to AM and suggest a conserved mechanism.
Materials and Methods
Plant Growth and Inoculation. Mycorrhiza and Pi. Seeds of Oryza sativa cv. Nipponbare were surface-sterilized in sodium hypochlorite solution (2% active chlorine), washed repeatedly with sterile water, and planted in autoclaved sand. Plants were grown in phytochambers with a 12-h day/night cycle at 28°C/23°C and were watered every second day with half-strength Hoagland solution. For mycorrhizal experiments, Hoagland solution was supplemented with 100 μM KH2PO4 and, for Pi experiments, with 5, 100, and 500 μM KH2PO4. Aseptically grown Glomus intraradices was used to inoculate rice roots as described in ref. 31. For each treatment, 45 plants were raised and harvested at 6 weeks.
Pathogen infection. The Magnaporthe grisea strain Guy 11 and Fusarium moniliforme were used to infect the roots of 10-day-old rice seedlings, as outlined in refs. 31 and 32. Root tissue was collected at 2, 4, and 6 days postinoculation (dpi).
RNA Isolation and GeneChip (Affymetrix) Hybridization Analysis. Total RNA was isolated from frozen root tissue by using the RNEasy Plant Maxi kit (Qiagen, Hilden, Germany) following the manufacturer's instructions. The Syngenta-designed rice GeneChip microarray (sySYNG003a) was used for this study (Syngenta, Basel). RNA labeling and hybridization were performed as described in ref. 33 (for a detailed description of the GeneChip hybridization analysis, see Supporting Text, which is published as supporting information on the PNAS web site).
cDNA Synthesis and Real-Time RT-PCR. Total RNA was DNase-I-treated according to the provided protocol (Invitrogen Life Technologies). Before first-strand cDNA synthesis, the absence of genomic DNA in the RNA samples was confirmed by PCR. First-strand cDNA synthesis was carried out following the manufacturer's instructions by using SuperScript II Reverse Transcriptase (Invitrogen Life Technologies). Primer design for real-time RT-PCR was carried out with the software primer express (Applied Biosystems) (see Table 1, which is published as supporting information on the PNAS web site). To ensure gene-specific amplification, primers were designed against the 3′ UTR of every candidate gene. For genes for which no 3′ UTR could be identified, at least one primer sequence spanned an exon–exon boundary. For 119 of the 256 candidate genes, the sequence information was obtained from full-length cDNA libraries. For the remaining 137 genes, identification of 3′ UTRs and/or exon–exon boundaries relied on gene-structure predictions. To further ensure gene specificity, primer sequences were compared with the rice genome by using blastn. Real-time RT-PCR was carried out in optical 384-well plates and labeled by using the SYBR green master mix (Applied Biosystems), and the fluorescence was quantified with a Prism 7900 HT sequence detection system (Applied Biosystems). Because of the large-scale nature of the project, liquid handling for the 384-well plates was performed with a Biomek robot (Beckman Coulter). The expression of each gene was assayed in triplicate in a total volume of 10 μl containing 1× SYBR green reagent, 200 nM each gene-specific primer pair, and 1 ng of cDNA or 50 ng of fungal genomic DNA. The thermal profile recommended by Applied Biosystems was used for amplification (50°C for 2 min, 95°C for 10 min, 40 cycles of 95°C for 15 s and 60°C for 1 min). To verify amplification of one specific target cDNA, a melting-curve analysis was included according to the thermal profile suggested by the manufacturer (95°C for 15 s, 60°C for 15 s, and 95°C for 15 s). The generated data were analyzed with sds 2.2 software (Applied Biosystems). For all amplification plots, the baseline data were set with the automatic CT function available with sds 2.2, calculating the optimal baseline range and threshold values by using the AutoCt algorithm (sds 2.2 user's manual).
Data Processing and Normalization. GeneChip. For a description of the applied strategy to calculate gene-expression values and normalization, see Supporting Text.
Real-time RT-PCR. Three constitutively expressed control genes were selected for normalization of candidate-gene expression levels. These genes were selected as constitutive controls because of their steadily high transcript levels when profiling RNAs from a variety of biological conditions and developmental stages (data not shown). The genes were polyubiquitin 1 (OsRubQ1) (34); a gene encoding a protein with homology to the Arabidopsis thaliana ubiquitin-conjugating enzyme (AtUBC9) (35); and OsSMT3 (also known as OsSUMO-1) (36), whose product is annotated as a ubiquitin-like protein. The CT values determined for the 3 control genes remained consistent across all PCR replicates (data not shown). The geometric mean expression levels of the 3 control genes were calculated and the error propagation rules were applied to define normalization factor and standard deviation (37). Constitutive controls were measured in each PCR run. Candidate-gene expression data from real-time RT-PCR were plotted as 2(40–CT)/10, as described in ref. 38, and normalized against the constitutive reference genes. According to the manufacturer's instructions, a CT value of ≥39 corresponds to nonspecific amplification marking the limits of detection, which is equivalent to an expression threshold of 0.2. To minimize the effect of low values generating unrealistically high changes, we corrected lower values to 0.2. A gene was defined as differentially regulated after applying the Student t test with a false discovery rate <0.05. The efficiency rate of PCR amplification was analyzed for 10 representative genes by measuring a series of input cDNA concentrations from 0.75 to 50 ng (n = 3) and was found to be highly linear (Pearson correlation coefficient r > 0.95). The data were imported into genespring software (Agilent Technologies, Palo Alto, CA) for further analysis.
Results
Rice Transcriptome Analysis. Two independent experiments were performed to compare wild-type O. sativa cv. Nipponbare colonized by G. intraradices with mock-inoculated plants. Colonization levels, expressed as percentages of total root colonized (39, 40) reached 86 ±6% and 85 ±9% at 6 weeks postinoculation (wpi). To monitor global transcriptional changes in rice in response to mycorrhizal colonization, we used a custom-designed whole-genome rice GeneChip array. This DNA chip consisted of probe sets corresponding to ≈50,000 unique known and predicted genes and EST clusters based on the completed rice genome sequences (29, 30). Each gene was represented by at least 1 probe set of 10 perfect-match probes; the probes were 25-mer oligonucleotides. Technical assessment of the GeneChip microarray revealed high reproducibility and sensitivity (www.syngentabiotech.com/en/downloads/rice%20whole%20genome%20report1.pdf).
The aim of this study was to create a robust dataset by identifying genes with moderate to high expression levels and with clear changes in transcript level. Because of the second-order kinetics of hybridization, the signal-to-noise ratio decreases exponentially with reduced transcript abundance; therefore, stringent filtering conditions were applied after normalization of the data. Background expression was set at 50, which is equivalent to the mean values (26.65 ± 5.23) of the negative controls (n = 37) plus four times the standard deviation. Genes were considered to be regulated by mycorrhizal colonization if they showed a ≥3-fold change in expression level in colonized plants relative to mock-inoculated plants at 6 wpi in both experiments. A total of 256 genes met these criteria, of which 20 were ≥3-fold down-regulated (3- to 14-fold) and 236 were ≥3-fold up-regulated (3- to 203-fold). The tissue was harvested after symbiosis was established, and thus, genes that were differentially regulated only at earlier infection stages were undetected, as were genes with weak changes in expression. The previously described mycorrhiza-induced phosphate transporter OsPT11 (31) was present on the chip and was used as a positive control for the mycorrhiza-specific accumulation of transcripts. OsPT11 was one of the strongest up-regulated genes (154-fold increase).
Validation of GeneChip Data by Real-Time RT-PCR. One of the two RNA preparations used for chip hybridization was tested by real-time RT-PCR to confirm that 224 of the 256 candidate genes were regulated upon mycorrhizal colonization. Increases in mRNA levels of 1.5- to >300,000-fold were seen for 209 genes, whereas decreases of 2.4- to 23-fold were seen for 15 genes (Table 1). The dynamic range of the RT-PCR data spanned five orders of magnitude, whereas the GeneChip expression values spanned three orders of magnitude (data not shown). The mycorrhiza-inducible OsPT11 marker gene (31) was one of the 224 confirmed genes, with >1,500-fold up-regulation in colonized versus mock-treated roots. To test for interference by fungal transcripts, a representative set of 40 primer pairs corresponding to 40 up-regulated rice genes were tested on fungal genomic DNA. No amplification products were obtained, confirming that the monitored transcript accumulation was of rice origin (data not shown).
Rice Genes Regulated in Response to Fungal Pathogen Infection. To determine whether rice uses its symbiont-regulated pathways to respond to pathogens, expression of the 224 mycorrhiza-inducible genes was examined after challenging roots with two pathogenic fungi, the hemibiotrophic M. grisea (causes blast disease) and the necrotrophic F. moniliforme (causes bakanae/foot rot). Expression was examined at 6 dpi, when both fungi had penetrated root tissue. OsPR4 (pathogenesis-related type 4) was shown previously to be induced in leaves infected by M. grisea (41). Transcript levels of OsPR4 increased 21-fold and 15-fold in roots infected with M. grisea and F. moniliforme, respectively. A total of 26 genes were up-regulated and 4 genes were down-regulated in all three interactions (Fig. 1A; see also Table 2, which is published as supporting information on the PNAS web site). In addition, roots infected with G. intraradices and M. grisea shared 34 up-regulated and 9 down-regulated genes; those with G. intraradices and F. moniliforme shared 21 up-regulated and 1 down-regulated gene (Fig. 1 A and Table 2). These observations were confirmed by examining selected up-regulated genes in replicates at 2 and 4 dpi for both pathogenic interactions. At 4 dpi, elevated transcript levels were observed for all 30 tested genes upon infection with both pathogens. At 2 dpi, 12 and 15 genes were up-regulated by M. grisea and F. moniliforme infection, respectively, suggesting that 3 genes were induced only at 4 dpi and at later stages of M. grisea infection (data not shown). The results corroborated the differential expression of 95 genes in response to colonization by mycorrhizal fungi and one or both of the two pathogens.
Fig. 1.
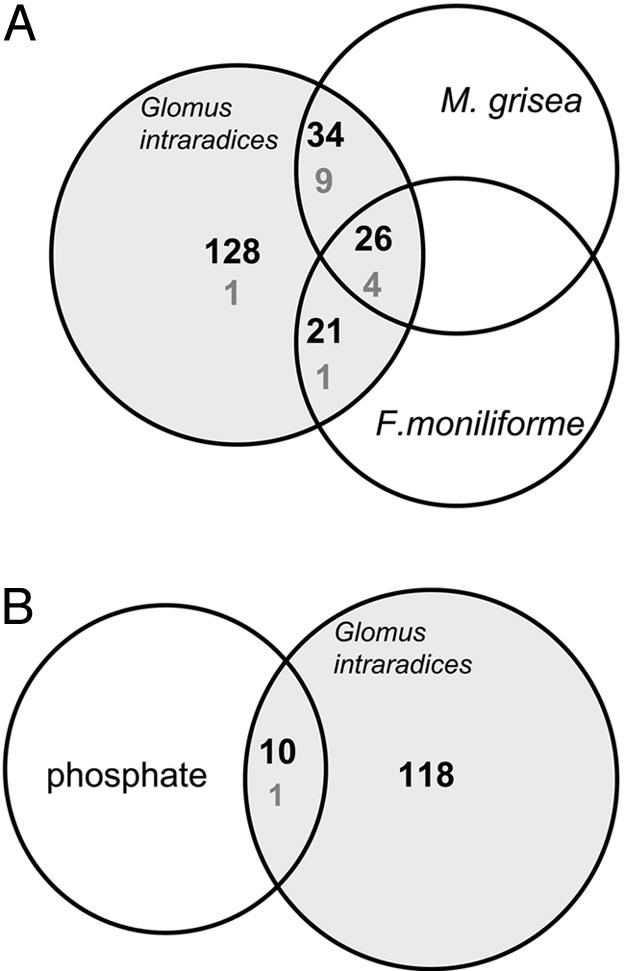
Schematic overview of the number of mycorrhiza-responsive rice genes present in each category. (A) Pathogenic interactions. (B) Elevated Pi supply. Black numbers, induced genes; gray numbers, suppressed genes.
Rice Genes Regulated in Response to Increased Pi Availability. Because mycorrhiza assists the plant with Pi acquisition, we sought to identify mycorrhiza-inducible genes that were regulated specifically in response to enhanced Pi supply. Real-time RT-PCR was performed for the 129 mycorrhiza-regulated genes whose expression did not change upon pathogen infection. These included 128 up- and 1 down-regulated gene. RNA was taken from roots supplemented with 5, 100, or 500 μM Pi. OsPT2, which is inducible by Pi starvation, was used as a positive control (31). Transcript levels of OsPT2 were 1.6- and 30-fold elevated in roots grown at 5 μM, relative to those at 100 μM and 500 μM, respectively. Of the 129 candidate genes, 10 were induced and 1 repressed by increased Pi concentrations (Fig. 1B and Table 2).
Rice Genes Expressed Exclusively in Mycorrhiza. Among the 118 mycorrhiza-induced genes that showed no transcriptional changes after pathogen or Pi treatment (Fig. 1B), 12 had no detectable background and were expressed exclusively in response to mycorrhiza (Table 2). Because real-time RT-PCR has a reported sensitivity of one transcript per 1,000 cells (38), we conclude that these genes are not transcribed in the absence of mycorrhizal symbiosis and, hence, are validated marker genes for AM symbiosis. Relative expression values for the 12 genes ranged from 1.8 to 67,465, with OsAM1 expressed the most (Tables 1 and 2).
Mycorrhiza-Regulated Genes Are Conserved in Mono- and Dicotyledonous Plant Species. A collection of 625 dicotyledonous genes previously reported to be induced or repressed upon mycorrhizal colonization are referred to in the publications listed (15, 17–28, 42–65) (see Table 3, which is published as supporting information on the PNAS web site). A reciprocal tblastx (66) analysis was conducted between the 625 dicot and the 224 rice genes by using a cutoff blast probability score of 1.00E-06. For both the monocot and dicot samples, a mixture of complete and partial sequences was used. A small fraction of the dicot sequences were already described and characterized in the literature, and complete cDNAs were available. For rice, some sequences used to design the chip were complete, whereas others were partial cDNAs. A total of 96 hits were identified, of which 76 showed the same expression pattern in mono- and dicotyledonous plants, whereas for 20 genes, opposite trends of expression were observed (see Table 4, which is published as supporting information on the PNAS web site). Of the 76 matches, 44 corresponded to rice genes specifically regulated on mycorrhizal colonization, 25 belonged to the broader fungal-interaction program, and 7 were Pi-nutrition-related (Table 2). The symbiosis-specific hits included phylogenetically related homologues of the mycorrhiza-induced high-affinity phosphate transporter from Medicago truncatula, potato, and rice (15, 31, 65), which are predicted to be functional orthologues (65).
Discussion
Some genes in legumes that determine the outcome of infection by fungal or bacterial symbionts are shared (8–12). In addition, expression profiling of legume roots responding to fungal (mycorrhizal) or bacterial symbiosis revealed ≈100 genes with similar patterns of expression (25, 28). The similarity of intracellular structures formed during the interaction with AM and biotrophic pathogenic fungi, plus the similarity of host-response to bacterial and fungal symbionts, led to the prediction that plants might use the same genetic programs for responding to pathogens (7). Recently, this view was supported by the discovery of a leguminous receptor-like kinase required for AM symbiosis, nodulation, and root-knot nematode parasitism (13).
Arabidopsis and rice are the two plant species whose genomes have been sequenced and for which whole transcriptome analyses can be performed (29, 30, 67). In contrast to Arabidopsis, rice is a host for AM fungi and, given the available tools, a uniquely attractive plant for studying the mechanism of AM symbiosis. For these reasons, we chose rice to investigate whether plants use the same genetic pathways to respond to fungal symbionts and fungal pathogens.
The pathogens we selected differ in their strategies for invading roots and accessing host nutrients. Glomalean fungi are obligate biotrophs, relying on a supply of organic nutrients from living host cells. M. grisea is a hemibiotrophic fungus, exhibiting both a transient type of biotrophy and a necrotrophic phase (68). It was shown recently that M. grisea not only is a devastating foliar pathogen but also possesses attributes of root-infecting fungi, including inter- and intracellular growth within the root cortex (32), reminiscent of Glomalean fungi. F. moniliforme, on the other hand, is a necrotrophic fungus with no biotrophic phase. Upon inoculation of rice roots, F. moniliforme penetrates the root cortex by disorganizing the rhizodermal cell layer and grows intercellularly before disintegrating cortex tissue (31). Among the 224 mycorrhiza-regulated genes, a total of 30 genes (26 up- and 4 down-regulated) were differentially expressed in a similar way upon colonization by both pathogenic fungi. This expression pattern reflects a general plant response to colonization by fungi. Among the induced genes, 1 encodes a WRKY transcription factor (OsAM205). WRKY transcription factors are an ancient type of eukaryotic transcription factors comprising a large multigene family in plants but are absent from yeast and animals (69). Individual members play a role in plant development and defense against pathogen attack (69). Induction of OsAM205 during the three interactions suggests the transcription factor to be involved in the regulation of the plant's response to the different fungal infections. Moreover, comparison of G. intraradices with either M. grisea- or F. moniliforme-infected roots revealed additional genes encoding putative regulatory proteins, such as zinc-finger or bZIP transcription factors (e.g., OsAM115, OsAM137) or protein kinases (e.g., OsAM41, OsAM191). It will be important to determine which role these proteins play in controlling both symbiotic and pathogenic plant–fungal interaction. In summary, 95 of 224 mycorrhiza-induced rice genes (43%) responded similarly to infection by fungal pathogens (Table 2). It is interesting that more genes were shared between the biotroph/hemibiotroph-infected (43 genes) than between the biotroph/necrotroph-infected (22 genes) roots, which might be a molecular reflection of higher similarity between interactions relying on related infection strategies.
It has been a general understanding that plant recognition of avirulent pathogens leads to the activation of defense mechanisms and limited pathogen invasion, whereas the lack of recognition leads to disease (refs. 70 and 71 and citations therein). However, expression profiles of compatible and incompatible interactions in Arabidopsis overlap but differ quantitatively (72), suggesting an active participation of the plant in either interaction. Typical of biotrophic fungi is the avoidance or the long-term suppression of plant defense responses (68, 71). Upon colonization by biotrophic AM fungi, defense genes become either promptly suppressed or transiently induced at early stages of the interaction (ref. 26 and references therein). The present work focused on a mature stage of the association, when early stages of the interaction are underrepresented. Thus, there was a selection against defense-related genes and an enrichment of potential compatibility-related genes. In fact, marker genes typical of plant defense response (e.g., PR1) were not induced during symbiosis, indicating that the list of genes described here may provide a set of previously unknown compatibility factors.
AM fungi enhance the nutrition of plants by transferring Pi from the soil into the cortex of roots at the periarbuscular interface (16). In this report, the symbiosis was examined at an advanced stage, when beneficial effects of Pi nutrition were most pronounced. Pi-nutrition-associated genes were identified by their transcriptional changes in response to Pi availability. We examined the 129 mycorrhiza-specific genes and found 11 (10 induced and 1 suppressed) that responded similarly to symbiosis and exogenous Pi. A moderate overlap between Pi-nutrition-related genes was also observed by Liu et al. (26), who found 5 of 46 mycorrhiza-responsive M. truncatula genes to be commonly up-regulated; none are homologous to the rice mycorrhiza-specific genes, possibly reflecting different molecular responses to nutritional changes between mono- and dicotyledonous plants.
A putative high-affinity Pi transporter was identified (OsAM113) among the large group of genes with basal transcription but induction upon mycorrhizal colonization. The sequence of OsAM113 corresponds to the previously reported presumed pseudogene OsPT13 (31), which is phylogenetically isolated relative to other known mono- and dicotyledonous Pi transporters (31, 65). Similar to OsPT11, OsPT13 was not regulated by Pi supply, but both genes were specifically induced during the AM symbiosis. The level of induction differed substantially, with >1,500-fold for OsPT11 and 14-fold for OsPT13. The results suggest that OsPT13 may moderately contribute to symbiotic Pi uptake.
The majority (53%) of the rice mycorrhizal-response genes exhibited a mycorrhiza-specific expression profile under the conditions applied. These up-regulated genes can be divided into those with basal mRNA levels in control roots and those detected only in mycorrhizal roots. Transcripts for 12 genes were not detected in the absence of symbiosis. Of these, 1 gene was found to code for a putative peroxidase (OsAM1), the gene most strongly induced by mycorrhiza. Another gene encoded a putative germin-like protein (OsAM85), the homologue of which is specifically induced in mycorrhizal roots of M. truncatula (62). Members of both multigene families have H2O2-producing and -scavenging enzyme activities (ref. 73 and citations therein and ref. 74). Hydrogen peroxide may play a role in plant development, such as root elongation (75) and responses to stress, including pathogen attack (76) and mycorrhizal colonization (77). It is noteworthy that three of the rice mycorrhiza-responsive genes encode germin-like proteins (OsAM4, OsAM9, OsAM85); all were strongly induced upon mycorrhizal colonization (Table 1) and cluster to a 6-kb region on chromosome 9, possibly as a result of gene-duplication events.
The origin of the AM symbiosis has been estimated to be at 400–460 million years ago (1–5), predating the divergence of mono- and dicotyledonous plants at 120–200 million years ago (78). AM fungi have no specific host range, and they colonize most flowering plants. Despite the phylogenetic divergence of mono- and dicotyledonous plant species, parts of their host-response to mycorrhizal colonization are probably conserved. We compared the mycorrhiza-responsive genes of rice with those that have been reported from dicotyledonous plants, and approximately one-third (76 of 224) are homologous. These genes have a wide variety of functions, including transcriptional regulation, signal transduction, transport, and proteolysis, etc. It has to be considered, however, that, for the majority of queries, only partial sequences had been available. More complete sequence information will be required for the identification of orthologous gene pairs. The data presented here provide a glimpse of common mechanisms of the symbiotic machinery in mono- and dicotyledonous plants.
We have observed conservation of the transcriptional response of rice to colonization by symbionts and pathogens, and a portion of these molecular components are shared between mono- and dicotyledonous plants. Pathogens do not initially cause disease, which occurs only later, after infection has been established. Therefore, the responses that are shared between pathogen and symbiont infections may play a role in compatibility. The excellent genetic tools of rice and its relatives should enable the clarification of roles played by the genes we have identified.
Supplementary Material
Acknowledgments
We thank Patrick King for critically reading the manuscript and Laurent Falquet for assisting during the bioinformatics analyses. This work was supported by Swiss National Science Foundation Grant 3100A0-104132/1.
Author contributions: A.O., S.P.B., and U.P. designed research; S.G., H.-S.C., T.Z., A.S., A.O., C.R., M.D., P.D., and U.P. performed research; S.G., H.-S.C., T.Z., V.I., E.J.O., M.D., P.D., and U.P. analyzed data; and S.G., S.P.B., and U.P. wrote the paper.
Abbreviations: AM, arbuscular mycorrhizal; dpi, days postinoculation; wpi, weeks postinoculation.
References
- 1.Pirozynski, K. A. & Malloch, D. W. (1975) BioSystems 6, 153–164. [DOI] [PubMed] [Google Scholar]
- 2.Remy, W., Taylor, T. N., Hass, H. & Kerp, H. (1994) Proc. Natl. Acad. Sci. USA 91, 11841–11843. [DOI] [PMC free article] [PubMed] [Google Scholar]
- 3.Simon, L., Bousquet, J., Lévesque, R. C. & Lalonde, M. (1993) Nature 363, 67–69. [Google Scholar]
- 4.Heckman, D. S., Geiser, D. M., Eidell, B. R., Stauffer, R. L., Kardos, N. L. & Hedges, S. B. (2001) Science 293, 1129–1133. [DOI] [PubMed] [Google Scholar]
- 5.Redecker, D., Kodner, R. & Graham, L. E. (2000) Science 289, 1920–1921. [DOI] [PubMed] [Google Scholar]
- 6.Kistner, C. & Parniske, M. (2002) Trends Plant Sci. 7, 511–518. [DOI] [PubMed] [Google Scholar]
- 7.Parniske, M. (2000) Curr. Opin. Plant Biol. 3, 320–328. [DOI] [PubMed] [Google Scholar]
- 8.Stracke, S., Kistner, C., Yoshida, S., Mulder, L., Sato, S., Kaneko, T., Tabata, S., Sandal, N., Stougaard, J., Szczyglowski, K. & Parniske, M. (2002) Nature 417, 959–962. [DOI] [PubMed] [Google Scholar]
- 9.Levy, J., Bres, C., Geurts, R., Chalhoub, B., Kulikova, O., Duc, G., Journet, E. P., Ane, J. M., Lauber, E., Bisseling, T., et al. (2004) Science 303, 1361–1364. [DOI] [PubMed] [Google Scholar]
- 10.Endre, G., Kereszt, A., Kevei, Z., Mihacea, S., Kalo, P. & Kiss, G. B. (2002) Nature 417, 962–966. [DOI] [PubMed] [Google Scholar]
- 11.Ane, J. M., Kiss, G. B., Riely, B. K., Penmetsa, R. V., Oldroyd, G. E., Ayax, C., Levy, J., Debelle, F., Baek, J. M., Kalo, P., et al. (2004) Science 303, 1364–1367. [DOI] [PubMed] [Google Scholar]
- 12.Imaizumi-Anraku, H., Takeda, N., Charpentier, M., Perry, J., Miwa, H., Umehara, Y., Kouchi, H., Murakami, Y., Mulder, L., Vickers, K., et al. (2004) Nature 433, 527–531. [DOI] [PubMed] [Google Scholar]
- 13.Weerasinghe, R. R., Bird, D. M. & Allen, N. S. (2005) Proc. Natl. Acad. Sci. USA 102, 3147–3152. [DOI] [PMC free article] [PubMed] [Google Scholar]
- 14.Harrison, M. J. (1999) Annu. Rev. Plant Physiol. Plant Mol. Biol. 50, 361–389. [DOI] [PubMed] [Google Scholar]
- 15.Harrison, M. J., Dewbre, G. R. & Liu, J. (2002) Plant Cell 14, 2413–2429. [DOI] [PMC free article] [PubMed] [Google Scholar]
- 16.Smith, S. E. & Read, D. J. (1997) Mycorrhizal Symbiosis (Academic, San Diego), 2nd Ed.
- 17.van Buuren, M. L., Maldonado-Mendoza, I. E., Trieu, A. T., Blaylock, L. A. & Harrison, M. J. (1999) Mol. Plant–Microbe Interact. 12, 171–181. [DOI] [PubMed] [Google Scholar]
- 18.Taylor, J. & Harrier, L. A. (2003) Plant Mol. Biol. 51, 619–629. [DOI] [PubMed] [Google Scholar]
- 19.Lapopin, L., Gianinazzi-Pearson, V. & Franken, P. (1999) Plant Mol. Biol. 41, 669–677. [DOI] [PubMed] [Google Scholar]
- 20.Martin-Laurent, F., van Tuinen, D., Dumas-Gaudot, E., Gianinazzi-Pearson, V., Gianinazzi, S. & Franken, P. (1997) Mol. Gen. Genet. 256, 37–44. [DOI] [PubMed] [Google Scholar]
- 21.Wulf, A., Manthey, K., Doll, J., Perlick, A. M., Linke, B., Bekel, T., Meyer, F., Franken, P., Kuster, H. & Krajinski, F. (2003) Mol. Plant–Microbe Interact. 16, 306–314. [DOI] [PubMed] [Google Scholar]
- 22.Grunwald, U., Nyamsuren, O., Tamasloukht, M., Lapopin, L., Becker, A., Mann, P., Gianinazzi-Pearson, V., Krajinski, F. & Franken, P. (2004) Plant Mol. Biol. 55, 553–566. [DOI] [PubMed] [Google Scholar]
- 23.Weidmann, S., Sanchez, L., Descombin, J., Chatagnier, O., Gianinazzi, S. & Gianinazzi-Pearson, V. (2004) Mol. Plant–Microbe Interact. 17, 1385–1393. [DOI] [PubMed] [Google Scholar]
- 24.Brechenmacher, L., Weidmann, S., Van Tuinen, D., Chatagnier, O., Gianinazzi, S., Franken, P. & Gianinazzi-Pearson, V. (2004) Mycorrhiza 14, 253–262. [DOI] [PubMed] [Google Scholar]
- 25.Journet, E. P., van Tuinen, D., Gouzy, J., Crespeau, H., Carreau, V., Farmer, M. J., Niebel, A., Schiex, T., Jaillon, O., Chatagnier, O., et al. (2002) Nucleic Acids Res. 30, 5579–5592. [DOI] [PMC free article] [PubMed] [Google Scholar]
- 26.Liu, J., Blaylock, L. A., Endre, G., Cho, J., Town, C. D., VandenBosch, K. A. & Harrison, M. J. (2003) Plant Cell 15, 2106–2123. [DOI] [PMC free article] [PubMed] [Google Scholar]
- 27.Küster, H., Hohnjec, N., Krajinski, F., El, Y. F., Manthey, K., Gouzy, J., Dondrup, M., Meyer, F., Kalinowski, J., Brechenmacher, L., et al. (2004) J. Biotechnol. 108, 95–113. [DOI] [PubMed] [Google Scholar]
- 28.Manthey, K., Krajinski, F., Hohnjec, N., Firnhaber, C., Puhler, A., Perlick, A. M. & Kuster, H. (2004) Mol. Plant–Microbe Interact. 17, 1063–1077. [DOI] [PubMed] [Google Scholar]
- 29.Goff, S. A., Ricke, D., Lan, T. H., Presting, G., Wang, R., Dunn, M., Glazebrook, J., Sessions, A., Oeller, P., Varma, H., et al. (2002) Science 296, 92–100. [DOI] [PubMed] [Google Scholar]
- 30.Yu, J., Hu, S., Wang, J., Wong, G. K., Li, S., Liu, B., Deng, Y., Dai, L., Zhou, Y., Zhang, X., et al. (2002) Science 296, 79–92. [DOI] [PubMed] [Google Scholar]
- 31.Paszkowski, U., Kroken, S., Roux, C. & Briggs, S. P. (2002) Proc. Natl. Acad. Sci. USA 99, 13324–13329. [DOI] [PMC free article] [PubMed] [Google Scholar]
- 32.Sesma, A. & Osbourn, A. E. (2004) Nature 431, 582–586. [DOI] [PubMed] [Google Scholar]
- 33.Zhu, T. & Wang, X. (2000) Plant Physiol. 124, 1472–1476. [DOI] [PMC free article] [PubMed] [Google Scholar]
- 34.Wang, J., Jiang, J. & Oard, J. H. (2000) Plant Sci. 156, 201–211. [DOI] [PubMed] [Google Scholar]
- 35.Girod, P. A., Carpenter, T. B., van Nocker, S., Sullivan, M. L. & Vierstra, R. D. (1993) Plant J. 3, 545–552. [DOI] [PubMed] [Google Scholar]
- 36.Lapenta, V., Chiurazzi, P., van der Spek, P., Pizzuti, A., Hanaoka, F. & Brahe, C. (1997) Genomics 40, 362–366. [DOI] [PubMed] [Google Scholar]
- 37.Vandesompele, J., De Preter, K., Pattyn, F., Poppe, B., Van Roy, N., De Paepe, A. & Speleman, F. (2002) Genome Biol. 3, RESEARCH0034. [DOI] [PMC free article] [PubMed]
- 38.Czechowski, T., Bari, R. P., Stitt, M., Scheible, W. R. & Udvardi, M. K. (2004) Plant J. 38, 366–379. [DOI] [PubMed] [Google Scholar]
- 39.Giovanetti, M. & Mosse, B. (1980) New Phytologist 84, 489–500. [Google Scholar]
- 40.Brundrett, M. C., Piché, Y. & Peterson, R. L. (1984) Can. J. Bot. 62, 2128–2134. [Google Scholar]
- 41.Agrawal, G., Jwa, N.-S., Han, K.-S., Agrawal, V. & Rakwal, R. (2003) Plant Physiol. Biochem. 41, 81–90. [Google Scholar]
- 42.Harrison, M. J. & Ra, D. (1994) Mol. Plant–Microbe Interact. 6, 643–654. [Google Scholar]
- 43.Franken, P. & Gnädinger, F. (1994) Mol. Plant–Microbe Interact. 7, 612–620. [Google Scholar]
- 44.Blee, K. A. & Anderson, A. J. (1996) Plant Physiol. 110, 675–688. [DOI] [PMC free article] [PubMed] [Google Scholar]
- 45.Harrison, M. J. (1996) Plant J. 9, 491–503. [DOI] [PubMed] [Google Scholar]
- 46.Roussel, H., Bruns, S., Gianinazzi-Pearson, V., Hahlbrock, K. & Franken, P. (1997) Plant Sci. 126, 203–210. [Google Scholar]
- 47.van Rhijn, P., Fang, Y., Galili, S., Shaul, O., Atzmon, N., Wininger, S., Eshed, Y., Lum, M., Li, Y., To, V. V., et al. (1997) Proc. Natl. Acad. Sci. USA 94, 5467–5472. [DOI] [PMC free article] [PubMed] [Google Scholar]
- 48.Krajinski, F., Martin-Laurent, F., Gianinazzi, S., Gianinazzi-Pearson, V. & Franken, P. (1998) Physiol. Mol. Plant Pathol. 52, 297–307. [Google Scholar]
- 49.Albrecht, C., Geurts, R., Lapeyrie, F. & Bisseling, T. (1998) Plant J. 15, 605–614. [DOI] [PubMed] [Google Scholar]
- 50.Balestrini, R., Perotto, S., Gasverde, E., Dahiya, P., Guldmann, L.-L., Brewin, N. & Bonfante, P. (1999) Mol. Plant–Microbe Interact. 12, 785–791. [Google Scholar]
- 51.Ruiz-Lozano, J., Roussel, H., Gianinazzi, S. & Gianinazzi-Pearson, V. (1999) Mol. Plant–Microbe Interact. 12, 976–984. [Google Scholar]
- 52.Krajinski, F., Biela, A., Schubert, D., Gianinazzi-Pearson, V., Kaldenhoff, R. & Franken, P. (2000) Planta. 211, 85–90. [DOI] [PubMed] [Google Scholar]
- 53.Gianinazzi-Pearson, V., Arnould, C., Oufattole, M., Arango, M. & Gianinazzi, S. (2000) Planta 211, 609–613. [DOI] [PubMed] [Google Scholar]
- 54.Salzer, P., Bonanomi, A., Beyer, K., Vogeli-Lange, R., Aeschbacher, R. A., Lange, J., Wiemken, A., Kim, D., Cook, D. R. & Boller, T. (2000) Mol. Plant–Microbe Interact. 13, 763–777. [DOI] [PubMed] [Google Scholar]
- 55.Roussel, H., Tuinen, D. V., Franken, P., Gianinazzi, S. & Gianinazzi-Pearson, V. (2001) Plant Soil 232, 13–19. [Google Scholar]
- 56.Rausch, C., Daram, P., Brunner, S., Jansa, J., Laloi, M., Leggewie, G., Amrhein, N. & Bucher, M. (2001) Nature 414, 462–470. [DOI] [PubMed]
- 57.Journet, E. P., El-Gachtouli, N., Vernoud, V., de Billy, F., Pichon, M., Dedieu, A., Arnould, C., Morandi, D., Barker, D. G. & Gianinazzi-Pearson, V. (2001) Mol. Plant–Microbe Interact. 14, 737–748. [DOI] [PubMed] [Google Scholar]
- 58.Fester, T., Schmidt, D., Lohse, S., Walter, M. H., Giuliano, G., Bramley, P. M., Fraser, P. D., Hause, B. & Strack, D. (2002) Planta 216, 148–154. [DOI] [PubMed] [Google Scholar]
- 59.Hildebrandt, U., Schmelzer, E. & Bothe, H. (2002) Physiol. Plant. 115, 125–136. [DOI] [PubMed] [Google Scholar]
- 60.Blee, K. A. & Anderson, A. J. (2002) Plant Mol. Biol. 50, 197–211. [DOI] [PubMed] [Google Scholar]
- 61.Ferrol, N., Pozo, M. J., Antelo, M. & Azcon-Aguilar, C. (2002) J. Exp. Bot. 53, 1683–1687. [DOI] [PubMed] [Google Scholar]
- 62.Doll, J., Hause, B., Demchenko, K., Pawlowski, K. & Krajinski, F. (2003) Plant Cell Physiol. 44, 1208–1214. [DOI] [PubMed] [Google Scholar]
- 63.Hohnjec, N., Perlick, A. M., Puhler, A. & Kuster, H. (2003) Mol. Plant–Microbe Interact. 16, 903–915. [DOI] [PubMed] [Google Scholar]
- 64.Gao, L. L., Knogge, W., Delp, G., Smith, F. A. & Smith, S. E. (2004) Mol. Plant–Microbe Interact. 17, 1103–1113. [DOI] [PubMed] [Google Scholar]
- 65.Karandashov, V. & Bucher, M. (2005) Trends Plant Sci. 10, 22–29. [DOI] [PubMed] [Google Scholar]
- 66.Altschul, S. F., Madden, T. L., Schaffer, A. A., Zhang, J., Zhang, Z., Miller, W. & Lipman, D. J. (1997) Nucleic Acids Res. 25, 3389–3402. [DOI] [PMC free article] [PubMed] [Google Scholar]
- 67.The Arabidopsis Genome Initiative (2000) Nature 408, 796–815. [DOI] [PubMed] [Google Scholar]
- 68.Mendgen, K. & Hahn, M. (2002) Trends Plant Sci. 7, 352–356. [DOI] [PubMed] [Google Scholar]
- 69.Ulker, B. & Somssich, I. E. (2004) Curr. Opin. Plant Biol. 7, 491–498. [DOI] [PubMed] [Google Scholar]
- 70.Maleck, K., Levine, A., Eulgem, T., Morgan, A., Schmid, J., Lawton, K. A., Dangl, J. L. & Dietrich, R. A. (2000) Nat. Genet. 26, 403–410. [DOI] [PubMed] [Google Scholar]
- 71.Panstruga, R. (2003) Curr. Opin. Plant Biol. 6, 320–326. [DOI] [PubMed] [Google Scholar]
- 72.Tao, Y., Xie, Z., Chen, W., Glazebrook, J., Chang, H. S., Han, B., Zhu, T., Zou, G. & Katagiri, F. (2003) Plant Cell 15, 317–330. [DOI] [PMC free article] [PubMed] [Google Scholar]
- 73.Christensen, A., Thordal-Christensen, H., Zimmermann, G., Gjetting, T., Lyngkjaer, M., Dudler, R. & Schweizer, P. (2004) Mol. Plant–Microbe Interact. 17, 109–117. [DOI] [PubMed] [Google Scholar]
- 74.Wojtaszek, P. (1997) Biochem. J. 322, 681–692. [DOI] [PMC free article] [PubMed] [Google Scholar]
- 75.Liszkay, A., van der Zalm, E. & Schopfer, P. (2004) Plant Physiol. 136, 3114–3123. [DOI] [PMC free article] [PubMed] [Google Scholar]
- 76.Laloi, C., Apel, K. & Danon, A. (2004) Curr. Opin. Plant Biol. 7, 323–328. [DOI] [PubMed] [Google Scholar]
- 77.Salzer, P., Corbiere, H. & Boller, T. (1999) Planta 208, 319–325. [Google Scholar]
- 78.Wolfe, K. H., Gouy, M., Yang, Y. W., Sharp, P. M. & Li, W. H. (1989) Proc. Natl. Acad. Sci. USA 86, 6201–6205. [DOI] [PMC free article] [PubMed] [Google Scholar]
Associated Data
This section collects any data citations, data availability statements, or supplementary materials included in this article.