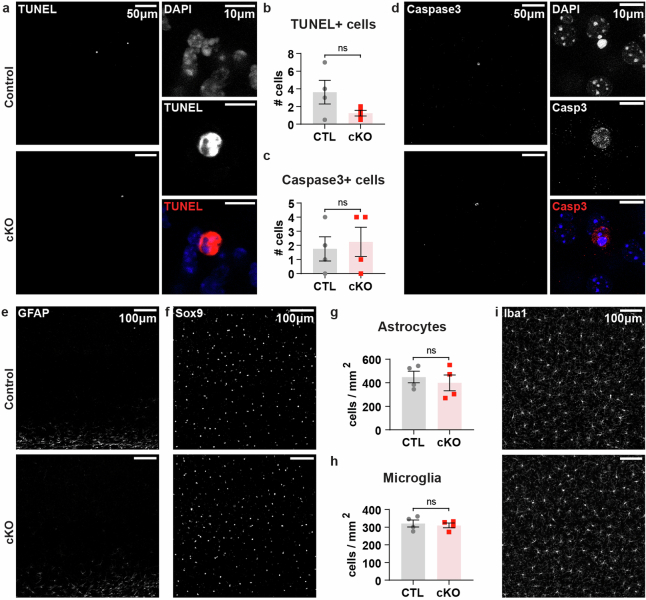
Extended Data Fig. 6. Cell death, astrocyte density, and microglia density in adult control and Myrf cKO mice.
(A) Example images and (B) quantification of TUNEL immunostaining in visual cortex (p = 0.1748). (C) Quantification (p = 0.7216) and (D) example images of Caspase+ cells in visual cortex. (E) Example images of GFAP immunostaining in visual cortex. (F) Example images and (G) quantification of Sox9+ astrocytes (p = 0.5736) in visual cortex. (H) Quantification (p = 0.6627) and (I) example images of Iba1+ microglia in visual cortex. Panel B: Welch’s t-test, n = 4 CTL mice and 4 cKO mice. Panels C, G-H: unpaired two-tailed t-test, n = 4 CTL mice and 4 cKO mice. Data are presented as mean +/- SEM. ns = not significant. Additional statistical details in Table S1.

