Abstract
The cerebellar anterior lobe may play a critical role in the execution and proper timing of learned responses. The current study was designed to monitor Purkinje cell activity in the rabbit cerebellar anterior lobe after eyeblink conditioning, and to assess whether Purkinje cells in recording locations may project to the interpositus nucleus. Rabbits were trained in an interstimulus interval discrimination procedure in which one tone signaled a 250-msec conditioned stimulus-unconditioned stimulus (CS-US) interval and a second tone signaled a 750-msec CS-US interval. All rabbits showed conditioned responses to each CS with mean onset and peak latencies that coincided with the CS-US interval. Many anterior lobe Purkinje cells showed significant learning-related activity after eyeblink conditioning to one or both of the CSs. More Purkinje cells responded with inhibition than with excitation to CS presentation. In addition, when the firing patterns of all conditioning-related Purkinje cells were pooled, it appeared that the population showed a pattern of excitation followed by inhibition during the CS-US interval. Using cholera toxin-conjugated horseradish peroxidase, Purkinje cells in recording areas were found to project to the interpositus nucleus. These data support previous studies that have suggested a role for the anterior cerebellar cortex in eyeblink conditioning as well as models of cerebellar-mediated CR timing that postulate that Purkinje cell activity inhibits conditioned response (CR) generation during the early portion of a trial by inhibiting the deep cerebellar nuclei and permits CR generation during the later portion of a trial through disinhibition of the cerebellar nuclei.
Eyeblink classical conditioning has been used with great success to study the involvement of the cerebellum in motor learning. In eyeblink conditioning, a conditioned stimulus (CS), usually a tone, precedes an unconditioned stimulus (US), usually a corneal air puff, by 250-750 msec. Initially, the air puff US elicits a reliable response, in the form of a reflexive eye blink that is called an unconditioned response (UR). Over the course of a few hundred paired CS-US trials, an eye blink to the CS develops, which has a longer latency than the UR and differs in topography. This learned response is called the conditioned response (CR). One of the deep cerebellar nuclei, the interpositus nucleus, appears to be critical for learning CRs during eyeblink conditioning (e.g., Lavond et al. 1985; Yeo et al. 1985a; Steinmetz et al. 1992). In addition, lesions of some regions of cerebellar cortex (i.e., Larsell's lobule HVI) have been reported to affect CR production (e.g., Yeo et al. 1985b; Lavond and Steinmetz 1989) and recordings of Purkinje cell activity in this area have revealed inhibitory and excitatory patterns of activity that appear to be related to CS or US presentation and CR execution (e.g., Berthier and Moore 1986; Katz and Steinmetz 1997).
Mauk and colleagues have presented data suggesting that another region of the cerebellar cortex, the cerebellar anterior lobe (lobules I-V), may be involved in CR production and timing (Perrett et al. 1993; Perrett and Mauk 1995; Medina et al. 2000). Specifically, they found that large aspiration lesions of cerebellar cortex that included the anterior lobe or smaller electrolytic lesions confined to the anterior lobe shortened the onset and peak latency of CRs on trials with relatively long CS-US intervals without abolishing the CR itself. They proposed that training at a particular CS-US interval increases the strength of parallel fiber-Purkinje cell synapses active immediately after CS onset and decreases the strength of synapses active near the expected time of climbing fiber input produced by the US (Medina et al. 2000). Since Purkinje cells tonically inhibit the cerebellar deep nuclei, these changes in Purkinje cell activity would inhibit and then disinhibit the interpositus nucleus following CS presentation, allowing a CR timed to a specific CS-US interval to be generated.
To date, there have been no recording studies of Purkinje cell activity in the cerebellar anterior lobe during eyeblink conditioning. In the present study we trained rabbits on an interstimulus interval (ISI) discrimination procedure until two differently timed CRs were established. Recordings were then made over a number of days from the cerebellar anterior lobe and unit responses to the two ISIs were assessed. We hypothesized that if Purkinje cells related to the production and timing of eyeblink CRs were located in the anterior lobe, we would observe neuronal firing patterns that encoded one or both of two interstimulus intervals (ISIs) that were used during an ISI discrimination procedure. We also hypothesized that if the within-trial firing pattern influenced the timing and perhaps topography of the CR, both excitatory and inhibitory firing patterns would be seen during the CS-US intervals—excitatory responses were predicted to be found early in the CS-US interval with inhibitory responses found later in the CS-US interval. A preliminary version of these data was presented in Green and Steinmetz (2002).
Results
Histology
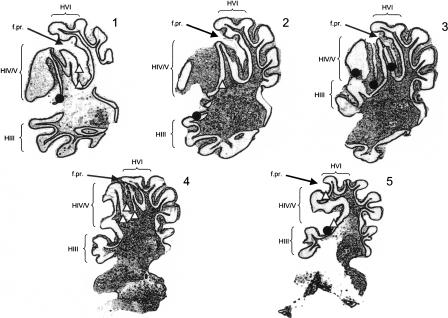
Electrode tracks and marking lesions were used to confirm the recording locations of Purkinje cells (Fig. 1). Only Purkinje cells recorded from the lateral extension of the anterior lobe of cerebellar cortex (lobules III-V; see Larsell 1970) were analyzed and reported. Excitatory and inhibitory units did not appear to be segregated to specific locations in the anterior lobe. Rather, inhibitory and excitatory units could often be found after very slight movements of the electrode during recording sessions.
Figure 1.
The location of marking lesions for cerebellar anterior lobe recording sites (parasagittal sections; rostral is left). Depicted locations are 10-15 mm below the surface of the skull, 3 mm rostral to lamba and 5 mm lateral of the midline (lambda was 1.5 mm below bremga). Black circles represent sites that were associated with excitatory activity during conditioning trials and white triangles represent sites that were associated with inhibitory activity during conditioning trials. Successive sagittal sections progress laterally (1) to medially (5) through the paravermis. The gray arrows point to the approximate location of the primary fissure separating anterior lobe from posterior lobe. Adapted from the atlas of Shek et al. (1986).
Behavioral data
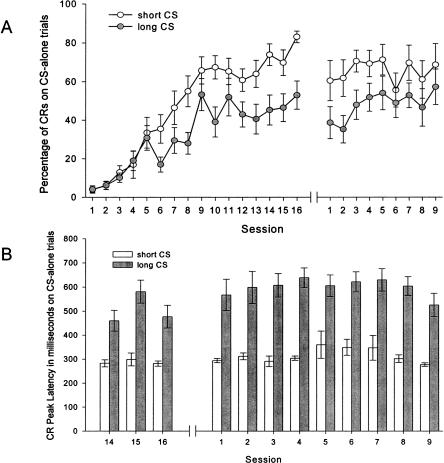
Figure 2 shows behavioral data. In general, rabbits learned CRs to both CSs with peak and onset latencies timed appropriately for the two ISIs. Confining analyses to 24 CS-alone trials for each ISI per session (because CRs performed on these CS-alone trials were not contaminated by the presence of URs), learning was superior on the 250-msec ISI trials compared to the 750-msec ISI trials. By Session 16 (the final session before surgical preparation for recording), all rabbits showed a high level of conditioned responding on 250-msec ISI trials, regardless of whether it was signaled by the 1000-Hz or the 8000-Hz tone (range = 61.1%-100% CRs). By contrast, learning was more variable on 750-msec ISI trials (range = 4.2%-95.8% CRs). In particular, three of 14 rabbits showed less than 30% CRs on CS-alone trials in Session 16, despite executing a high percentage of CRs on 250-msec ISI trials. When CRs were executed, however, they were timed appropriately for each ISI when onset latency and peak latency were considered.
Figure 2.
(A) Percentage of CRs on CS-alone trials as a function of training session, for 250-msec ISI trials and 750-msec ISI trials. Each data point represents percentage of CRs calculated from 24 CS-alone trials. The initial 16 sessions were conducted prior to surgery and the final nine sessions were conducted after surgery and a 1-wk recovery. Purkinje cell activity was recorded during the final eight sessions. (B) Peak latency of CRs on CS-alone trials as a function of training sessions, for 250-msec ISI trials and 750-msec ISI trials. Depicted are the final three sessions prior to surgery and the nine sessions after surgery and a 1-wk recovery. Latencies were calculated only from trials with a CR.
The percentages of CRs executed across the 25 sessions of conditioning (16 pre-surgery, 9 post-surgery) were analyzed with a 2 (ISI: 250-msec, 750-msec) × 2 (Tone: 1000 Hz tone for short ISI, 8000 Hz tone for short ISI) × 25 (Session) repeated-measures analysis of variance (ANOVA). This analysis revealed a significant interaction effect between ISI and Session, F(24,288) = 2.80, P < 0.001. Further analysis of this significant interaction effect revealed that the percentage of CRs increased more rapidly on the 250-msec ISI trials beginning in Session 6 and attained a higher asymptote compared to the percentage of CRs on the 750-msec ISI trials. There was, however, significant learning evident on 750-msec ISI trials.
Peak latencies of CRs across the final 12 sessions of conditioning (three pre-surgery, nine post-surgery) were analyzed with a 2 (ISI) × 2 (Tone) × 12 (Session) repeated-measures ANOVA. As expected, this analysis revealed significant main effects of ISI, F(1,12) = 89.10, P < 0.001, and Session, F(11,132) = 3.85, P < 0.001. None of the interaction effects was significant. The peak latencies of the CRs fluctuated across the final 12 sessions of conditioning but were always significantly greater on 750-msec ISI trials compared to 250-msec ISI trials. These data are shown in Figure 2B. The CR onset latencies showed the same pattern as the peak latencies, with ISI, F(1,12) = 48.88, P < 0.001 and Session, F(11,132) = 2.50, P = 0.007 being the only significant effects.
For seven of 14 rabbits, the development of a timing discrimination was marked by an intermediate phase where double-peaked CRs were emitted on long (but not short) ISI trials, as measured on CS-alone trials. Occurrences of double-peaked CRs were relatively rare on 250-msec CS-alone trials; the responses were seen in only two rabbits. These two rabbits emitted at least five (out of 24) double-peaked CRs in at least one session on 250-msec CS-alone trials. The larger peak always occurred about 250-msec after CS onset. Double-peaked CRs were much more common on 750-msec CS-alone trials, and seven rabbits emitted at least five or more double-peaked CRs in at least one session on 750-msec CS-alone trials. In this case, the larger peak tended to occur somewhere between 250-msec and 500-msec after CS onset, indicating a timing discrimination in an intermediate stage of development.
Cerebellar anterior lobe activity
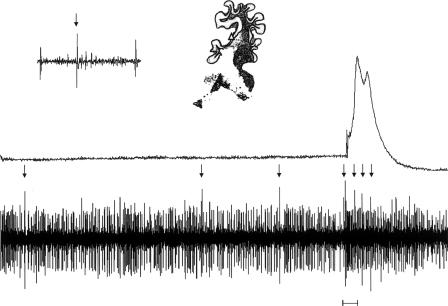
A total of 72 Purkinje cells were held through multiple trials of all four trial type presentations (i.e., paired and CS-alone trials for both ISI conditions) and also were found to be located in the lateral cerebellar anterior lobe. These were the only cells analyzed further. Complex spikes could be clearly identified in 45 of the Purkinje cells. The remaining 27 cells were classified as Purkinje cells based on (1) a baseline firing rate of at least 10 spikes/sec, (2) their location in the Purkinje cell layer of the cerebellar cortex, (3) demonstration of irregular firing patterns, and (4) their being clearly identifiable units (i.e., spike amplitudes being greater than two times the background activity level). It is not surprising that complex spikes were not seen for all neurons that were isolated. Previous studies have shown that after eyeblink conditioning, inferior olivary activity is significantly decreased, most likely by inhibitory input from the interpositus nucleus as CR-related activity forms there (Sears and Steinmetz 1991). The net effect of this decrease in inferior olivary activity is a decrease in complex spiking in cerebellar cortex during CR trials (Berthier and Moore 1986). Given the high rate of CRs that were observed in the well-trained rabbits during recording sessions, we expected to see few climbing fiber discharges. It is also possible that some of these 27 cells may have been Golgi cells, although it is unlikely that more than a few were, as Golgi cells tend to exhibit spontaneous firing rates below 10 spikes/sec and very regular firing patterns (Edgley and Lidierth 1987). Across all 72 Purkinje cells, mean baseline simple spike firing rate calculated from a recording period before CS onset was 26.3 spikes/sec (range = 10.0 to 109.6 spikes/sec). This broad range of tonic activity of simple spikes in Purkinje cells recorded in vivo agrees with many previous studies (Thach 1968; Armstrong and Rawson 1979; Armstrong and Edgley 1984; Edgley and Lidierth 1987). Purkinje cells in the areas we recorded from appeared responsive to the corneal air puff, as bursts of complex spikes could be observed during US-alone trials (Fig. 3).
Figure 3.
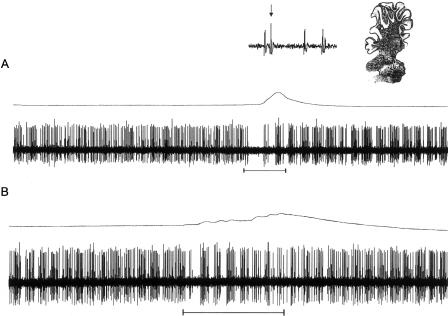
An example of a burst of complex spikes elicited by the corneal air puff on a US-alone trial. The upper trace is eyelid activity and the lower trace is Purkinje cell activity. Below the Purkinje cell activity is a horizontal bar depicting the onset and offset of the air puff US. The arrows point to complex spikes. The inset shows one of the complex spikes and the approximate location of the Purkinje cell.
Similar to previous studies (e.g., Katz and Steinmetz 1997), we classified units as responsive to the CS, as responsive during CRs, or both by determining when in the trial period changes in neuronal activity were seen and, where possible, if alterations in activity were seen on only those trials in which a CR was executed. In addition, they were classified as showing this type of activity on 250-msec ISI trials, 750-msec ISI trials, or both. Units were classified as CS-related if they showed significant increases or decreases in firing rate in the first 50-msec period after CS onset and if changes in unit responsiveness could be seen on at least CR trials. Units were classified as CR-related if they showed significant increases or decreases in firing rate on CR trials and if this increase or decrease in firing rate occurred either in the same 50-msec period as mean CR onset latency for that session, or sometime during the execution of the CR. Some units showed a pattern of activation that could be described as both CS- and CR-related and these units were classified as CS/CR-related. All units that were not classified as solely CS-related were then further analyzed to determine, on a trial-by-trial basis, the onset of a change in Purkinje cell activity (see Berthier and Moore 1990) and these data were averaged and compared to trial-by-trial CR onsets. Table 1 presents a summary of the number of units that exhibited each activity pattern. Similar percentages of Purkinje cells were responsive to either the short or the long ISI, but not both, around the time of CRs while a smaller percentage showed activation to both ISIs.
Table 1.
Numbers of Purkinje cells showing stimulus- and/or response-related activation on short and/or long ISI trials
| Type of activity | CS-related activity | CR-related activity | CS and CR-related activity |
|---|---|---|---|
| 250-msec ISI trials only | 9 of 72 (12.5%) | 10 of 72 (13.9%) | 7 of 72 (9.7%) |
| 750-msec ISI trials only | 5 of 72 (6.9%) | 10 of 72 (13.9%) | 6 of 72 (8.3%) |
| Both ISI trials | 0 of 72 (0.0%) | 8 of 72 (11.1%) | 1 of 72 (1.4%) |
| Total | 14 of 72 (19.4%) | 28 of 72 (38.9%) | 14 of 72 (19.4%) |
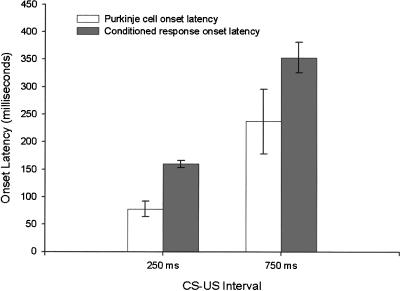
A change in the firing rate in Purkinje cells that were responsive around the time of CRs tended, on average, to lead the onset of CRs. In addition, the lead time was similar on both short and long ISI trials, so that changes in firing rate of Purkinje cells on long ISI trials were, on average, about 250 msec after CS onset while changes in firing rate of Purkinje cells on short ISI trials were, on average, about 75 msec after CS onset (Fig. 4).
Figure 4.
Onset latency (change in firing rate) of Purkinje cells and onset latency of CRs as a function of CS-US interval.
A total of 42 of 72 Purkinje cells were classified as responsive during CRs based on a significant standard score in the 50-msec period immediately preceding and/or during CRs. This proportion of neurons is very similar to that reported by Berthier and Moore (1986), who classified 48 of 77 Purkinje cells as CR-related based on similar criteria, including 37 of 54 Purkinje cells located in lobule HVI. However, the total percentage of Purkinje cells classified as CR-related is greater than in other studies (Gould and Steinmetz 1996; Katz and Steinmetz 1997). This may be a function of either greater engagement of the anterior lobe compared to HVI during eyeblink conditioning or an increase in the number of CR-related neurons observed on 750-msec ISI trials, which affords a relatively longer sampling period for significant activation to be observed. Nevertheless, many of these Purkinje cells clearly appeared to be CR-related as evidenced by the presence of significant standard scores, by inspection of the raw unit activity observed during trials, and by the clear learning-related patterns of activity that were apparent in the peristimulus histograms of activity across sessions (see below).
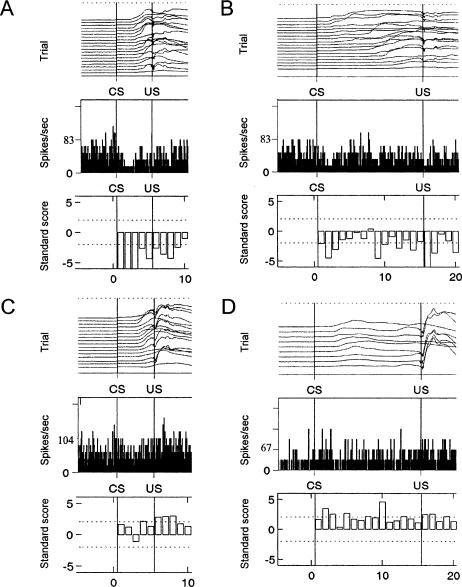
Table 2 presents a summary of excitatory versus inhibitory modulations in the firing rate of Purkinje cells. The results of this analysis were somewhat surprising given the results of past recording studies involving lobule HVI of cerebellar cortex. As can be seen in Table 2, more CR-related Purkinje cells responded during CRs with inhibition rather than excitation, with a ratio of 1:2 excitatory:inhibitory. This is almost exactly the opposite of the ratio that has been reported for lobule HVI in many studies (Berthier and Moore 1986; Gould and Steinmetz 1996; Katz and Steinmetz 1997). Figure 5 shows examples of overall activation patterns recorded across trials of Purkinje cells exhibiting inhibitory or excitatory activity during CR performance on short or long ISI trials.
Table 2.
Numbers of Purkinje cells showing stimulus- and/or response-related excitatory and/or inhibitory activation
| Type of activity | CS-related activity | CR-related activity | CS and CR-related activity |
|---|---|---|---|
| Excitatory activity only | 3 of 72 (4.2%) | 6 of 72 (8.3%) | 3 of 72 (4.2%) |
| Inhibitory activity only | 11 of 72 (15.3%) | 13 of 72 (18.1%) | 5 of 72 (6.9%) |
| Both types of activity | 0 of 72 (0.0%) | 9 of 72 (12.5%) | 6 of 72 (8.3%) |
| Total | 14 of 72 (19.4%) | 28 of 72 (38.9%) | 14 of 72 (19.4%) |
Figure 5.
Eyelid movement on CR trials, and corresponding peristimulus time histogram and standard scores for (A) a Purkinje cell that showed inhibition on 250-msec ISI trials; (B) the same Purkinje cell showed inhibition on 750-msec ISI trials; (C) a Purkinje cell that showed excitation on 250-msec ISI trials; and (D) a Purkinje cell that showed excitation on 750-msec ISI trials. Peristimulus time histograms represent the number of spikes per bin (bin size = 3 msec) in the 250-msec prior to CS onset, the CS-US period, and the 250-msec after US onset. Standard scores represent the change in activity relative to the pre-CS baseline for separate 50-msec subperiods of the CS-US period and the post-US period. Dotted lines represent the threshold for a significant increase or decrease in activity.
Some Purkinje cells showed clear changes in activity on both trial types when CRs were executed, while others showed activation on just one ISI trial type or the other. An example of a Purkinje cell that showed prominent inhibition on both trial types is shown in Figure 5A,B and activity of this Purkinje cell on a single trial of each trial type is shown in Figure 6A,B. Purkinje cell inhibition tended to be brief with relatively abrupt onset and offset when CRs also exhibited this pattern, as was typical on the short CS-US interval trials in well-trained rabbits (Fig. 6A). In contrast, inhibition was longer and had less well defined onsets and offsets when CRs were long and broad, as when CRs were executed during the long CS-US intervals in well-trained rabbits (Fig. 6B).
Figure 6.
In each subplot, the upper trace is eyelid activity, and the lower trace is unit activity. Below the unit activity is a horizontal bar depicting the onset and offset of the tone CS. (A) An example of Purkinje cell inhibition during a CR on a 250-msec CS-alone trial; and (B) An example of inhibition in the same cell during a CR on a 750-msec trial. The activity of this Purkinje cell across 250-msec and 750-msec trials is depicted in Figure 5A,B, respectively. The inset shows a complex spike, which was used to identify this cell as a Purkinje cell, and the approximate location of the Purkinje cell.
It is clear on looking at the individual neuronal responses that a variety of patterns of excitation and inhibition can be seen. An important question, however, is how this population of individual neurons in the anterior lobe might collectively affect the deep cerebellar nuclei to which they project. One way to view this population effect is to simply average all of the standard scores of the units that were recorded. This population average response is shown in Figure 7.
Figure 7.
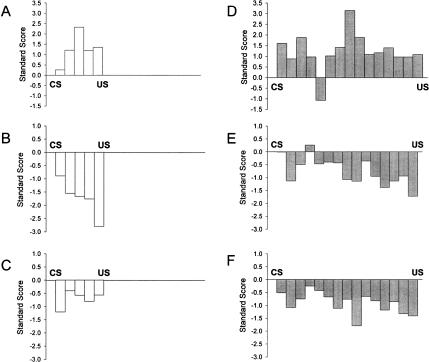
Mean standard scores across all Purkinje cells that showed an exclusively excitatory or inhibitory response during CRs. (A) Excitatory Purkinje cells on 250-msec ISI trials; (B) Inhibitory Purkinje cells on 250-msec ISI trials; (C) Weighted average of all cells from A and B; (D) Excitatory Purkinje cells on 750-msec ISI trials; (E) Inhibitory Purkinje cells on 750-msec ISI trials; (F) Weighted average of all cells from D and F.
These analyses revealed an interesting pattern of Purkinje cell activation that was rarely observed when the activities of individual Purkinje cells were considered in isolation. As a whole, the excitatory CR-related Purkinje cells tended to show the strongest excitation in approximately the early to middle of the CS-US interval while the group of inhibitory Purkinje cells tended to show the strongest inhibition at nearer the end of the CS-US interval (Fig. 7A,D). Thus, the highest level of excitation of CR-related Purkinje cells to the short ISI occurred in the period 100-150 msec after CS onset while the highest level excitation of CR-related Purkinje cells to the long ISI occurred in the period 350-400 msec after CS onset. In contrast, the highest level of inhibition of CR-related Purkinje cells to the short ISI occurred in the period 200-250 msec after CS onset (i.e., immediately before US onset) and the highest level of inhibition of CR-related Purkinje cells to the long ISI occurred in the period 700-750 msec after CS onset (i.e., also immediately before US onset) (Fig. 7B,E). Occasionally, a Purkinje cell was located that appeared to exhibit both of these processes simultaneously, but very few of these types of cells were found. These results suggest an overall pattern of Purkinje cell activity that is consistent with the hypothesis that Purkinje cells inhibit the interpositus nucleus early in the CS-US interval by increasing activity and disinhibit the interpositus nucleus later in the CS-US interval by decreasing activity. It should be noted again that more inhibitory cells were found than excitatory cells. Figure 7C,F shows an overall average of all inhibitory and excitatory cells that were recorded. This averaged activity reveals an overall inhibitory firing pattern of Purkinje cells during training. However, the relative weight of excitation and inhibition on deep cerebellar nuclear cell firing is unknown and some care should be taken in interpreting the gross averages of activity shown in Figure 7.
Overall, it appears that the population of Purkinje cells we recorded from showed a firing pattern that is consistent with their involvement in CR execution and timing. Early in the CS-US interval, the population of Purkinje cells tended to show excitatory responses that would inhibit interpositus nucleus activity and thus inhibit CR expression. Later in the CS-US interval, the population of Purkinje cells tended to show inhibitory responses that would disinhibit interpositus nucleus activity and thus facilitate CR expression. Importantly, the timing of the excitation and inhibition appears to be sensitive to ISI manipulation.
Stimulation
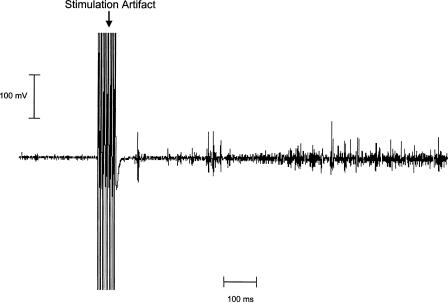
One very important issue that can be raised in a recording study, such as the present study, is whether or not the Purkinje cells being monitored are actually related in some fashion to the production of the conditioned eyeblink. One method that has been used to establish a relationship between populations of Purkinje cells under study and the production of an eyeblink response involves the use of electrical stimulation. For example, Hesslow (1994) reported that stimulation of the cortical surface of lobule HVI can elicit delayed eyelid EMG activity in the decerebrate cat. We attempted to use cerebellar stimulation to establish a functional link between the Purkinje cell recording sites we used and the generation of eyeblinks. In no case were we able to elicit overt eyeblinks or eyeblink EMG activity when we stimulated through our recording electrodes. There are many potential explanations for our failure to produce the stimulation-evoked eyeblinks. First, the impedances of our electrodes were relatively high, hence current spread was likely minimal. Second, we used a maximum of 800 μA at each site, which is considerably lower than some previous studies. We reasoned that higher currents were likely to spread to adjacent populations of Purkinje cells making it difficult to verify that the neurons nearest the electrode tip (and hence most likely recorded from) were the same neurons responsible that when activated were responsible for eyeblinks. Third, because Purkinje cells inhibit deep nuclear neurons, it is likely that relatively indirect means of recruiting deep nuclear neurons are needed to generate sufficient excitatory activity to drive an eyeblink response at the periphery (such as a rebound from inhibition; Hesslow 1994; Katz et al. 2001). This might require that a relatively large population of Purkinje cells would need to be recruited to produce this effect and that our stimulation parameters simply did not recruit enough neurons. Fourth, the cats used in the Hesslow (1994) study were decerebrated while the rabbits in our present study were not. It is possible that brainstem excitability was altered in the decerebrate cats in a manner that facilitated the appearance of stimulation-evoked eyeblinks. While we were not successful in the present experiment evoking eyeblink responses with cerebellar cortical stimulation delivered through our recording electrodes, we managed to do so in other rabbits when we used electrodes with larger exposed tips. Figure 8 shows an example of evoked-EMG activity from one of these rabbits. In these studies, we have occasionally seen overt eyeblinks with either lobule HVI or anterior lobe stimulation. More often we have been able to see weak EMG activity recorded from the muscles involved in eye-blinking. To produce these responses, however, relatively high currents have been used (1.0-1.5 mA) along with relatively low impedance (e.g., 200-500 kOhm) electrodes.
Figure 8.
An example of eyelid EMG activity elicited by stimulation of the cerebellar anterior lobe. The 200-Hz stimulation was delivered at 400 μA for 50 msec. The time from stimulation offset to the first spike of eyelid EMG activity was 65 msec.
Injections of CT-HRP in the anterior lobe
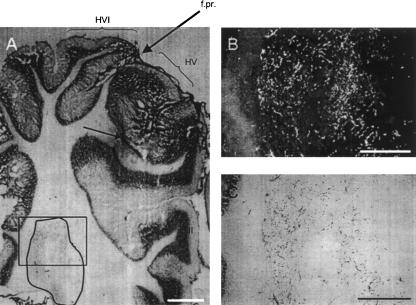
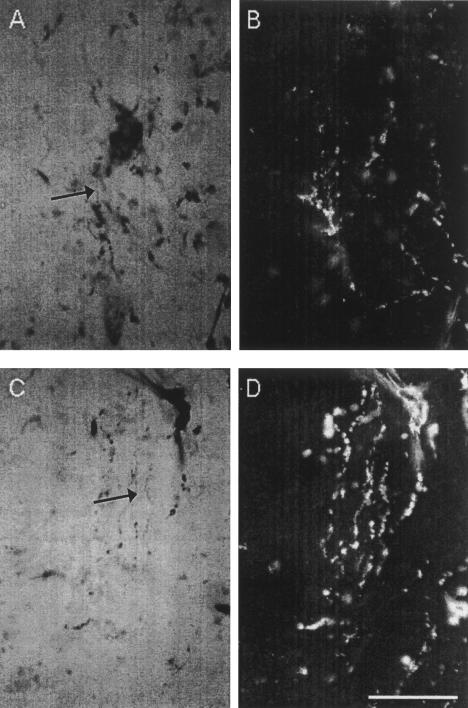
Previous studies have established connectivity between regions of lobule HVI and the lateral anterior interpositus nucleus (e.g., Steinmetz and Sengelaub 1992), which is known to be critically involved in CR production during eyeblink conditioning. Our recording data suggest that the regions of anterior lobe from which we recorded may also project directly to the same region of the anterior interpositus nucleus. To test this more directly, we injected CT-HRP at three recording sites where learning-related activity was observed and looked for anterograde transport to the interpositus nucleus. Figure 9 shows an example of a CT-HRP injection in the Purkinje cell layer of the anterior lobe. Figure 10 shows anterograde labeling in the lateral interpositus nucleus. As can be seen, diffusely distributed granules of reaction product are evident in the interpositus, indicative of terminal labeling by anterograde transport of HRP down the Purkinje cell axon.
Figure 9.
(A) Photomicrograph of a cortical CT-HRP injection site (small arrow; rostral is right), with the interpositus nucleus outlined in white. The large arrow points to the location of the primary fissure separating anterior lobe (right of arrow) from posterior lobe (left of arrow). Calibration bar, 1000 μm; (B) Dark field and (C) bright field photomicrograph from the boxed region in (A). Calibration bar, 500 μm.
Figure 10.
(A) High power bright field photomicrograph of terminal labeling (arrow) in the interpositus nucleus; (B) High power dark field photomicrograph of terminal labeling shown in (A); (C) High power bright field photomicrograph of another region of terminal labeling (arrow) in the interpositus nucleus; (D) High power dark field photomicrograph of terminal labeling shown in (C). Calibration bar, 50 μm.
Discussion
Using an ISI discrimination procedure, rabbits were trained to differentially respond to two tones that signaled two different CS-US intervals. The development of a timing discrimination was evident when the onset and peak latencies of eyeblink CRs were analyzed for the two ISIs used. Specifically, CR onset and peak latencies were significantly shorter on short (250-msec) CS-US ISI trials compared to long (750-msec) ISI trials. Importantly, the ISI discrimination effect was apparent on CS-alone trials, which afforded 1500 msec sampling periods for short and long ISI trials that were not contaminated by the presence of the UR. These behavioral results replicate previous findings using similar ISI discrimination conditioning procedures (Mauk and Ruiz, 1992; Kehoe et al. 1993; Allen and Steinmetz 1994).
A major goal of the present experiment was to examine the patterns of Purkinje cell activity in the cerebellar anterior lobe during the execution of differentially-timed CRs. Individual anterior lobe Purkinje cells showed a variety of patterns of activation related to eyeblink conditioning, including activation related to CRs on both short and long trials, activation related to CRs on either short or long trials, and activation to the CS. In general form, this variety of activation patterns is similar to Purkinje cell activation in lobule HVI recorded during eyeblink conditioning (McCormick and Thompson 1984; Berthier and Moore 1986; Allen and Steinmetz 1994; Hesslow and Ivarsson 1994; Gould and Steinmetz 1996; Katz and Steinmetz 1997; King et al. 2001). In addition, the lobule HVI recording studies have reported both excitatory and inhibitory patterns of Purkinje cell discharges during the CS-US interval. In a number of studies of conditioning related activity in lobule HVI, as many as two-thirds of the Purkinje cells recorded showed excitatory activation during eyeblink conditioning (e.g., Berthier and Moore 1986; Gould and Steinmetz 1996; Katz and Steinmetz 1997; but see King et al. 2001). In contrast, in the present study at least 40% of the Purkinje cells we recorded from in the lateral anterior lobe showed exclusively inhibition after eyeblink conditioning. For many of these cells, this inhibition preceded CR initiation and could sometimes last for several hundred milliseconds.
In addition to inhibition being more prevalent than excitation in the anterior lobe, when all of the units were considered as a population, we also observed an overall pattern of Purkinje cell excitation followed by inhibition during the CS-US interval (see Fig. 7). This pattern has been reported occasionally for individual lobule HVI Purkinje cells (e.g., Hesslow and Ivarsson 1994; Katz and Steinmetz 1997; King et al. 2001), and a few individual Purkinje cells showed this pattern in the present study. The observation of an overall pattern of excitation followed by inhibition in the population of anterior lobe Purkinje cells from which we recorded supports the results of Mauk and colleagues, who have observed short latency CRs after either anterior lobe lesions (Perrett et al. 1993; Perrett and Mauk 1995; Garcia et al. 1999; Medina et al. 2000) or pharmacological disconnection of the cerebellar cortex from the interpositus nucleus (Garcia and Mauk 1998; Medina et al. 2001; Ohyama and Mauk 2001). These short latency responses are believed to be due to the loss of Purkinje cell excitation early in the CS-US interval, which suppresses interpositus activity until nearer to US onset, when Purkinje cell inhibition reverses the suppression to facilitate interpositus activity (Medina et al. 2000). Finally, we also observed Purkinje cells that were activated by both CS-US intervals, which we also observed in lobule HVI in a previous study (Allen and Steinmetz 1994). This further supports the notion that timing of CRs is mediated by (or at least reflected by) Purkinje cell activity, and suggests that some individual Purkinje cells are capable of shaping the timing of CRs regardless of when during the CS-US interval they are initiated.
Given that the mossy fiber-granule cell-parallel fiber pathway conveys both auditory (Aitkin and Boyd 1975) and tactile (Armstrong and Edgley 1984) information to the cortex, which is represented in Purkinje cells by simple spiking, it might be suggested that the changes in simple spiking after eyeblink conditioning that we observed were more stimulus-than response-related (i.e., CS- and US-related, but not CR-related). However, the fact that, at least in some Purkinje cells, changes in simple spiking appeared to be related to the CS-US interval suggests that the activity we observed was more than just stimulus-related and may have represented a temporal code. This would support the hypothesis of Mauk and colleagues that the anterior lobe is involved in shaping CR timing through selective strengthening and weakening of parallel fiber-to-Purkinje cell synapses active early and late in the CS-US interval, respectively (Medina et al. 2000). Patterns of activation of Purkinje cells that are not obviously stimulus or response-related have been observed previously during eyeblink conditioning. For example, Gould and Steinmetz (1996) observed changes in Purkinje cell activity over the course of US-CS pairings (i.e., backward training), a procedure that does not produce CRs in eyeblink conditioning. Similar changes do not occur in the interpositus nucleus (Gould and Steinmetz 1996), suggesting that Purkinje cells might encode complex aspects of training not readily represented as simple associations between stimuli and responses.
The results of our CT-HRP injections into the area of the anterior lobe, where our recordings were made, provide clear evidence that this region of the cerebellar cortex projects directly to the anterior interpositus nucleus. Importantly, the specific region in the anterior interpositus nucleus that contained labeled axon terminals after the anterior lobe CT-HRP injection corresponds well with the critical area that when lesioned produces deficits in CR acquisition and performance (e.g., McCormick and Thompson 1984) as well as the area where learning-related activity has been recorded in past studies (e.g., Berthier and Moore 1990). Also, this is the same region of the interpositus nucleus that receives projections from lobule HVI Purkinje cells thought to be involved in eyeblink conditioning (Yeo et al. 1985b; Steinmetz and Sengelaub 1992). Studies of the cat cerebellum have indicated that the cerebellar cortex exhibits a parasagittal projection pattern to the deep cerebellar nuclei, whereby seven anatomically-defined narrow strips (approximately 1 mm wide) project to sagittally-oriented strips of the deep cerebellar nuclei (Bishop et al. 1979; Dietrichs 1981; Trott and Armstrong 1987). Based on an analysis of our recording sites, it is likely that we recorded Purkinje cells from one of the C zones, which are situated laterally, and most likely from the C3 zone, based on the fact that this zone projects to the lateral anterior interpositus nucleus (Dietrichs 1981; Trott and Armstrong 1987) where we observed terminal labeling after CT-HRP injection.
Taken together with previous studies, our results suggest that both lobule HVI and the anterior lobe may receive convergent CS-US input via mossy fibers and climbing fibers, respectively. Further, our anatomical results suggest that both cortical areas project to a common region of the anterior interpositus nucleus, which also appears to receive convergent CS-US input. Future anatomical tracing studies using double-labeling techniques might prove useful for determining whether single interpositus nucleus cells received convergent input from the two cortical areas.
The current results demonstrate excitation and inhibition of Purkinje cell simple spiking in the anterior lobe after eyeblink conditioning, but they are neutral regarding the source of this excitation and inhibition. The model of Mauk and colleagues provides one explanation of our results, in terms of excitation of Purkinje cells early in the CS-US interval, produced by LTP at the parallel fiber-to-Purkinje cell synapse, followed by inhibition of Purkinje cells late in the CS-US interval, produced by LTD at the parallel fiber-to-Purkinje cell synapse. Excitation of Purkinje cells would inhibit the interpositus nucleus, preventing generation of a CR while inhibition of Purkinje cells would disinhibit the interpositus, allowing generation of a CR. The model does not specify which areas of cerebellar cortex might exhibit LTP and LTD. The implication of lesion studies is that the anterior lobe must at least exhibit LTP, since lesions produce CRs with very short latencies thought to be due to removal of Purkinje cell inhibition of the interpositus nucleus. Our results suggest that, in terms of the model, both LTD and LTP of parallel fiber-to-Purkinje cell synapses would be present in the anterior lobe. Together, the data suggest that this pattern of activity, along with excitation and inhibition of Purkinje cells in lobule HVI, would converge on and shape training-produced increases in activity in the interpositus nucleus, leading to the well-defined topography of the CR.
Materials and Methods
Subjects
Fourteen male, New Zealand albino rabbits (Myrtle's Rabbitry), weighing at least 2.5 kg at the start of training, served as subjects. They were housed individually with ad lib access to food and water and were maintained on a 12 light/12 dark schedule. All testing took place during the light phase of the schedule.
Pre-surgery training
Naive rabbits were adapted to the conditioning chamber in a Plexiglas restraint box. Adaptation was 45 min on Day 1 and 60 min on Day 2. During adaptation, no stimuli were presented. Twenty-four hr following Day 2 of adaptation, training began. An interstimulus interval (ISI) discrimination procedure was used. For one-half of the rabbits, CS1 was a 1000-Hz, 350-msec tone and CS2 was an 8000-Hz, 850-msec tone. For the other one-half of the rabbits, CS1 was a 1000-Hz, 850-msec tone and CS2 was an 8000 Hz, 350-msec tone. All tones were presented at 85 dB sound pressure level. The US was a co-terminating 100 msec, 3 psi (at the source) corneal air puff. Each training session consisted of 120 trials, pseudo-randomly intermixed with the following trial distribution for 11 of the rabbits: 36 CS1-US trials, 24 CS1-alone trials, 36 CS2-US trials, and 24 CS2-alone trials. The following trial distribution was used for the remaining three rabbits: 36 CS1-US trials, 18 CS1-alone trials, 36 CS2-US trials, 18 CS2-alone trials, and 12 US-alone trials.
Rabbits underwent 16 sessions of acquisition training prior to surgery. Eyeblinks were measured with a photodetector (Thompson et al. 1994) directed at the left eye of the rabbit (11 rabbits) or via stainless steel electrodes placed in the orbicularis oculi muscle of the left eye (three rabbits). For these three rabbits, electromyographic (EMG) activity was amplified 1000×, filtered at 100-1000 Hz, full-wave rectified, and integrated. Stimulus delivery and measurement of eyelid activity was controlled by an IBM PC-compatible computer system running custom software (Chen and Steinmetz 1998).
Surgery
One or two days after the last session of pre-surgery training, rabbits underwent surgery. Surgeries were performed under aseptic conditions. Rabbits were anesthetized with xylazine (6 mg/kg, s.c.) followed by ketamine (60 mg/kg, i.m.). Anesthesia was maintained for the duration of the surgery with 1.0-mL injections (i.m.) of a 2:1 ketamine:xylazine cocktail administered every 45 min. After being anesthetized, the rabbits were secured in a stereotaxic head holder. The scalp was incised and reflected to expose the skull. The head was positioned with lambda 1.5 mm lower than bregma. Three stainless steel screws were attached to the skull to serve as reference ground and to help secure the head stage. A 6-mm diameter hole was drilled in the skull, centered at 3.0 mm rostral and 5.0 mm lateral to lambda, and a cylindrical base was cemented over the hole, filled with petroleum jelly, and capped. Two head bolts were cemented toward the front of the skull for securing the rabbit's head and the air puff/eyelid measurement assembly during recording sessions. The scalp was then sutured and Povidone ointment was applied around the wound. Antibiotics (tetracycline) were given for three days following surgery. Rabbits were allowed at least one week of recovery before training resumed.
Recording
Nine sessions of post-surgery training were conducted. The procedures were identical to pre-surgery training, except that a microelectrode was lowered into the anterior cerebellar cortex during Sessions 2-9 of post-surgery training. Microelectrodes were constructed from stainless steel rods that were etched to a fine tip with acid and insulated with Epoxylite. Tip impedence was brought to 1.5-4.0 MΩ (at 1 kHz) by passing a small amount of current between the electrode tip and a metal counter electrode (Ciancone and Rebec 1989). The electrode was mounted in a hydraulic microdrive prior to each session.
In each session, the rabbit was placed in the Plexiglas restrainer and its head was immobilized in a stereotaxic frame using the bolts embedded in the acrylic headstage during surgery. Beginning in session 2 of post-surgery training, the cap was removed from the cylindrical base, the petroleum jelly was removed, and a microelectrode was lowered into the cerebellar cortex using the hydraulic microdrive. Beginning at approximately 10 mm below the surface of the skull, unit activity was examined for the presence of Purkinje cells. When a single cell or several cells were isolated, the session began. After 40 trials, the electrode was moved until different cells were isolated. In this way, cerebellar cells were recorded from three different dorsal-ventral depths in each session, yielding a total of 24 recording locations per rabbit over the course of training. The last few penetrations were marked with a small amount of dc current (100 μA for 10 sec) delivered through the recording electrode. Neural activity was amplified (10,000×), filtered (500-5000 Hz), and, along with eyelid activity, routed to a computer interfaced with a Micro 1401 data acquisition unit running Spike2 software (CED Ltd) for isolating and sorting action potentials.
Stimulation
Following the final recording session, all rabbits were tested for evoked eyelid responses to electrical stimulation of the anterior lobe of cerebellar cortex through the electrodes used for recording. For 11 rabbits, brief stimulation trains (200 Hz; 0.2-msec pulse width; 50-800 μA) were delivered to one to two recording locations and behavioral responses were determined by visual inspection for overt eyelid movements. For three rabbits, 50-msec stimulation trains (200, 300, and 400 Hz; 0.1 msec pulse width; 100, 200, 300, and 400 μA at each frequency) were delivered to a recording location where clear CR-related Purkinje cell activity was observed, and raw eyelid EMG activity was recorded.
Histology
Eleven of the fourteen rabbits were overdosed with an injection of sodium pentobarbital (4 cc, i.v.) following stimulation tests. They were transcardially perfused with 0.9% saline followed by 10% formalin. The brains were removed and stored in 10% formalin/30% sucrose for at least a week before sectioning. For sectioning, the cerebellum was embedded in albumin-gelatin, frozen, and sectioned sagittally at 80 μm on a sliding microtome. Sections were stained with cresyl violet to visual cell bodies and Prussian blue to visual the iron deposits left by the marking lesions, mounted on gelatin-subbed slides, and coverslipped with Permount.
The remaining three rabbits were anesthetized and mounted in the stereotaxic frame used during post-surgery training. The cap of the base and the petroleum jelly within were removed and a 1 μL Hamilton syringe filled with 0.4 μL of 0.2% cholera-toxin conjugated horseradish peroxidase (CT-HRP) was slowly lowered into the cerebellum to coordinates (11.5-13.5 mm dorsal-ventral) corresponding to where identified Purkinje cell activity in the anterior lobe was observed. Five minutes after positioning the syringe needle, CT-HRP was pressure-injected and the needle was left in place for an additional 5 min before being slowly withdrawn. Survival time was 48-72 hr, at which point rabbits were overdosed with sodium pentobarbital and transcardially perfused with 0.9% saline followed by cold 1% paraformaldehyde/1.25% glutaraldehyde in 0.1 M phosphate buffer (pH = 7.2-7.4). The brains were removed, post-fixed in cold fixative for 5 hr at 4°C, and stored overnight in cold 10% sucrose/phosphate buffer. The cerebellum was sectioned sagitally at 40 μm on a cryostat in three repeating series and sections were mounted on chrome-alum subbed slides. The following day, two series of sections were reacted with tetramethyl benzidine by the method of Mesulam (1978), counterstained with thionin, and coverslipped with Permount. The third series of sections was stained with cresyl violet and Prussian blue, and coverslipped with Permount.
Data analysis
Conditioned responses were defined as eyeblinks that exceeded 0.5-mm between CS onset and US onset (on paired trials) or within 1500-msec after CS onset (on CS-alone trials). Trials were discarded if eyeblinks exceeding 0.7-mm in the 250-msec prior to CS onset were found. The percentage of CRs that were observed was calculated from all included trials. Onset and peak latencies were calculated from CR trials only. Double-peaked CRs were defined as CRs with an initial peak of at least 1.0-mm, followed by a retraction of at least 1.0-mm, followed by a second peak of at least 1.0-mm (Kehoe et al. 1993).
Purkinje cells were identified using criteria that have been established in awake-behaving monkeys, cats, and rabbits. The criteria include the presence of complex spikes, a location of the electrode near the Purkinje cell layer, the presence of large action potentials, and an irregular pattern of discharge (Thach 1968; Lisberger and Fuchs 1978; Armstrong and Rawson 1979; Berthier and Moore 1986). Complex spikes were identified by the presence of two or more of the following: a multiphasic waveform, a low spontaneous discharge rate, a greater positive-going amplitude than simple spikes, and a lesser negative-going amplitude than simple spikes. Complex spikes were difficult to reliably track across trials, due to the changing shape across time of the complex spike waveform and the low discharge rate. Also, rabbits in the present study were very well trained. Previous studies have demonstrated a decrease in US-evoked activity in the inferior olive during paired trials when a CR is elicited (Sears and Steinmetz 1991), which results in nearly an absence of US-related evoked complex spikes in the cerebellar cortex on CR trials (Berthier and Moore 1986).
Offline separation of individual units was done with the threshold discrimination and template-matching algorithms of the offline spike sorting system. Typically, 1-3 units could be separated at each recording location and very occasionally, four units could be isolated. Although it is possible that a single Purkinje cell was isolated and recorded during more than one session, we assumed that this was not the case. Rather, recorded spikes were treated as independent events across training for each rabbit. Following spike separation, behavioral and unit data were binned (bin size = 2.832) and analyzed using custom software. Data were separated according to trial type (CS-alone, US-alone, and paired) and behavior type (CR, non-CR), and analyzed independently. For analyses of increases and decreases in cell firing during trials, the period between CS onset and US onset was divided into subperiods of 50-msec each. For the 250-msec CS-US interval trials, this resulted in five subperiods and for the 750-msec CS-US interval trials, this resulted in fifteen subperiods. For each trial, difference scores were calculated by subtracting the mean activity for the 750-msec prior to CS onset from the mean activity for each of post-CS subperiods. For a session, five or fifteen CS period standard scores were formed by dividing the mean of the corresponding difference score by the standard error of the corresponding difference score. Criterion for a significant increase or decrease in activity in a particular CS subperiod for paired trials was 2.042, which is the critical value at P = 0.05 for a two-tailed t-test with 30° of freedom. The criterion for CS-alone trials was 2.069 (df = 23).
Acknowledgments
Supported by an NIMH grant MH62013 to J.E.S. The authors wish to thank Dale Sengelaub for his assistance with the HRP experiments.
Article published online ahead of print. Article and publication date are at http://www.learnmem.org/cgi/doi/10.1101/lm.89505.
References
- Aitkin, L.M. and Boyd, J. 1975. Responses of single units in cerebellar vermis of the cat to monaural and binaural stimuli. J. Neurophysiol. 38: 418-429. [DOI] [PubMed] [Google Scholar]
- Allen, M.T. and Steinmetz, J.E. 1994. Cerebellar single unit recording during discrimination learning to different CS-US intervals in the classically conditioned rabbit eyeblink paradigm. Soc. Neurosci. Abstr. 20: 795. [Google Scholar]
- Armstrong, D.M. and Edgley, S.A. 1984. Discharges of Purkinje cells in the paravermal part of the cerebellar anterior lobe during locomotion in the cat. J. Physiol. 352: 403-424. [DOI] [PMC free article] [PubMed] [Google Scholar]
- Armstrong, D.M. and Rawson, J.A. 1979. Activity patterns of cerebellar cortical neurones and climbing fibre afferents in the awake cat. J. Physiol. 289: 425-448. [DOI] [PMC free article] [PubMed] [Google Scholar]
- Berthier, N.E. and Moore, J.W. 1986. Cerebellar Purkinje cell activity related to the classically conditioned nictitating membrane response. Exp. Brain Res. 63: 341-350. [DOI] [PubMed] [Google Scholar]
- ____. 1990. Activity of deep cerebellar nuclear cells during classical conditioning of nictitating membrane extension in rabbits. Exp. Brain Res. 83: 44-54. [DOI] [PubMed] [Google Scholar]
- Bishop, G.A., McCrea R.A., Lighthall, J.W., and Kitai, S.T. 1979. An HRP and autoradiographic study of the projection from the cerebellar cortex to the nucleus interpositus anterior and nucleus interpositus posterior of the cat. J. Comp. Neurol. 185: 735-756. [DOI] [PubMed] [Google Scholar]
- Chen, G. and Steinmetz, J.E. 1998. A general-purpose computer system for behavioral conditioning and neural recording experiments. Behav. Res. Meth. Instr. Comp. 30: 384-391. [Google Scholar]
- Ciancone, M.T. and Rebec, G.V. 1989. A simple device for the reliable production of varnish-insulated, high-impedance tungsten microelectrodes. J. Neurosci. Meth. 27: 77-79. [DOI] [PubMed] [Google Scholar]
- Dietrichs, E. 1981. The cerebellar corticonuclear and nucleocortical projections in the cat as studied with anterograde and retrograde transport of horseradish peroxidase. Anat. Embryol. 162: 223-247. [DOI] [PubMed] [Google Scholar]
- Edgley, S.A. and Lidierth, M. 1987. The discharges of cerebellar Golgi cells during locomotion in the cat. J. Physiol. 392: 315-332. [DOI] [PMC free article] [PubMed] [Google Scholar]
- Garcia, K.S. and Mauk, M.D. 1998. Pharmacological analysis of cerebellar contributions to the timing and expression of conditioned eyelid responses. Neuropharm. 37: 471-480. [DOI] [PubMed] [Google Scholar]
- Garcia, K.S., Steele, P.M., and Mauk, M.D. 1999. Cerebellar cortex lesions prevent acquisition of conditioned eyelid responses. J. Neurosci. 19: 10940-10947. [DOI] [PMC free article] [PubMed] [Google Scholar]
- Gould, T.J. and Steinmetz, J.E. 1996. Changes in rabbit cerebellar cortical and interpositus nucleus activity during acquisition, extinction, and backward classical eyelid conditioning. Neurobiol. Learn. Mem. 65: 17-34. [DOI] [PubMed] [Google Scholar]
- Green, J.T. and Steinmetz, J.E. 2002. Purkinje cell activity in the cerebellar anterior lobe during eyeblink conditioning in rabbits. Abstract Viewer Itinerary Planner, Program No. 676.11. Society for Neuroscience, Washington, D.C.
- Hesslow, G. 1994. Correspondence between climbing fibre input and motor output in eyeblink-related areas in cat cerebellar cortex. J. Physiol. (Lond.) 476: 229-244. [DOI] [PMC free article] [PubMed] [Google Scholar]
- Hesslow, G. and Ivarsson, M. 1994. Suppression of cerebellar Purkinje cells during conditioned responses in ferrets. Neuroreport 5: 649-652. [DOI] [PubMed] [Google Scholar]
- Katz, D.B. and Steinmetz, J.E. 1997. Single-unit evidence for eye-blink conditioning in cerebellar cortex is altered, but not eliminated, by interpositus nucleus lesions. Learn. Mem. 3: 88-104. [DOI] [PubMed] [Google Scholar]
- Katz, D.B., Tracy, J., and Steinmetz, J.E. 2001. Rabbit classical eyeblink conditioning is altered by brief cerebellar cortical stimulation. Physiol. Behav. 72: 499-510. [DOI] [PubMed] [Google Scholar]
- Kehoe, E.J., Horne, P.S., and Horne, A.J. 1993. Discrimination learning using different CS-US intervals in classical conditioning of the rabbit's nictitating membrane response. Psychobiol. 21: 277-285. [Google Scholar]
- King, D.A.T., Krupa, D.J., Foy, M.R., and Thompson, R.F. 2001. Mechanisms of neuronal conditioning. Int. Rev. Neurobiol. 45: 313-337. [DOI] [PubMed] [Google Scholar]
- Larsell, O. 1970. Rabbit. In The comparative anatomy and histology of the cerebellum from monotremes through apes (ed. J. Jansen), pp. 116-123. University of Minnesota Press, Minneapolis, MN.
- Lavond, D.G. and Steinmetz, J.E. 1989. Acquisition of classical conditioning without cerebellar cortex. Behav. Brain Res. 33: 113-164. [DOI] [PubMed] [Google Scholar]
- Lavond, D.G., Hembree, T.L., and Thompson, R.F. 1985. Effect of kainic acid lesions of the cerebellar interpositus nucleus on eyelid conditioning in the rabbit. Brain Res. 326: 179-182. [DOI] [PubMed] [Google Scholar]
- Lisberger, S.G. and Fuchs, A.F. 1978. Role of primate flocculus during rapid behavioral modification of vestibuloocular reflex. I. Purkinje cell activity during visually guided horizontal smooth-pursuit eye movements and passive head rotation. J. Neurophysiol. 41: 733-763. [DOI] [PubMed] [Google Scholar]
- Mauk, M.D. and Ruiz, B.P. 1992. Learning-dependent timing of Pavlovian eyelid responses: Differential conditioning using multiple interstimulus intervals. Behav. Neurosci. 106: 666-681. [DOI] [PubMed] [Google Scholar]
- McCormick, D.A. and Thompson, R.F. 1984. Neuronal responses of the rabbit cerebellum during acquisition and performance of a classically conditioned nictitating membrane-eyelid response. J. Neurosci. 4: 2811-2822. [DOI] [PMC free article] [PubMed] [Google Scholar]
- Medina, J.F., Garcia, K.S., Nores, W.L., Taylor, N.M., and Mauk, M.D. 2000. Timing mechanisms in the cerebellum: Testing predictions of a large-scale computer simulation. J. Neurosci. 20: 5516-5525. [DOI] [PMC free article] [PubMed] [Google Scholar]
- Medina, J.F., Garcia, K.S., and Mauk, M.D. 2001. A mechanism for savings in the cerebellum. J. Neurosci. 21: 4081-4089. [DOI] [PMC free article] [PubMed] [Google Scholar]
- Mesulam, M-M. 1978. Tetramethyl benzidine for horseradish peroxidase neurohistochemistry: A non-carcinogenic blue reaction-product with superior sensitivity for visualizing neural afferents and efferents. J. Histochem. Cytochem. 26: 106-117. [DOI] [PubMed] [Google Scholar]
- Ohyama, T. and Mauk, M.D. 2001. Latent acquisition of timed responses in cerebellar cortex. J. Neurosci. 21: 682-690. [DOI] [PMC free article] [PubMed] [Google Scholar]
- Perrett, S.P. and Mauk, M.D. 1995. Extinction of conditioned eyelid responses requires the anterior lobe of cerebellar cortex. J. Neurosci. 15: 2074-2080. [DOI] [PMC free article] [PubMed] [Google Scholar]
- Perrett, S.P., Ruiz, B.P., and Mauk, M.D. 1993. Cerebellar cortex lesions disrupt learning-dependent timing of conditioned eyelid responses. J. Neurosci. 13: 1708-1718. [DOI] [PMC free article] [PubMed] [Google Scholar]
- Sears, L.L. and Steinmetz, J.E. 1991. Dorsal accessory inferior olive activity diminishes during acquisition of the rabbit classically conditioned eyelid response. Brain Res. 545: 114-122. [DOI] [PubMed] [Google Scholar]
- Shek, J.W., Wen, G.Y., and Wisniewski, H.M. 1986. Atlas of the rabbit brain and spinal cord. Karger, Switzerland.
- Steinmetz, J.E. and Sengelaub, D.R. 1992. Possible conditioned stimulus pathway for classical eyelid conditioning in rabbits I. Anatomical evidence for direct projections from the pontine nuclei to the cerebellar interpositus nucleus. Behav. Neural Biol. 57: 103-115. [DOI] [PubMed] [Google Scholar]
- Steinmetz, J.E., Lavond, D.G., Ivkovich, D., Logan, C.G., and Thompson, R.F. 1992. Disruption of classical eyelid conditioning after cerebellar lesions: Damage to a memory trace system or a simple performance deficit? J. Neurosci. 12: 4403-4426. [DOI] [PMC free article] [PubMed] [Google Scholar]
- Thach, W.T. 1968. Discharge of Purkinje and cerebellar nuclear neurons during rapidly alternating arm movements in the monkey. J. Neurophysiol. 31: 785-797. [DOI] [PubMed] [Google Scholar]
- Thompson, L.T., Moyer Jr., J.R., Akase, E., and Disterhoft, J.F. 1994. A system for quantitative analysis of associative learning. Part 1. Hardware interfaces with cross-species applications. J. Neurosci. Methods 54: 109-117. [DOI] [PubMed] [Google Scholar]
- Trott, J.R. and Armstrong, D.M. 1987. The cerebellar corticonuclear projection from lobule Vb/c of the cat anterior lobe: A combined electrophysiological and autoradiographic study. I. Projections from the intermediate region. Exp. Brain Res. 66: 318-338. [DOI] [PubMed] [Google Scholar]
- Yeo, C.H., Hardiman, M.J., and Glickstein, M. 1985a. Classical conditioning of the nictitating membrane response of the rabbit I. Lesions of the cerebellar nuclei. Exp. Brain Res. 60: 87-90. [DOI] [PubMed] [Google Scholar]
- ____. 1985b. Classical conditioning of the nictitating membrane response of the rabbit II. Lesions of the cerebellar cortex. Exp. Brain Res. 60: 99-113. [DOI] [PubMed] [Google Scholar]


