Adv. Sci. 2024, e2307556.
https://doi.org/10.1002/advs.202307556
Description of errors:
-
1.
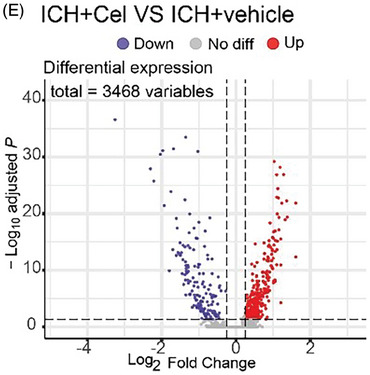
The original Figure 1 contain an error in Figure 1E. The revised Figure 1E is shown below.
-
2.
The figure legends of Figures 1, 2, 3, 6, 7, 8, and 9 contained errors in the description of statistical significance. The incorrect descriptions “** p < 0.001, *** p < 0.0001” and “## p < 0.001, ### p < 0.0001” has been corrected to “** p < 0.01, *** p < 0.001” and “## p < 0.01, ### p < 0.001”.
-
3.
In the original figure, the x‐axis of Figure 5E was erroneously read. The x‐axis has now been correctly changed. Additionally, the figure legend of Figure 5 ha missing items and order problems. The revised figure legend for Figure 5 is shown below.

Figure 5 Enrichment analysis to identify potential target signaling pathway for celastrol on neurons. A) Rbfox3 was used as a marker for neurons. B) 3D‐Principal component analysis (PCA) was employed to identify the subclusters with the highest variance. C) The strength of interactions between neuron 8 and other cell types was evaluated through CellChat analysis of intercellular communication. D) The analysis of cell–cell communication was performed using CellChat to demonstrate the quantification of interactions between neuron 8 and other cellular populations. E) The volcano plot illustrates the differential expression of genes between the ICH+Cel group and the ICH+vehicle group. F) A Gene Ontology (GO) enrichment analysis was performed to identify potential signaling pathways regulated by celastrol following ICH, with an average log2 fold change >0.25. G) Kyoto Encyclopedia of Genes and Genomes (KEGG) pathway analysis was conducted to identify potential signaling pathways regulated by celastrol following ICH, with an average log2 fold change >0.25.
These changes do not affect the results or conclusions of this study. The authors apologize for any inconvenience caused.


