

Abstract
Microdomains such as rafts are considered as scaffolds for phosphatidylinositol (4,5) bisphosphate (PIP2) signaling, enabling PIP2 to selectively regulate different processes in the cell. Enrichment of PIP2 in microdomains was based on cholesterol-depletion and detergent-extraction studies. Here we show that two distinct phospholipase C-coupled receptors (those for neurokinin A and endothelin) share the same, homogeneously distributed PIP2 pool at the plasma membrane, even though the neurokinin A receptor is localized to microdomains and is cholesterol dependent in its PIP2 signaling whereas the endothelin receptor is not. Our experiments further indicate that detergent treatment causes PIP2 clustering and that cholesterol depletion interferes with basal, ligand-independent recycling of the neurokinin A receptor, thereby providing alternative explanations for the enrichment of PIP2 in detergent-insoluble membrane fractions and for the cholesterol dependency of PIP2 breakdown, respectively.
Keywords: fluorescence resonance energy transfer, G protein-coupled receptor, PIP2, Rafts, Triton X-100
Introduction
The phospholipid phosphatidylinositol 4,5-biphosphate (PIP2) is a minor component in the plasma membrane, but it has important regulatory roles in many cellular processes. Apart from being the precursor for second messengers such as DAG, IP3 and PIP3 (Berridge and Irvine, 1984; Rameh and Cantley, 1999), it is also a messenger itself, with reported effects ranging from channel gating to vesicle trafficking and reorganization of the actin cytoskeleton (for reviews, see Czech, 2000; Caroni, 2001; Hilgemann et al, 2001). How can a single lipid species regulate multiple physiological processes in a cell, apparently with spatial resolution? In an attempt to solve this enigma, it has been widely hypothesized that spatially confined PIP2 pools must exist in the plasma membrane (e.g., Hinchliffe et al, 1998; Martin, 2001; Simonsen et al, 2001; Janmey and Lindberg, 2004).
The microscopical distribution of PIP2 along the plasma membrane has been studied in fixed cells with PIP2-specific antibodies (Laux et al, 2000) as well as in living cells using GFP-tagged pleckstrin homology domains (GFP-PH) as PIP2 labels (Stauffer et al, 1998; Varnai and Balla, 1998). In a recent detailed study employing this latter technique, we reported that in several cell types tested, GFP-PH labeling of the plasma membrane appeared strictly homogenous. In this study, we also showed that reported local GFP-PH enrichments, which had been interpreted to represent PIP2 concentrations, appeared due to subresolution folding of the membrane (van Rheenen and Jalink, 2002). In support of this view, fluorescent recovery after photobleaching (FRAP) experiments demonstrated that diffusion of fluorescent PIP2 is too fast to maintain enrichments in the plasma membrane at a micrometer scale. However, as the resolution of light microscopy does not allow studying structures smaller than ∼250 nm, the possible confinement of PIP2 to smaller structures such as rafts was not addressed in this study.
Rafts are small (<250 nm) lipid domains in the plasma membrane that have recently attracted much attention as (hypothetical) scaffolds for signal transduction components. Rafts differ from the bulk membrane in lipid composition, that is, they are enriched in cholesterol, sphingolipids and saturated phospholipids. This causes the lipids to be in a so-called liquid-ordered state that is thought to limit diffusion significantly. Biochemically, rafts are characterized as resistant to solubilization in detergents such as Triton X-100 at 4°C (Chamberlain, 2004) and by their dependence on cholesterol: extraction of cholesterol using methyl-β-cyclodextrin (CD) disrupts the rafts and redistributes the signaling complexes (reviewed by Simons and Ikonen, 1997; Simons and Toomre, 2000). However, it is important to note that there is no universal support for this hypothesis, and in fact, there is no clear consensus about the size, lifetime and cholesterol dependency of membrane rafts, or even for their very existence (Kenworthy and Edidin, 1998; Kenworthy et al, 2000; Munro, 2003; Glebov and Nichols, 2004). For example, whereas rafts were studied by detergent extraction methods and visualized by clustering them together into micrometer-sized structures with antibodies, it was subsequently shown that these techniques can cluster molecules into non-pre-existing domains (Mayor et al, 1994; Kenworthy and Edidin, 1998; Heerklotz, 2002; Pizzo et al, 2002; Edidin, 2003; Munro, 2003).
Nevertheless, the possible confinement of (a pool of) PIP2 to rafts would provide a mechanism to prevent spreading of the effects of local PIP2 breakdown by phospholipase C (PLC). This hypothesis, which we here term ‘raft-delimited PIP2 signaling', is supported by a few biochemical studies (Koreh and Monaco, 1986; Hope and Pike, 1996; Pike and Casey, 1996; Pike and Miller, 1998; Waugh et al, 1998; Hur et al, 2004). For example, Pike and Casey (1996) demonstrated enrichment of PIP2 in the detergent-resistant fraction of A431 cells, which was eliminated by prior stimulation with bradykinin. In the present study, raft-delimited PIP2 signaling is re-examined. We first establish that PIP2 breakdown evoked by neurokinin A (NKA) receptors (NK2r) but not endothelin (ET) B receptors (ETBr) shows the hallmarks of raft dependency in HEK293 cells. We then use cell biological, biophysical and electromicroscopical methods to show that PIP2 is not confined to rafts in these cells.
Results and discussion
Neurokinin A receptor- but not endothelin B receptor-mediated PIP2 hydrolysis is cholesterol dependent
Because rafts are too small to be resolved with light microscopy, and we wished to avoid detergent extraction methods, we used alternative methods to address possible raft-delimited PIP2 signaling. One generally employed approach is to study the effects of raft disruption by extraction of cholesterol with CD. To continuously monitor integrity of the receptor–PLC–PIP2 signaling cascade, we adopted an approach to read out membrane PIP2 content by fluorescence resonance energy transfer (FRET) (van der Wal et al, 2001). In this assay, cells are cotransfected with CFP- and YFP-tagged PIP2-binding PH domains derived from PLCδ1 (Figure 1A). At rest, these constructs are concentrated at the membrane by binding to PIP2, and FRET occurs. Following PIP2 hydrolysis, the PH domains can no longer bind, and the proteins dilute out into the cytosol, thereby abolishing FRET. Loss of FRET is detected continuously by monitoring the emission ratio of YFP:CFP while exciting CFP at 425 nm. As a control, when non-PIP2 binding mutant (R40L) PH domains were used, activation of PLC had no effect on FRET (not shown). This technique offers subsecond temporal resolution, while minimizing excitation damage to the cells (for further details, see Materials and methods). We initially focused on the human neurokinin A receptor as a model system, since there is some evidence for its compartmentalization at the plasma membrane (Vollmer et al, 1999; Cezanne et al, 2004). To assess integrity of the signaling cascade, HEK293 cells expressing NKA receptors were repeatedly stimulated with brief pulses of agonist from a puffer pipette (Figure 1A). Following each puff of NKA, the YFP:CFP emission ratio dropped rapidly, indicative of a decrease in the membrane PIP2 levels (Figure 1B, left panel). Upon termination of the stimulus, PIP2 was resynthesized and FRET returned to basal levels. With brief pulses, the receptors do not desensitize, and functional integrity of the signaling cascade can be monitored for hours.
Figure 1.
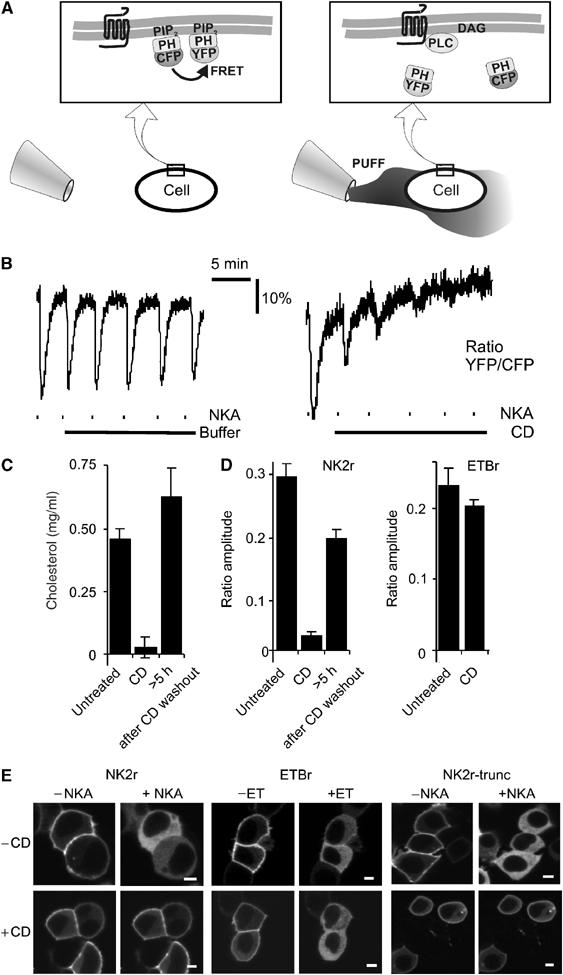
PIP2 hydrolysis induced by the NK2r, but not the ETB receptor, is cholesterol dependent. (A) Schematic representation of the FRET assay that allows for continuous read out of the integrity of the receptor–PLC–PIP2 signaling cascade. (Left panel) In a resting cell, CFP-PH and YFP-PH bind to PIP2 at the membrane and FRET occurs. (Right panel) Using a puffer pipette, the cell is briefly (∼10 s) exposed to agonist. This causes rapid degradation of PIP2, resulting in translocation of CFP-PH and YFP-PH into the cytosol, with consequent loss of FRET. Subsequently, the agonist dilutes out through diffusion, PIP2 is resynthesized and FRET recovers. For further details, see Materials and methods. (B) HEK293 cells expressing human NK2r were repeatedly stimulated with brief pulses of NKA (dashes, 10-s pulses from a puffer pipette containing 100 μM NKA). (Left panel) Control demonstrating repeated activation of the signaling cascade. (Right panel) Following a test pulse, CD (10 mM) was added (solid line), which rapidly inhibited signaling induced by further NKA pulses. (C) CD treatment causes depletion of cholesterol levels. Upon washout of CD, cholesterol levels recovered. (D) Quantitative analysis of the effects of CD treatment on agonist-induced FRET changes for NKA and ET. (E) HEK293 cells were cotransfected with GFP-PH and either the NK2r, the ETBr or a desensitization-defective truncation mutant of the NK2r as indicated. Confocal images were acquired from untreated (−CD) or CD-treated (+CD) cells before and 30 s after receptor stimulation. Scale bars, 5 μm. Note that in all cases, receptor stimulation induced translocation of GFP-PH to the cytosol (>80% of the cells), except for cells expressing NK2r that were treated with CD (wt NK2r, <30% of cells (partially) responded; desensitization-defective NK2r, <35% of cells responded; N>200; P<0.002).
Strikingly, cholesterol extraction compromised the integrity of the signaling cascade in HEK293 cells within minutes, evident as a rapid loss of responsiveness to NKA pulses (Figure 1B, right panel). Maximal suppression of NK2r-induced PIP2 hydrolysis occurred after 20–30 min of CD treatment. At this time, the cholesterol content of the cells was reduced by >90% (Figure 1C). The effects of CD treatment were reversible, as removal of CD restored cholesterol levels as well as the ability of NKA to induce PIP2 breakdown (Figure 1C and D, left panel). Similar results were obtained when the membrane localization of GFP-PH (Stauffer et al, 1998; Varnai and Balla, 1998) was studied by confocal microscopy (Figure 1E). As a control, α-cyclodextrin, which does not extract cholesterol, had no effect on PLC signaling (data not shown).
Intriguingly, the effect of CD treatment appeared specific for the NK2r in that PIP2 breakdown mediated via the ETBr was not affected (Figure 1D, right panel, and Figure 1E, middle panel). Conceivably, this would reflect very strong coupling of the ETBr to PLC. We therefore included a desensitization-defective mutant of the NK2r (Alblas et al, 1995) in our experiments. In our hands, this mutant is by far the most potent surface receptor in activating PLC (van der Wal et al, 2001); however, it was equally sensitive to CD pretreatment as the wild-type NK2r (Figure 1E, right panel). Thus, we have identified the NKA and ET receptors as, respectively, sensitive and resistant to cholesterol extraction in HEK293 cells, providing a unique opportunity to address raft-delimited PIP2 signaling.
Neurokinin A and endothelin receptors distribute differently along the plasma membrane
The differential sensitivity to CD treatment of NK2r- and ETBr-mediated PLC signaling suggests that in the former, one or more components of the signaling pathway is/are spatially confined to rafts, whereas in the latter, the entire signaling cascade must be raft-independent. We first sought to assess localization of the G protein-coupled receptors (GPCRs) to rafts. NKA and ET receptors were tagged C-terminally with GFP and expressed in HEK293 cells (Figure 2A and B). The GFP tags do not interfere with receptor signaling, since stimulation with their cognate agonists induced normal PLC-mediated PIP2 degradation and subsequent internalization of the receptors.
Figure 2.
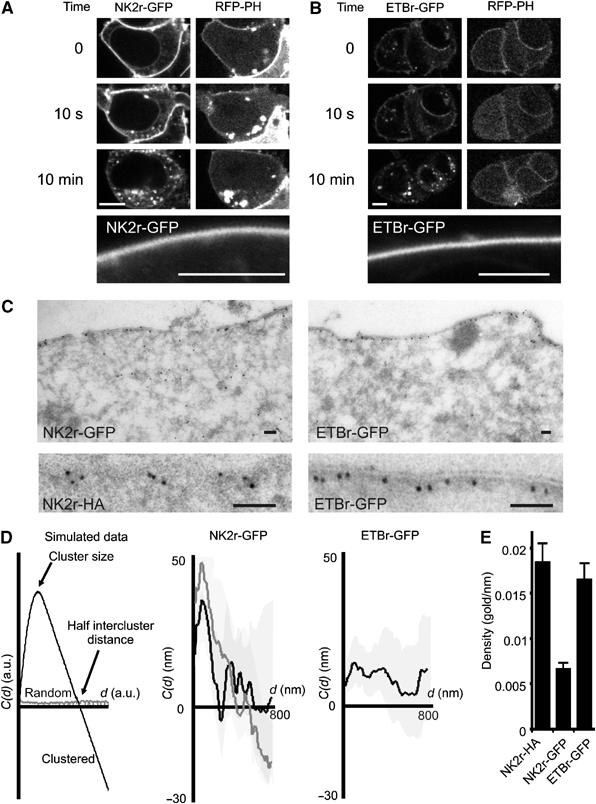
Distribution of NK2r and ETBr at the plasma membrane. HEK293 cells were cotransfected with RFP-PH and with the GFP-tagged NKA (A) or ETB (B) receptor. Confocal images were acquired before, at 10 s, and at 10 min after receptor stimulation. Within 10 s of agonist addition, PLC is fully activated as deduced from the translocation of RFP-PH to the cytosol, whereas receptor internalization takes several minutes to complete. The lower panels show NK2r-GFP and ETBr-GFP at high magnification to illustrate lack of clustering at the light microscopical level in the absence of agonist. Scale bars, 5 μm. (C) (Left panels) EM micrograph of the localization of GFP-NK2r at the plasma membrane. The lower panel shows a similar result obtained with HA-tagged NK2r, using an antibody against the HA tag. (Right panels) Localization of GFP-ETBr by EM. Scale bars, 100 nm. (D) Cluster analysis of the distribution of gold particles from EM pictures, using a one-dimensional adaptation (see Materials and methods) of Ripley's K analysis. With randomly distributed particles, the cluster parameter C(d) is close to 0 for all cluster diameters d (left panel, gray line). In a clustered data set, for d increasing from 0, C(d) initially becomes positive (indicating over-representation of short distances in the data set), and subsequently crosses the x-axis to become negative. The location of the maximum predicts the average radius of the clusters, and the intersection with the x-axis indicates half of the intercluster distance (left panel, black line). Pooled results from cluster analyses for the NKA receptor (middle panel, black line) confirm strong clustering, whereas the ET receptor (right panel) is not clustered. Treatment of cells expressing NK2r with CD (middle panel, gray line) had little effect on overall clustering and the average cluster size was unaffected. The shaded regions indicate standard errors. (E) Expression levels (mean+s.e.) of HA- or GFP-tagged receptors used for the analysis in (D). Density (gold particles per nanometer membrane) was derived from EM micrographs.
Confocal images of both receptors showed homogeneous labeling at the plasma membrane (Figure 2A and B), which is perhaps not surprising because of the small size of the putative rafts. To obtain higher resolution, cells were fixed and immunogold-labeled with anti-GFP antibodies, followed by analysis of ultrathin slices by electron microscopy (EM). The results revealed striking clustering of the NK2r, but not of ETBr (Figure 2C). To quantitate clustering, we adapted the cluster analysis developed by Ripley (1977) for analysis of the one-dimensional data from ultrathin slices (see Materials and methods). In essence, this statistical method compares the observed distribution of particles with the theoretically expected distribution for random particles, yielding density-independent data on clustering as well as on the mean cluster size and the distance between clusters (Figure 2D, left panel). As expected from the micrographs, analysis of the gold particles showed strong clustering for the NK2r and a random pattern for the ETBr (Figure 2D). Mean cluster size for the NK2r was ∼80 nm, and mean cluster distance was ∼400 nm. These values correspond quite well to sizes reported for microdomains and, in particular, for diffusion confinement zones recently found for the rat NK2r (Cezanne et al, 2004). The observed clustering of the NKA receptor is not noticeably influenced by the GFP tag, since HA-tagged NK2r yielded identical results (Figure 2C, NK2r-HA; cluster analysis not shown). Furthermore, differences in clustering are not due to differences in expression levels of those constructs because ET receptors and NK2r were expressed at comparable levels (Figure 2E), and because cluster analysis of selected cells with low label density gave identical results (not shown). Evidently, the experimentally determined size and intercluster distance are in good agreement with the observed homogenous distribution as seen by confocal microscopy.
As CD pretreatment rapidly abolishes NKA-mediated PLC signaling, we next investigated its effects on clustering at the EM level. Surprisingly, cholesterol depletion had little effect on NK2r clustering (Figure 2D), in that there was only a slight effect on distance between the clusters with no detectable effect on cluster size. This indicates that the loss of signaling is not due to dislodgement of the receptors, and led us to hypothesize that CD disrupts coclustering of PIP2 with the receptors.
Ultrastructural analysis reveals homogenous distribution of PIP2 along the plasma membrane
To address the possibility of PIP2 confinement to rafts, we first studied clustering of a PIP2 binding construct by EM. Specific labeling of PIP2 for immunohistochemistry has been previously carried out using PIP2-specific antibodies (Laux et al, 2000). In such studies, cells are fixed and permeabilized by detergent to allow entry of the antibodies. However, because it was recently shown that detergent treatment can cluster molecules into non-pre-existing domains (Heerklotz, 2002), we studied the localization of PIP2 by expressing tagged PH (PLCδ1) domains in HEK293 cells. Ultrathin frozen sections of these cells were labeled with gold-tagged anti-GFP antibodies, eliminating the need for detergent permeabilization to gain access to the cells (Watt et al, 2002). Because approximately 50% of GFP-PH is cytosolic in resting cells (van der Wal et al, 2001), a tandem-PH construct (GFP-PH-PH; see Materials and methods) with increased membrane affinity was used. Whereas this chimera was absent from the cytosol, its localization at the membrane was identical to that of GFP-PH. High-resolution EM pictures from these preparations showed homogenous distribution of gold particles along the plasma membrane (Figure 3A). Again, a modified Ripley's cluster analysis was performed (Figure 3A, right panel), which confirmed random distribution of GFP-PH-PH in untreated cells (N=6). Thus, by EM, PIP2 at the membrane is not clustered.
Figure 3.
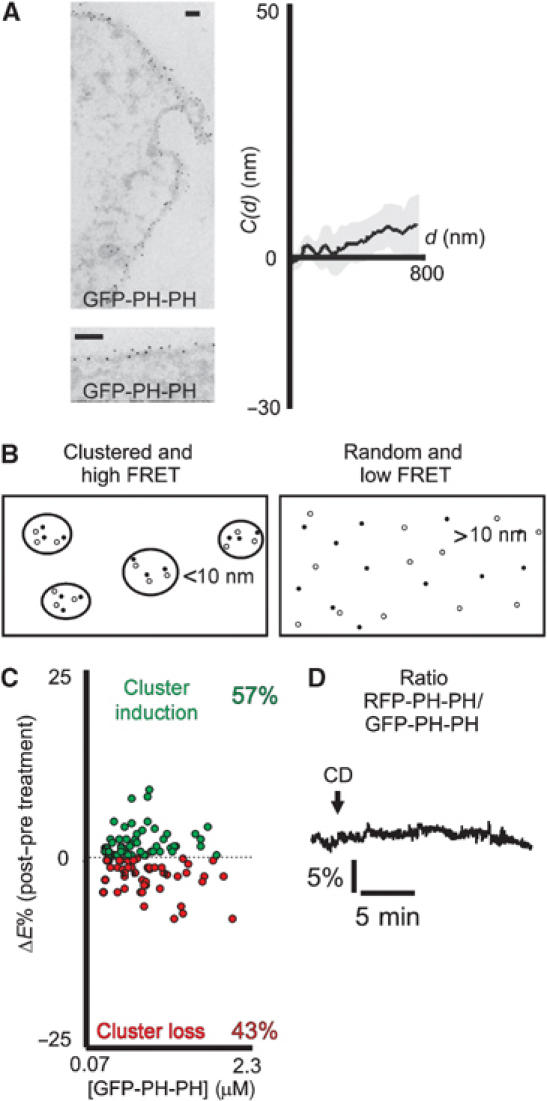
PIP2 distribution along the plasma membrane is homogeneous. (A) (Left panel) Representative EM images of cells expressing GFP-PH-PH, gold-labeled with antibodies against GFP. The average density of the probe is 0.029±0.003 gold/nm membrane. Scale bar, 100 nm. (Right panel) Cluster analysis of pooled data obtained with GFP-PH-PH indicates randomness of labeling. Results from cells expressing the probe at very low or quite high levels gave similar results. (B) Schematic representation of cluster assay by live cell FRET. When PIP2 probes are clustered (left panel), the mean probe distance will be smaller, resulting in higher FRET efficiencies in comparison to the random situation (right panel). See Supplementary data for a detailed treatment of the effects of clustering on FRET. (C) For various probe concentrations, the effect of CD treatment on the efficiency of FRET between GFP-PH-PH and RFP-PH-PH was determined using fluorescence lifetime imaging (FLIM). A gain in FRET is depicted in green, and a loss in red. For all concentrations, the FRET changes align along the x-axis, with an average change of 0.024±0.35%, indicating no effect of CD treatment on clustering. Shown is a representative out of five experiments. (D) Representative ratiometric FRET trace from a single HEK293 cell expressing GFP-PH-PH and RFP-PH-PH. Treatment with CD to disrupt clustering did not affect FRET.
Assessment of PIP2 clustering in vivo by FRET
To confirm this finding in vivo, we set out to study the membrane PIP2 distribution by measuring clustering-dependent FRET, a technique that was pioneered by Kenworthy and Edidin (1998). FRET is proportional to the inverse sixth power of the distance between the donor and the acceptor, and thus a theoretical relationship can be derived for the dependence of resonance on label density. Cells are labeled with suitable donor and acceptor fluorophores, and resonance efficiencies are determined for different concentrations of the fluorophores. To assess clustering, the plot of FRET efficiency versus labeling intensity is then compared to the theoretical relationship. When fluorophores are clustered at the membrane, distances between donors and acceptors are less than in the case of randomly distributed fluorophores, resulting in a left-shifted dose–response curve (Figure 3B). For further details, please refer to Supplementary data (section 1) where the relationship between FRET and clustering is determined by using Monte-Carlo simulations. Results in that section also form a sensitivity analysis delineating the importance of various parameters contributing to clustering-dependent FRET. These calculations demonstrate that at the concentrations of chimeras actually found in vivo in our cells, the disruption of clusters containing only a few percent of total PIP2 leads to significant reduction in FRET, and thus should be readily detectable in our experiments.
We applied this technique to study clustering of membrane PIP2 by coexpressing chimeras of PIP2-binding PH domains with (monomeric) green and red fluorescent proteins. Considerable effort was invested into minimizing experimental variability; for details, please refer to ‘Optimizing assessment of clustering by FRET' in Supplementary data (section 2). First, we derived energy transfer from donor fluorescence lifetime measurements (FLIM; see Materials and methods), which is a quantitative, although rather involved, technique to asses FRET. In five independent experiments, comparison of FRET values before and after disruption of rafts in populations of 80–150 cells failed to show differences (difference: 0.024±0.35%; see Figure 3C). In a second set of experiments, FRET was followed by ratiometry in single living cells during cholesterol extraction. This approach, although not very quantitative, is extremely sensitive to changes from baseline (Figure 3D). Again, disruption of rafts by treatment with CD was without detectable effect (N=25). Taken together, our experiments indicate that PIP2 is not enriched in microdomains at the plasma membrane.
Critical evaluation of the previous results in the context of published literature
Having determined that PIP2 distributes homogenously along the plasma membrane, two critical questions remained. First, what might be the reason that the above-mentioned data are at variance with data obtained by biochemical approaches for several cell types (Pike and Casey, 1996; Liu et al, 1998)? In these studies, the enrichment of PIP2 in low-density Triton X-100-insoluble fractions has been interpreted to reflect its selective partitioning into lipid rafts. Because a more recent study reported that detergent may induce lipid clustering itself (Heerklotz, 2002), we tested the effect of Triton X-100 on PIP2 clustering in live cells. Figure 4A (left panel) shows that treatment with only 0.0025% Triton X-100 caused a substantial increase in FRET in living cells coexpressing GFP-PH-PH and RFP-PH-PH, as detected ratiometrically. This deviation from baseline does not reflect a direct effect of Triton X-100 on the fluorophores, because the emission ratio of RFP-PH-PH and GFP-PH(R40L), which does not bind to PIP2, was not affected (Figure 4A, right panel). To quantitate the magnitude of the effect of Triton X-100, FLIM experiments were performed (Figure 4B and C). In good agreement with the previous result, treatment with Triton X-100 caused an increase (4.0±0.52%, mean±s.e.) in FRET between GFP-PH-PH and RFP-PH-PH in the vast majority of measurements, while it had no effect on control cells expressing only GFP-PH-PH. Statistical analysis by Student's t-test for paired observations showed that the difference between post- and pretreatment values of FRET was extremely significant (P<10−10), contrasting with P=0.95 for the effects of CD. Similar results were obtained in other cell types including MDCK and N1E-115 cells. Even larger FRET increases were observed upon addition of 0.5–1% Triton X-100 in ratiometric FRET experiments performed at 4°C. However, as Triton caused rapid lysis of the cells and consequent loss of the labels, quantitation was not experimentally feasible. We next checked whether Triton-induced FRET increases were accompanied by visible clustering of GFP-PH-PH. Confocal images acquired at high magnification (Figure 4D) failed to reveal clusters at 0.0025% Triton X-100 in most cases, but addition of 0.005% (which caused a larger increase in FRET ratio) induced enrichment of fluorescence in submicrometer-sized domains within a minute (see Supplementary data, Movie 1). This suggests that Triton causes subresolution PIP2 clusters at 0.0025% whereas at just twice that concentration, domains fuse to become visible clusters. These data indicate, first, that the here employed clustering assays are sensitive enough to report PIP2 clustering and, second, that Triton X-100 induces non-pre-existing clusters, which likely explains the discrepancy between our findings and previous biochemical reports.
Figure 4.
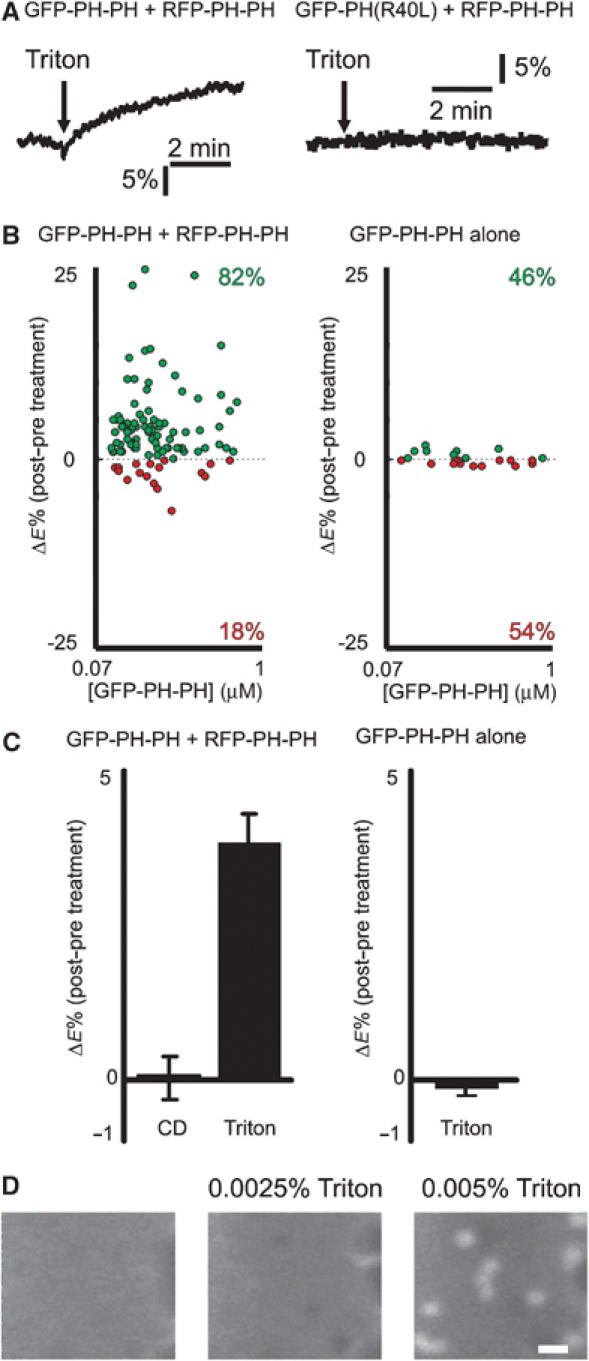
Triton X-100 induces non-pre-existing PIP2 clusters. (A) Ratiometric FRET traces from a cell coexpressing GFP-PH-PH and RFP-PH-PH (left panel) or a control cell with GFP-PH(R40L) and RFP-PH-PH (right panel). Addition of Triton X-100 (0.0025%) to cells expressing GFP-PH-PH and RFP-PH-PH, but not control cells, caused significant increases in FRET. Higher concentrations of Triton X-100 caused larger FRET changes but also increased permeabilization, causing fluorescence to leak out. Representative traces from experiments performed at least 12 times. (B) Effect of Triton X-100 treatment on FRET between GFP-PH-PH and RFP-PH-PH (left panel). Cells on a coverslip were marked and FRET was determined by FLIM. After Triton treatment, FRET in the same cells was measured again, and differences are plotted versus the expression level. Triton X-100 treatment did not affect control cells expressing only GFP-PH-PH (right panel). A gain in FRET is depicted in green, and a loss in red. (C) Statistical analysis (mean and s.e.) of the data from Figure 3C and panel D of this figure illustrates lack of effect of CD treatment (P>0.95), whereas Triton X-100 induces significant clustering (P≪0.001) in cells expressing both GFP-PH-PH and RFP-PH-PH. (D) Direct demonstration of Triton X-100-induced clustering of GFP-PH-PH in an HEK293 cell. Treatment with just 0.005% Triton X-100 induced visible clusters. Scale bar, 1 μm.
The second critical question concerns the cause of the observed acute disruption of NKA-induced PLC signaling upon cholesterol extraction. Our experiments show that cholesterol extraction does not disrupt NK2r clustering, as determined by EM, or influence PIP2 distribution, as determined by FRET measurements. How, then, does cholesterol extraction interfere with PIP2 hydrolysis induced by triggering the NKA receptor but not the ETBr? Apart from its effects on lipid rafts, the cholesterol content of the membrane also critically influences other processes (Munro, 2003), including lateral membrane fluidity (Ohvo-Rekila et al, 2002; Ramstedt and Slotte, 2002) and clathrin-mediated endocytosis (Rodal et al, 1999; Subtil et al, 1999). It was recently reported that certain GPCRs require constitutive, ligand-independent recycling to remain responsive to their cognate agonists (Dale et al, 2001; Kittler et al, 2004; Theriault et al, 2004; Xia et al, 2004). This process, termed tonic recycling, involves clustering by lateral movement in the plasma membrane, followed by clathrin-dependent endocytosis and subsequent exocytosis through lipid vesicles.
To examine whether CD treatment interferes with these processes, we studied the dynamics of GFP-tagged NKA and ET receptors by confocal time-lapse microscopy. First, we studied the effects of monensin, an ionophore that prevents exocytosis of vesicles derived from early endosomes by neutralizing intralumenal pH (Basu et al, 1981). As shown in Figure 5, treatment with monensin caused GFP-NK2r to accumulate in internal structures within minutes (Figure 5A). Concomitantly, NK2r-mediated PIP2 hydrolysis is blocked (data not shown). Strikingly, monensin treatment did not affect GFP-tagged ETBr (Figure 5B). This suggests that in the absence of exocytosis, tonic recycling causes rapid internalization of NK2r from the membrane. In line with this idea, monensin-induced internalization of NK2r was completely inhibited by CD treatment (Figure 5C). Apart from the effect on receptor endocytosis, cholesterol extraction also strongly interfered with lateral mobility of both GFP-tagged receptors at the plasma membrane, as visualized by FRAP experiments (Figure 5D). Interestingly, the lateral mobility of both GFP-NK2r and GFP-ETBr was blocked by brief CD treatment. The differential effect of CD treatment on NKA- and ET-induced PIP2 hydrolysis might thus be explained by the dependence of the NK2r, but not the ETBr, on tonic recycling. Whether possible additional effects of cholesterol extraction may play a role (for review, see Munro, 2003) remains to be determined. In any case, our experiments strongly suggest that CD treatment disrupts NKA-mediated signaling by interfering with its tonic recycling, rather than by disrupting rafts.
Figure 5.
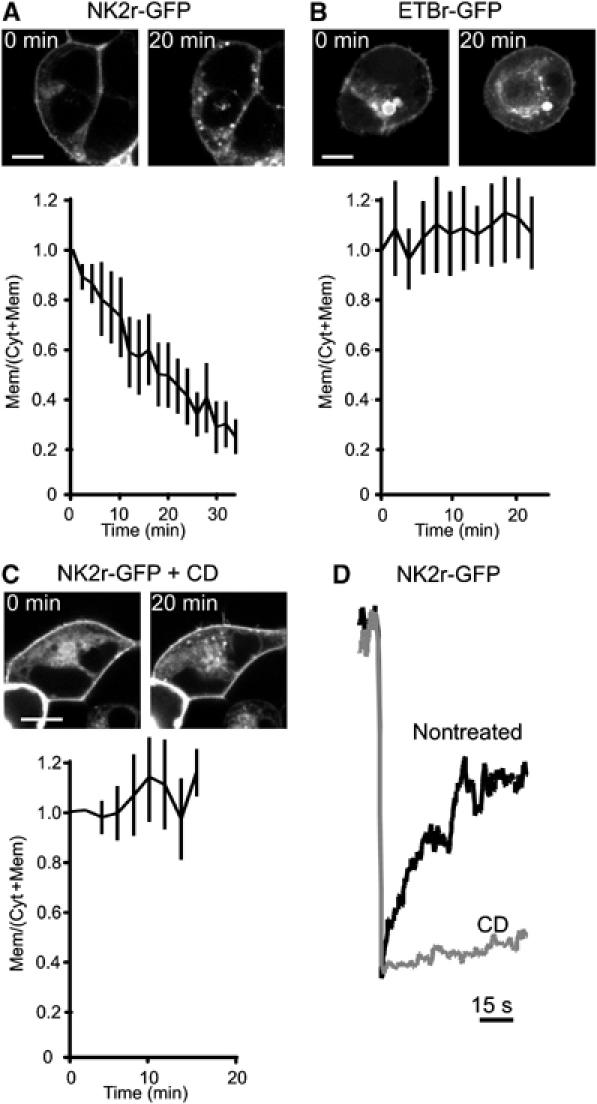
Cholesterol extraction inhibits NKA receptor internalization. HEK293 cells were transfected with GFP-tagged NK2r (A) or ETBr (B) and at t=0 s treated with monensin to prevent receptor recycling. Confocal images were acquired every 2–3 min and the ratio of membrane to cytosol fluorescence was determined by image analysis for each time point (see Materials and methods). The initial ratio was normalized to 1.0 to allow averaging of the results from 5 to 10 experiments for each condition. Mean and s.e. are plotted versus time. Scale bars, 5 μm. Note that receptors have not been exposed to agonists, and that all experiments have been performed in serum-free bicarbonate/HEPES-buffered saline (see Materials and methods). (C) Following treatment of cells with CD for 30 min, at t=0 monensin was added and cells were assayed for internalization of fluorescence. Note that tonic recycling of the NK2r is blocked by cholesterol extraction. (D) Diffusion of GFP-tagged NK2r at the plasma membrane was studied with FRAP in nontreated (black line) and CD treated (gray line) HEK293 cells. Cholesterol extraction dramatically lowers NK2r mobility.
Concluding remarks
It this study, the hypothesis of raft-delimited PIP2 signaling was addressed using EM and biophysical techniques. Our experiments showed that the NK2r appears strongly clustered at the membrane, and that its coupling to PIP2 hydrolysis is completely abolished upon cholesterol extraction. The opposite results were found for the ETBr. Nevertheless, independent lines of evidence presented here reject the possibility of raft-delimited PIP2 pools, but rather indicate that both receptors share a single homogenous pool of PIP2 at the plasma membrane. Our results are at variance with biochemical studies that show that PIP2 is enriched in detergent-insoluble fractions (Hope and Pike, 1996; Pike and Casey, 1996; Pike and Miller, 1998; Laux et al, 2000; Hilgemann et al, 2001; Klopfenstein et al, 2002; Yin and Janmey, 2003; Hur et al, 2004). It should be emphasized that there is an important distinction between the detection of PIP2 molecules by lipid extraction assays, on the one hand, and by ‘labeling' techniques (such as used in EM and FRET analysis), on the other hand. Labeling with either PIP2-specific antibodies or PH domains may fail to identify PIP2 that is already bound to (signaling) proteins, while these lipids are likely detected in extraction assays. Conversely, it is hard to envision how bound PIP2 molecules could function as messengers since they are not free to interact with the PIP2-binding domains of signaling proteins. However, the observation that treatment of intact cells with Triton X-100 by itself (even at doses as low as 0.0025%) can induce PIP2 clustering indicates that, at the least, care should be taken in interpreting the results of detergent extraction experiments.
Our experiments also cast serious doubt on the value of CD-mediated cholesterol extractions to prove involvement of rafts in biological processes. We showed that the CD-induced rapid abrogation of NKA-evoked PIP2 hydrolysis does not involve disruption of receptor or substrate clustering. Rather, the experiments suggest that CD interferes with agonist-independent tonic recycling by blocking receptor endocytosis, and perhaps also by rigidifying the plasma membrane. In support of this view, in a very recent paper (Cezanne et al, 2004), colocalization of the NK2r with clathrin-coated pre-pits was reported. In any case, the emerging, rather broad, Assortment of reported CD effects does not hamper the interpretation of the data here presented. It remains unchallenged that CD strongly disrupts lipid rafts, and thus its lack of effect on PIP2 clustering as determined by live cell FRET experiments can only be interpreted to indicate absence of PIP2 from rafts.
Materials and methods
Materials
Ionomycin and NKA were obtained from Calbiochem-Novabiochem Corp. (La Jolla, CA), and ET, CD and α-cyclodextrin were from Sigma Chemical Co. (St Louis, MO). Rhodamine-6G was from Molecular Probes (Eugene, OR) and Triton X-100 was from Merck (Darmstadt, Germany).
Constructs
eGFP-PH(PLCδ1), eCFP-PH(PLCδ1) and eYFP-PH(PLCδ1) in pcDNA3 vectors are as described (van der Wal et al, 2001). Expression vectors encoding the human NK2r (Alblas et al, 1995) and the human ETBr were kind gifts from Dr W Moolenaar, Division of Cellular Biochemistry. To tag the NK2r with GFP, the VSV tag of the NK2r in a pMT2-VSV vector (Alblas et al, 1995) was replaced by the cDNA for GFP using NotI and EcoRI restriction sites. The ETBr was tagged with GFP by cloning the cDNA for the ETBr (restriction sites HindIII and BamHI) and the cDNA for GFP (restriction sites BamHI and NotI) into pcDNA3. The NK2r was cloned N-terminally of the HA tag present in pcDNA3-HA, using HindIII and NotI. To obtain monomeric GFP-PH, the cDNA for GFP present in eGFP-PH(PLCδ1) (van der Wal et al, 2001) was exchanged by a cDNA encoding a GFP unable to dimerize (A206K; Zacharias et al, 2002). A second cDNA encoding the PH domain of PLCδ1 was cloned using EcoRI between the regions encoding GFP and the PH domain of monomeric GFP-PH to obtain the GFP-PH-PH. mRFP-PH was a kind gift from Dr Tamas Balla (National Institutes of Health, Bethesda), where the GFP cDNA of eGFP-PH (Varnai and Balla, 1998) was exchanged for a cDNA encoding the monomeric RFP (Campbell et al, 2002). To obtain mRFP-PH-PH, we cloned a second cDNA encoding the PH domain of PLCδ1 between the mRFP and PH domain cDNAs using BamHI.
Cell culture and transfection
HEK293 cells were seeded on 25-mm glass coverslips in six-well plates (for microscopy) or in a 15-cm Petri dish (for EM or biochemical assays) in DMEM supplemented with 10% FCS and antibiotics. Constructs were transfected using calcium phosphate precipitate, at ∼0.8 μg DNA per well or ∼13 μg DNA per Petri dish. After 12 h, the medium was refreshed.
Monitoring of PIP2 levels by FRET ratiometry
Kinetic analysis of PIP2 breakdown by FRET was assayed as described (van der Wal et al, 2001). In brief, cells transfected with CFP-PH and YFP-PH at 1:1 ratio were placed on an inverted Zeiss Axiovert 135 microscope equipped with a dry Achroplan × 63 (NA 0.75) objective. Excitation was at 425±5 nm, and CFP as well as YFP emission was collected simultaneously at 475±15 and 540±20 nm, respectively, using photomultipliers. For experiments with cells expressing GFP-PH-PH and mRFP-PH-PH, excitation was at 488±5 nm, and emission was collected at 535±25 and >590 nm, respectively. Both photomultiplier signals were filtered at 0.1 Hz and digitized at three samples per second. FRET is expressed as the ratio of acceptor to donor fluorescence. At the onset of the experiment, the ratio was adjusted to 1.0, and FRET changes were expressed as % deviations from base line. It has been previously documented (Stauffer et al, 1998; Varnai and Balla, 1998; van der Wal et al, 2001) that monitoring translocation of the PH domain of PLCδ1 by either confocal imaging or FRET ratiometry reliably records the activation of the PLC signaling cascade.
Confocal microscopy
Coverslips with cells expressing various constructs were mounted in a culture chamber imaged using an inverted TCS-SP2 confocal microscope (Leica, Mannheim, Germany). Cells were imaged in bicarbonate-buffered saline (containing in mM: 140 NaCl, 5 KCl, 1 MgCl2, 1 CaCl2, 23 NaHCO3, 10 glucose and 10 HEPES at pH 7.2) under 5% CO2 at 37°C.
Monitoring of receptor internalization
Cells expressing GFP-tagged receptors were imaged every 2–3 min on the confocal, and images were stored for off-line analysis. Membrane localization was expressed as the ratio of the membrane fluorescence to total cell fluorescence. To allow averaging of the results from separate experiments, the ratio was normalized at the onset of the experiment.
Cryoimmunogold electron microscopy
Transfected cells were fixed for 24 h in 4% paraformaldehyde in 0.1 M PHEM buffer (240 mM PIPES, 100 mM HEPES, 8 mM MgCl2, 40 mM EGTA, pH 6.9) and then processed for ultrathin cryosectioning as previously described (Calafat et al, 1997). Ultrathin frozen sections were incubated at room temperature with mouse monoclonal anti-HA 12CA5 (Boehringer) or rabbit anti-GFP (Clontech), followed by incubation with 10 nm protein A-conjugated colloidal gold (EM Lab., Utrecht University, The Netherlands) as described (Calafat et al, 1997). After immunolabeling, cryosections were embedded in a mixture of methylcellulose and uranyl acetate and examined with a Philips CM 10 electron microscope (Eindhoven, The Netherlands). For the controls, the primary antibody was replaced by a nonrelevant murine or rabbit antiserum.
Cluster analysis of immunogold-labeled EM images
For analysis of clustering, EM images of immunogold-labeled ultrathin cryosections were digitized and imported in PhotoShop 5.0. Quantitation was by Ripley's K analysis (Ripley, 1977, 1979; Philimonenko et al, 2000), adapted to one-dimensional data as follows. First, positions of the membrane and of individual gold particles were digitized manually. For each photomicrograph, the length of the membrane and total number of particles were determined, and the average density (λ) was calculated from that. Then, for each gold particle, the number (n) of neighbor particles within a given distance d was determined. We varied d between 1 and ∼1000 nm; as a boundary condition, when d extended beyond either end of the membrane, data were taken from the opposite end. From these data, we calculated N(d), the mean number of neighbors for each d:
![]()
For randomly distributed particles, the average expected number of neighbors for given d depends on the density:
![]()
To arrive at a concentration-independent parameter for clustering, the observed frequencies N(d) are first normalized with respect to density:
![]()
Similarly, in the random case, a density-independent estimate is given by
![]()
Subsequently, clustering is expressed by subtracting the expected distribution from the observed distribution:
![]()
The dimension of C(d) is distance (m). Note that for randomly distributed particles, C(d) equals 0 for all d.
Clustering was assessed by plotting C(d) as a function of d. The interpretation of these graphs is analogous to those of the linearly transformed two-dimensional Ripley's K analysis used by Prior et al (2003): clusters are apparent as deviations of C(d) from 0, with the position of the first maximum indicating the mean cluster size, and the first intersection of C(d) with the horizontal axis indicating half of the mean distance between clusters.
Fluorescence lifetime imaging
FLIM experiments were performed on an inverted Leica DM-IRE2 microscope equipped with Lambert Instruments (Leutingewolde, the Netherlands) frequency domain lifetime attachment, controlled by the vendors EZflim software. GFP was excited with ∼4 mW of 430 nm light from a LED modulated at 40 MHz and emission was collected at 490–550 nm using an intensified CCD camera. To calculate the GFP lifetime, the intensities from 12 phase-shifted images (modulation depth ∼70%) were fitted with a sinus function, and lifetimes were derived from the phase shift between excitation and emission. Lifetimes were referenced to a 1 μM solution of rhodamine-G6 in saline that was set at 4.11 ns lifetime. The measured lifetime of GFP alone was 2.4 ns, and the FRET efficiency E was calculated as
![]()
FRET efficiencies from large populations (80–150 cells per experiment) were measured before and after treatment with CD (10 mM) or Triton X-100. Differences in FRET were plotted against the corresponding concentration of the GFP-PH-PH probe, determined as described (van der Wal et al, 2001) from separately acquired images. Very similar results ensued when FRET was plotted against mRFP-PH-PH concentration. All experiments were repeated many times on different days; data from a single representative experiment are shown. The data set was statistically analyzed using MicroCal Origin V5.0.
Cholesterol assay
Cells grown in six-well plates were assayed in triplicate for cholesterol using the Amplex red cholesterol assay kit from Molecular Probes Inc. (Eugene, OR). First, cells were washed once with bicarbonate-buffered saline, followed by incubation with or without 10 mM CD, or with α-cyclodextrin. Subsequently, the saline was refreshed and cells were optionally incubated for different times, or assayed immediately according to the supplier's instructions.
Supplementary Material
Supplementary Information
Supplementary Movie
Supplementary Movie Legend
Acknowledgments
We thank Drs W Moolenaar (Department of Biochemistry) and T Balla (National Institutes of Health, Bethesda) for plasmids, and J van der Wal for preparing GFP fusion constructs. Drs A van der Luit and W Blitterswijk are acknowledged for help with lipid extraction assays and cholesterol determinations. We also thank members of the Department of Cell Biology and the Department of Biochemistry for discussions and critical comments on this manuscript. This work was supported by NWO grant 901-02-236, and by the Josephine Nefkens Foundation.
References
- Alblas J, van Etten I, Khanum A, Moolenaar WH (1995) C-terminal truncation of the neurokinin-2 receptor causes enhanced and sustained agonist-induced signalling. Role of receptor phosphorylation in signal attenuation. J Biol Chem 270: 8944–8951 [DOI] [PubMed] [Google Scholar]
- Basu SK, Goldstein JL, Anderson RG, Brown MS (1981) Monensin interrupts the recycling of low density lipoprotein receptors in human fibroblasts. Cell 24: 493–502 [DOI] [PubMed] [Google Scholar]
- Berridge MJ, Irvine RF (1984) Inositol trisphosphate, a novel second messenger in cellular signal transduction. Nature 312: 315–321 [DOI] [PubMed] [Google Scholar]
- Calafat J, Janssen H, Stahle-Backdahl M, Zuurbier AE, Knol EF, Egesten A (1997) Human monocytes and neutrophils store transforming growth factor-alpha in a subpopulation of cytoplasmic granules. Blood 90: 1255–1266 [PubMed] [Google Scholar]
- Campbell RE, Tour O, Palmer AE, Steinbach PA, Baird GS, Zacharias DA, Tsien RY (2002) A monomeric red fluorescent protein. Proc Natl Acad Sci USA 99: 7877–7882 [DOI] [PMC free article] [PubMed] [Google Scholar]
- Caroni P (2001) New EMBO members' review: actin cytoskeleton regulation through modulation of PI(4,5)P(2) rafts. EMBO J 20: 4332–4336 [DOI] [PMC free article] [PubMed] [Google Scholar]
- Cezanne L, Lecat S, Lagane B, Millot C, Vollmer JY, Matthes H, Galzi JL, Lopez A (2004) Dynamic confinement of NK2 receptors in the plasma membrane: improved FRAP analysis and biological relevance. J Biol Chem 279: 45057–45067 [DOI] [PubMed] [Google Scholar]
- Chamberlain LH (2004) Detergents as tools for the purification and classification of lipid rafts. FEBS Lett 559: 1–5 [DOI] [PubMed] [Google Scholar]
- Czech MP (2000) PIP2 and PIP3: complex roles at the cell surface. Cell 100: 603–606 [DOI] [PubMed] [Google Scholar]
- Dale LB, Bhattacharya M, Seachrist JL, Anborgh PH, Ferguson SS (2001) Agonist-stimulated and tonic internalization of metabotropic glutamate receptor 1a in human embryonic kidney 293 cells: agonist-stimulated endocytosis is beta-arrestin1 isoform-specific. Mol Pharmacol 60: 1243–1253 [DOI] [PubMed] [Google Scholar]
- Edidin M (2003) The state of lipid rafts: from model membranes to cells. Annu Rev Biophys Biomol Struct 32: 257–283 [DOI] [PubMed] [Google Scholar]
- Glebov OO, Nichols BJ (2004) Lipid raft proteins have a random distribution during localized activation of the T-cell receptor. Nat Cell Biol 6: 238–243 [DOI] [PubMed] [Google Scholar]
- Heerklotz H (2002) Triton promotes domain formation in lipid raft mixtures. Biophys J 83: 2693–2701 [DOI] [PMC free article] [PubMed] [Google Scholar]
- Hilgemann DW, Feng S, Nasuhoglu C (2001) The complex and intriguing lives of PIP2 with ion channels and transporters. Sci STKE 2001: RE19. [DOI] [PubMed] [Google Scholar]
- Hinchliffe KA, Ciruela A, Irvine RF (1998) PIPkins1, their substrates and their products: new functions for old enzymes. Biochim Biophys Acta 1436: 87–104 [DOI] [PubMed] [Google Scholar]
- Hope HR, Pike LJ (1996) Phosphoinositides and phosphoinositide-utilizing enzymes in detergent-insoluble lipid domains. Mol Biol Cell 7: 843–851 [DOI] [PMC free article] [PubMed] [Google Scholar]
- Hur EM, Park YS, Lee BD, Jang IH, Kim HS, Kim TD, Suh PG, Ryu SH, Kim KT (2004) Sensitization of epidermal growth factor-induced signaling by bradykinin is mediated by c-Src. Implications for a role of lipid microdomains. J Biol Chem 279: 5852–5860 [DOI] [PubMed] [Google Scholar]
- Janmey PA, Lindberg U (2004) Cytoskeletal regulation: rich in lipids. Nat Rev Mol Cell Biol 5: 658–666 [DOI] [PubMed] [Google Scholar]
- Kenworthy AK, Edidin M (1998) Distribution of a glycosylphosphatidylinositol-anchored protein at the apical surface of MDCK cells examined at a resolution of <100Å using imaging fluorescence resonance energy transfer. J Cell Biol 142: 69–84 [DOI] [PMC free article] [PubMed] [Google Scholar]
- Kenworthy AK, Petranova N, Edidin M (2000) High-resolution FRET microscopy of cholera toxin B-subunit and GPI-anchored proteins in cell plasma membranes. Mol Biol Cell 11: 1645–1655 [DOI] [PMC free article] [PubMed] [Google Scholar]
- Kittler JT, Thomas P, Tretter V, Bogdanov YD, Haucke V, Smart TG, Moss SJ (2004) Huntingtin-associated protein 1 regulates inhibitory synaptic transmission by modulating gamma-aminobutyric acid type A receptor membrane trafficking. Proc Natl Acad Sci USA 101: 12736–12741 [DOI] [PMC free article] [PubMed] [Google Scholar]
- Klopfenstein DR, Tomishige M, Stuurman N, Vale RD (2002) Role of phosphatidylinositol(4,5)bisphosphate organization in membrane transport by the Unc104 kinesin motor. Cell 109: 347–358 [DOI] [PMC free article] [PubMed] [Google Scholar]
- Koreh K, Monaco ME (1986) The relationship of hormone-sensitive and hormone-insensitive phosphatidylinositol to phosphatidylinositol 4,5-bisphosphate in the WRK-1 cell. J Biol Chem 261: 88–91 [PubMed] [Google Scholar]
- Laux T, Fukami K, Thelen M, Golub T, Frey D, Caroni P (2000) GAP43, MARCKS, and CAP23 modulate PI(4,5)P(2) at plasmalemmal rafts, and regulate cell cortex actin dynamics through a common mechanism. J Cell Biol 149: 1455–1472 [DOI] [PMC free article] [PubMed] [Google Scholar]
- Liu Y, Casey L, Pike LJ (1998) Compartmentalization of phosphatidylinositol 4,5-bisphosphate in low-density membrane domains in the absence of caveolin. Biochem Biophys Res Commun 245: 684–690 [DOI] [PubMed] [Google Scholar]
- Martin TF (2001) PI(4,5)P(2) regulation of surface membrane traffic. Curr Opin Cell Biol 13: 493–499 [DOI] [PubMed] [Google Scholar]
- Mayor S, Rothberg KG, Maxfield FR (1994) Sequestration of GPI-anchored proteins in caveolae triggered by cross-linking. Science 264: 1948–1951 [DOI] [PubMed] [Google Scholar]
- Munro S (2003) Lipid rafts: elusive or illusive? Cell 115: 377–388 [DOI] [PubMed] [Google Scholar]
- Ohvo-Rekila H, Ramstedt B, Leppimaki P, Slotte JP (2002) Cholesterol interactions with phospholipids in membranes. Prog Lipid Res 41: 66–97 [DOI] [PubMed] [Google Scholar]
- Philimonenko AA, Janacek J, Hozak P (2000) Statistical evaluation of colocalization patterns in immunogold labeling experiments. J Struct Biol 132: 201–210 [DOI] [PubMed] [Google Scholar]
- Pike LJ, Casey L (1996) Localization and turnover of phosphatidylinositol 4,5-bisphosphate in caveolin-enriched membrane domains. J Biol Chem 271: 26453–26456 [DOI] [PubMed] [Google Scholar]
- Pike LJ, Miller JM (1998) Cholesterol depletion delocalizes phosphatidylinositol bisphosphate and inhibits hormone-stimulated phosphatidylinositol turnover. J Biol Chem 273: 22298–22304 [DOI] [PubMed] [Google Scholar]
- Pizzo P, Giurisato E, Tassi M, Benedetti A, Pozzan T, Viola A (2002) Lipid rafts and T cell receptor signaling: a critical re-evaluation. Eur J Immunol 32: 3082–3091 [DOI] [PubMed] [Google Scholar]
- Prior IA, Muncke C, Parton RG, Hancock JF (2003) Direct visualization of Ras proteins in spatially distinct cell surface microdomains. J Cell Biol 160: 165–170 [DOI] [PMC free article] [PubMed] [Google Scholar]
- Rameh LE, Cantley LC (1999) The role of phosphoinositide 3-kinase lipid products in cell function. J Biol Chem 274: 8347–8350 [DOI] [PubMed] [Google Scholar]
- Ramstedt B, Slotte JP (2002) Membrane properties of sphingomyelins. FEBS Lett 531: 33–37 [DOI] [PubMed] [Google Scholar]
- Ripley BD (1977) Modelling spatial patterns. J R Statist Soc B 39: 172–192 [Google Scholar]
- Ripley BD (1979) Tests of randomness for spatial point patterns. J R Statist Soc B 41: 368–374 [Google Scholar]
- Rodal SK, Skretting G, Garred O, Vilhardt F, van Deurs B, Sandvig K (1999) Extraction of cholesterol with methyl-beta-cyclodextrin perturbs formation of clathrin-coated endocytic vesicles. Mol Biol Cell 10: 961–974 [DOI] [PMC free article] [PubMed] [Google Scholar]
- Simons K, Ikonen E (1997) Functional rafts in cell membranes. Nature 387: 569–572 [DOI] [PubMed] [Google Scholar]
- Simons K, Toomre D (2000) Lipid rafts and signal transduction. Nat Rev Mol Cell Biol 1: 31–39 [DOI] [PubMed] [Google Scholar]
- Simonsen A, Wurmser AE, Emr SD, Stenmark H (2001) The role of phosphoinositides in membrane transport. Curr Opin Cell Biol 13: 485–492 [DOI] [PubMed] [Google Scholar]
- Stauffer TP, Ahn S, Meyer T (1998) Receptor-induced transient reduction in plasma membrane PtdIns(4,5)P2 concentration monitored in living cells. Curr Biol 8: 343–346 [DOI] [PubMed] [Google Scholar]
- Subtil A, Gaidarov I, Kobylarz K, Lampson MA, Keen JH, McGraw TE (1999) Acute cholesterol depletion inhibits clathrin-coated pit budding. Proc Natl Acad Sci USA 96: 6775–6780 [DOI] [PMC free article] [PubMed] [Google Scholar]
- Theriault C, Rochdi MD, Parent JL (2004) Role of the Rab11-associated intracellular pool of receptors formed by constitutive endocytosis of the beta isoform of the thromboxane A2 receptor (TP beta). Biochemistry 43: 5600–5607 [DOI] [PubMed] [Google Scholar]
- van der Wal J, Habets R, Varnai P, Balla T, Jalink K (2001) Monitoring agonist-induced phospholipase C activation in live cells by fluorescence resonance energy transfer. J Biol Chem 276: 15337–15344 [DOI] [PubMed] [Google Scholar]
- van Rheenen J, Jalink K (2002) Agonist-induced PIP(2) hydrolysis inhibits cortical actin dynamics: regulation at a global but not at a micrometer scale. Mol Biol Cell 13: 3257–3267 [DOI] [PMC free article] [PubMed] [Google Scholar]
- Varnai P, Balla T (1998) Visualization of phosphoinositides that bind pleckstrin homology domains: calcium- and agonist-induced dynamic changes and relationship to myo-[3H]inositol-labeled phosphoinositide pools. J Cell Biol 143: 501–510 [DOI] [PMC free article] [PubMed] [Google Scholar]
- Vollmer JY, Alix P, Chollet A, Takeda K, Galzi JL (1999) Subcellular compartmentalization of activation and desensitization of responses mediated by NK2 neurokinin receptors. J Biol Chem 274: 37915–37922 [DOI] [PubMed] [Google Scholar]
- Watt SA, Kular G, Fleming IN, Downes CP, Lucocq JM (2002) Subcellular localization of phosphatidylinositol 4,5-bisphosphate using the pleckstrin homology domain of phospholipase C delta1. Biochem J 363: 657–666 [DOI] [PMC free article] [PubMed] [Google Scholar]
- Waugh MG, Lawson D, Tan SK, Hsuan JJ (1998) Phosphatidylinositol 4-phosphate synthesis in immunoisolated caveolae-like vesicles and low buoyant density non-caveolar membranes. J Biol Chem 273: 17115–17121 [DOI] [PubMed] [Google Scholar]
- Xia S, Kjaer S, Zheng K, Hu PS, Bai L, Jia JY, Rigler R, Pramanik A, Xu T, Hokfelt T, Xu ZQ (2004) Visualization of a functionally enhanced GFP-tagged galanin R2 receptor in PC12 cells: constitutive and ligand-induced internalization. Proc Natl Acad Sci USA 101: 15207–15212 [DOI] [PMC free article] [PubMed] [Google Scholar]
- Yin HL, Janmey PA (2003) Phosphoinositide regulation of the actin cytoskeleton. Annu Rev Physiol 65: 761–789 [DOI] [PubMed] [Google Scholar]
- Zacharias DA, Violin JD, Newton AC, Tsien RY (2002) Partitioning of lipid-modified monomeric GFPs into membrane microdomains of live cells. Science 296: 913–916 [DOI] [PubMed] [Google Scholar]
Associated Data
This section collects any data citations, data availability statements, or supplementary materials included in this article.
Supplementary Materials
Supplementary Information
Supplementary Movie
Supplementary Movie Legend