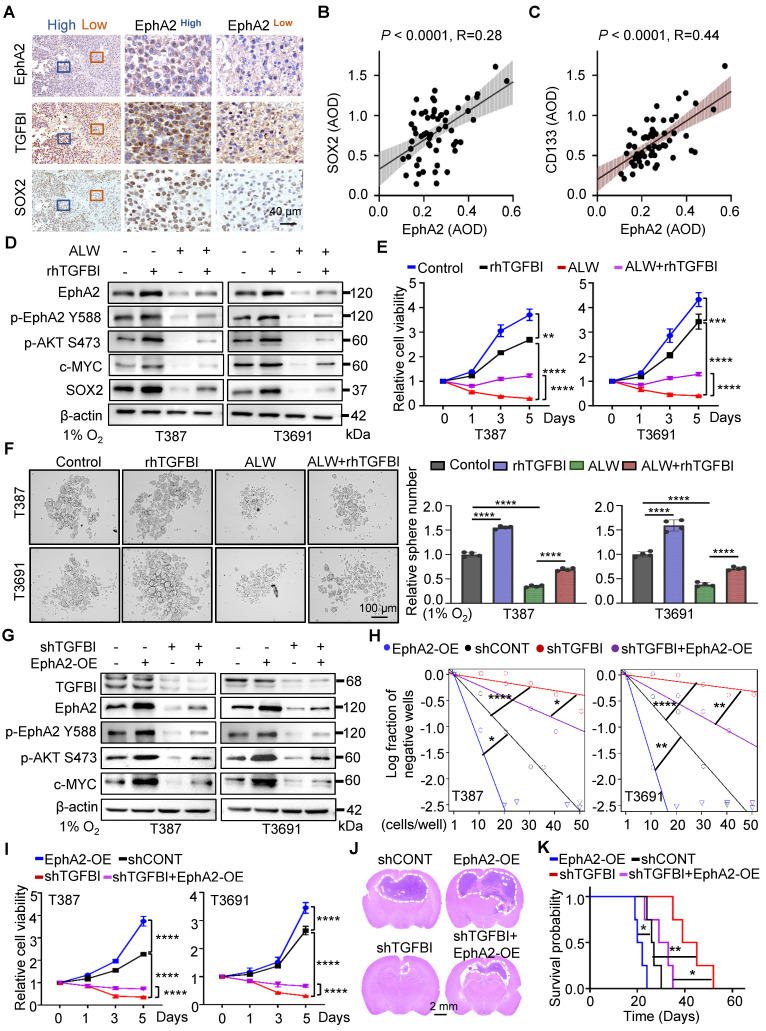
Figure 6.
The binding of TGFBI to EphA2 promotes self-renewal and tumorigenesis of GSCs both in vitro and in vivo. (A) IHC staining showing TGFBI, EphA2, and SOX2 expression in the same human high- and low-expression GBM tissues. Scale bars: 40 μm. (B) IHC staining demonstrating the association between EphA2 and SOX2 and (C) CD133proteins in human gliomas. n = 58 (D) IB of AKT-c-MYC pathway and stem-associated proteins in the indicated GSCs. ALW, ALW-Ⅱ-41-27, an EphA2 inhibitor; rhTGFBI, recombinant human TGFBI protein. (E) Cell titer assay result of indicated GSCs. n = 6 (F) Bright-field microscopy (left) showing the tumorsphere formation of indicated GSCs under hypoxia. The quantification of relative tumorsphere number is shown on the right. n = 4; Scale bars: 100 μm. (G) IB of AKT-c-MYC pathway proteins in the indicated GSCs. OE, overexpression (H) Limiting dilution assays of the indicated GSCs. (I) Cell titer assay results of indicated GSC (n = 6). (J) H&E staining of brain sections from mouse xenograft. Scale bars: 2 mm (K) Kaplan-Meier survival curve of mice bearing indicated GSCs. n = 5; Data are presented as the mean ± SD. *P < 0.05; **P < 0.01; ****P < 0.0001.

