

Summary
Zoonotic spillovers of viruses have occurred through the animal trade worldwide. The start of the COVID-19 pandemic was traced epidemiologically to the Huanan Seafood Wholesale Market. Here, we analyze environmental qPCR and sequencing data collected in the Huanan market in early 2020. We demonstrate that market-linked SARS-CoV-2 genetic diversity is consistent with market emergence, and find increased SARS-CoV-2 positivity near and within a wildlife stall. We identify wildlife DNA in all SARS-CoV-2 positive samples from this stall, including species such as civets, bamboo rats, and raccoon dogs, previously identified as possible intermediate hosts. We also detect animal viruses that infect raccoon dogs, civets, and bamboo rats. Combining metagenomic and phylogenetic approaches, we recover genotypes of market animals and compare them to those from farms and other markets. This analysis provides the genetic basis for a short-list of potential intermediate hosts of SARS-CoV-2 to prioritize for serological and viral sampling.
Graphical Abstract

In Brief
DNA of mammalian wildlife species susceptible to SARS-CoV-2 was detected along with SARS-CoV-2 and other viruses in environmental samples from animal stalls located at the market epicenter of the emergence of COVID-19.
Introduction
Many of the earliest known cases of COVID-19 worked at or visited the Huanan Seafood Wholesale Market (“Huanan market”) in the city of Wuhan, a link first made by clinicians at different hospitals throughout the city1–3. Retrospective review of early COVID-19 cases identified 174 patients with onset in December 2019, 32% of whom had an ascertained link to this location, within a city of over 12 million4. Although some of the early case finding could have preferentially identified market-linked cases, a geospatial analysis of residences of the early cases with no identified link to the Huanan market showed that they lived unexpectedly close to and centered around the market3,5, even though geographic proximity was not used as a case criterion4,6–8. Additionally, excess pneumonia deaths were first reported in the city districts surrounding the Huanan market4,6–8, and retrospective serosurveys of Wuhan confirmed that a larger proportion of residents contracted COVID-19 in these districts9,10.
The genomic epidemiology of SARS-CoV-2 shows that there were very few human infections before the earliest ascertained market case with onset on December 10th, 201911. The time of the most recent common ancestor (tMRCA) is estimated to be late November to early December 201912–17, and the estimated median timing of the primary infection mid- to late November11,18. A phylodynamic analysis of the epidemic’s size by December 1st, 2019 estimated it to be between 1–83 infections and 0–2 hospitalizations (95% highest posterior density intervals)11. These estimates are consistent with surveillance and retrospective testing that have found no evidence of substantial community transmission of COVID-19 prior to December 20194,19–22.
Early SARS-CoV-2 sequences belong to two lineages, denoted A and B, separated by two nucleotide substitutions (C8782T and T28144C). While the rooting of SARS-CoV-2 between these two haplotypes is uncertain11, the initial observation that SARS-CoV-2 genomes from cases with direct market contact were lineage B led to the proposal that the market was an amplification event that occurred after lineage A community transmission unrelated to the market23. The geographic proximity of two early lineage A cases to the market, however, later suggested that this lineage was also present2,3,24, and this was further confirmed when lineage A was identified in an environmental sample from the Huanan market25. The linkage of both lineages to the market is consistent with phylodynamic evidence of at least two successful zoonotic spillovers of SARS-CoV-2 into humans11. The high intensity of contact between humans and animals in markets26 suggests that once animals infected with a highly transmissible virus arrive in a market, multiple zoonotic events are primed to occur. This was, for example, later observed in a local 2021 COVID-19 outbreak initiated by multiple secondary spillovers from hamsters in a pet store in Hong Kong27.
In February 2020, China’s government enacted a far-reaching ban on the sale of wildlife for human consumption28. A similar decision had followed the second emergence of SARS-CoV-1 in winter 2003–200429; both were intended to limit the further spread of either virus within the animal trade. As with SARS-CoV-2, SARS-CoV-1 was first detected over 1,000 kilometers from its closest identified bat virus relatives in Yunnan province and was epidemiologically linked to the wildlife trade30. Months after declaring the SARS outbreak, closely related viruses were found in masked palm civets (Paguma larvata) and common raccoon dogs (Nyctereutes procyonoides) at still-open wet markets31, although animals from several markets and farms tested negative for SARS-CoV-129,32,33. Farmed civets in Hubei province also tested positive34, indicating the spread of SARS-CoV-1 among animals in the province where SARS-CoV-2 later emerged29.
Zoonotic spillovers in wildlife markets have long been known to present risks for viral emergence35. Cross-species transmissions of bat coronaviruses to mammals in the wildlife trade have also been documented among Malayan porcupines (Hystrix brachyura) and hoary bamboo rats (Rhizomys pruinosus)36. Coronaviruses have been reported in masked palm civets, raccoon dogs, and Amur hedgehogs (Erinaceus amurensis) in wildlife markets37, and while the closest relatives of SARS-CoV-2 to date are in bats38, other closely related viruses have been been found in illegally traded pangolins in Asia39–43. In rural Myanmar, individuals with wildlife exposure had disproportionately high seropositivity to SARS-CoV-2-like viruses, possibly indicating spillover to humans prior to the SARS-CoV-2 pandemic as well44.
The Huanan market was the location with the most wildlife vendors in Wuhan, a city of over 12 million people with four sustained live animal markets45. Several vendors were documented to be illegally selling live animals such as raccoon dogs, civets, bamboo rats (Rhizomys pruinosus and/or Rhizomys sinensis), Malayan porcupines, Amur hedgehogs, and Asian badgers (Meles leucurus) in late fall of 20193,45. Most wildlife vendors were located in the west wing of the market, which was also where the earliest and the majority of market COVID-19 cases worked3. In early 2020, Liu et al.25 collected environmental samples from the Huanan market. These samples were analyzed by SARS-CoV-2 reverse-transcription quantitative PCR (qPCR) and metatranscriptomic next-generation sequencing (mNGS)25. In addition to environmental sampling, Liu et al. performed qPCR testing of some mammalian wildlife at the market, but this was limited to live rats, stray weasels, cats, and dogs, as well as carcasses of one sheep, two wild boars, six bamboo rats, six badgers, six muntjacs, 16 hedgehogs, and 52 rabbits25, most of which are now known as unlikely to be intermediate hosts of SARS-CoV-2. Neither sampling nor qPCR testing of any of the raccoon dogs or civets on sale in the market have been reported, and no serology from any animals or their handlers in the market has been described. However, Liu et al. reported the genetic detection in environmental samples of several animal genera of potential interest25.
Here, we analyze the data from the market generated and shared by Liu et al.25, in the context of all early SARS-CoV-2 sequences using multiple genomic approaches. We first demonstrate that the most recent common ancestor (MRCA) of SARS-CoV-2 sampled within the Huanan market is genetically identical to the MRCA inferred from the pandemic as a whole. This finding is consistent with the emergence of SARS-CoV-2 within the Huanan market. We next characterize the genetic material from mammals present in market metatranscriptomes at the species level, generating a thorough record of their presence and distribution, including in samples and stalls with SARS-CoV-2. We further identify additional animal viruses, indicating that live mammals sold at the market were indeed shedding viruses there at the time of sampling. Finally, we reconstruct mitochondrial genotypes of putative intermediate hosts in the market for identification of subspecies and their putative geographic origins. Taken together, these analyses provide a precise picture of the genetic signature of wildlife mammals, their viruses, and SARS-CoV-2 present at the Huanan market as the COVID-19 pandemic began.
Results
SARS-CoV-2 genetic diversity linked to the Huanan market is consistent with market emergence
If the Huanan market was the site of origin of the transmission chains that led to the COVID-19 pandemic, then the common ancestor of market-associated viral genotypes should be equivalent to the common ancestor of the pandemic, given appropriate sampling. To test this hypothesis, we assessed intra-sample variation of the SARS-CoV-2 environmental genomes from the Huanan market, assigned market sequences to virus lineages, and performed phylodynamic inference to compare the genetic diversity of SARS-CoV-2 within the market to its genetic diversity globally. As detailed below, we found that the MRCA of market-associated genomes was equivalent to the MRCA of the larger pandemic (Figure 1A).
Figure 1: Phylogenetic analysis of SARS-CoV-2 from early COVID-19 cases and virus sequences obtained from the Huanan market.
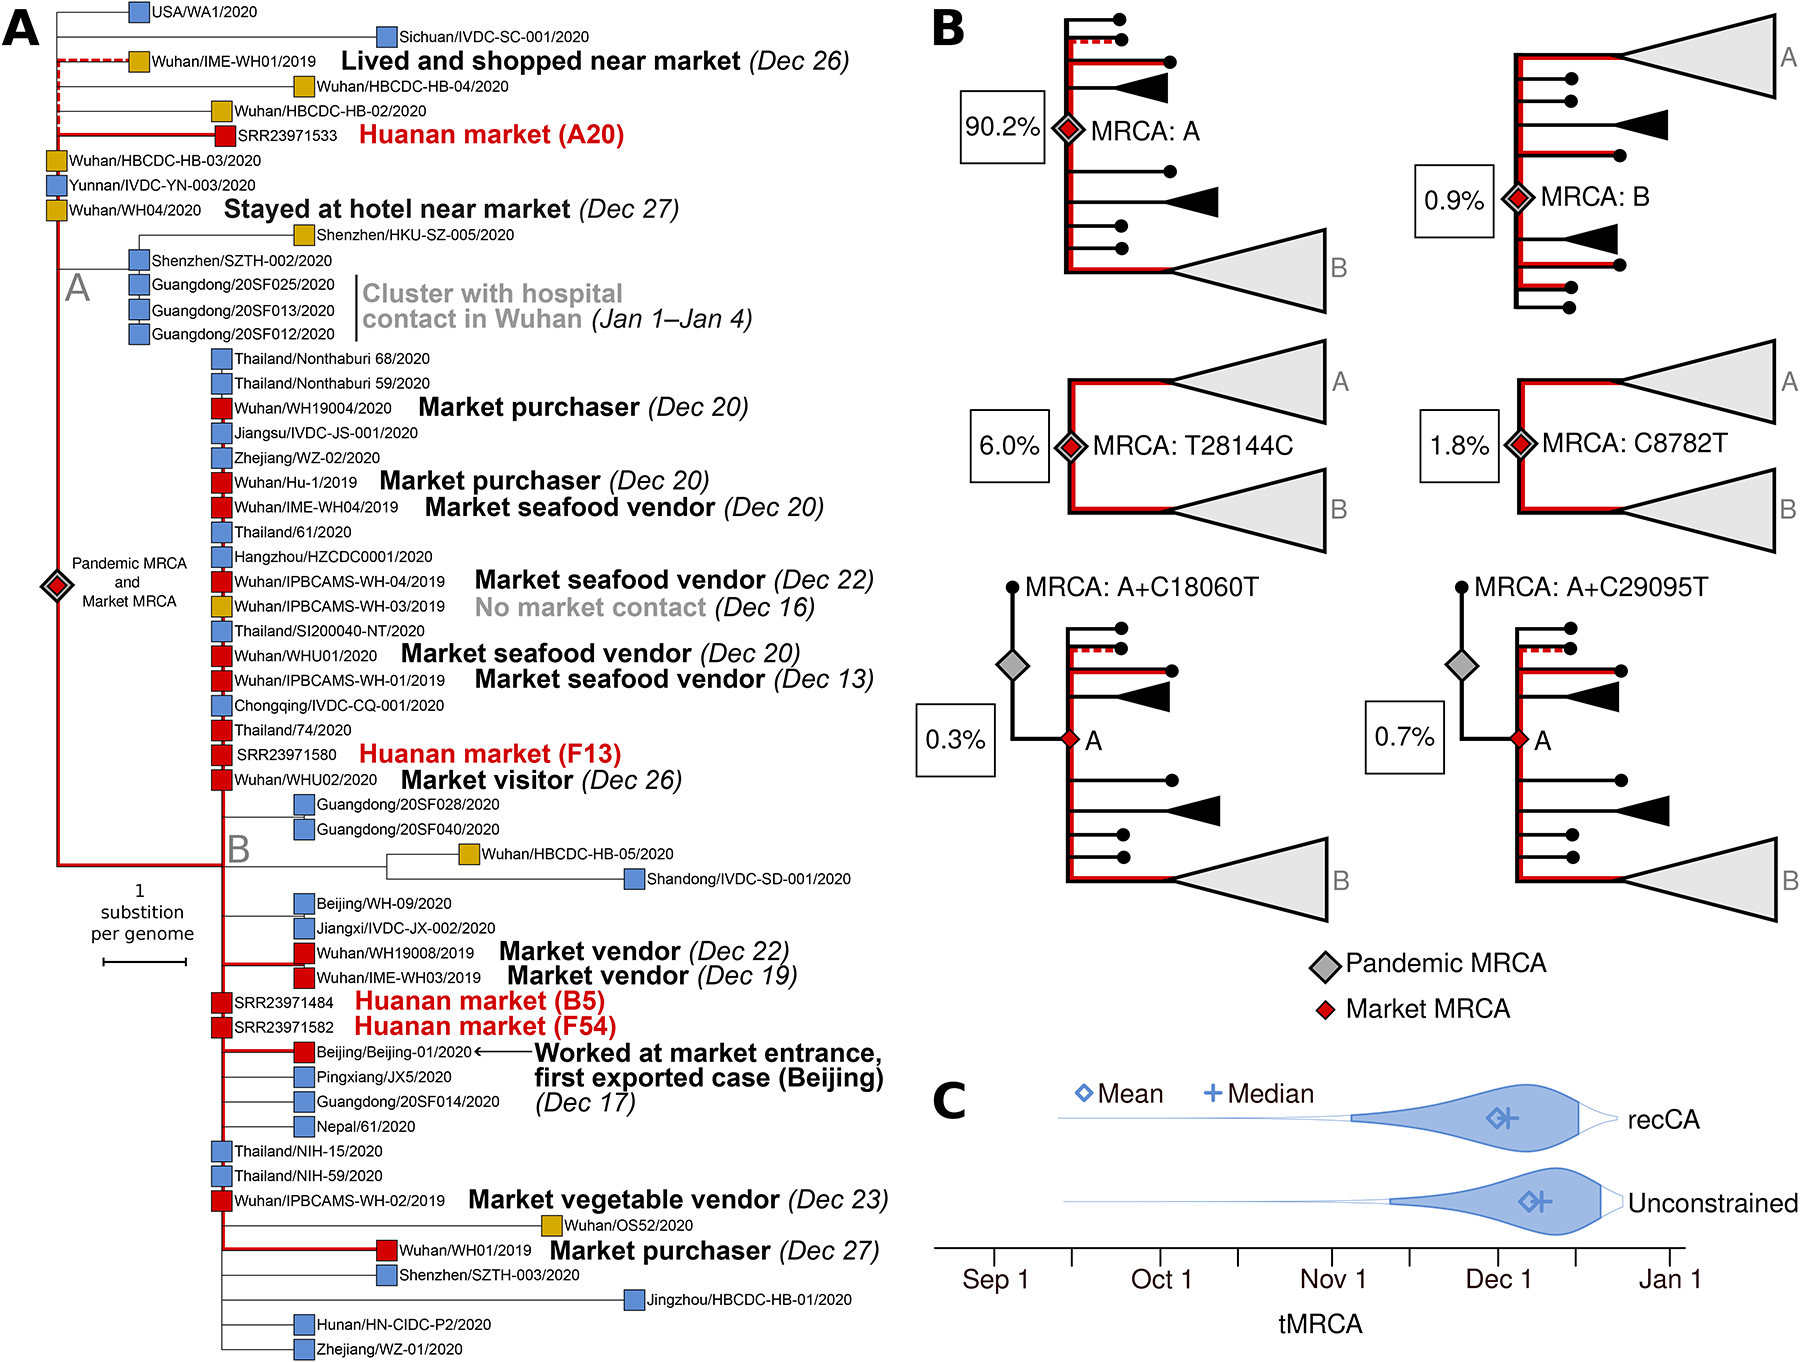
(A) Phylogenetic tree of SARS-CoV-2 viral genomes collected before Jan 20, 2020. Tip colors correspond to different samples (red: market environmental samples and directly linked cases; yellow: Wuhan cases, with those indirectly linked to the Huanan market labeled; blue: all global cases). Symptom onset dates for cases are shown when known. The branch leading to A20 is slightly longer than other sequences with two substitutions from the root due to its slightly greater proportion (2.2%) of undetermined nucleotides. (B) Schematic tree topologies and associated posterior probabilities of inferred ancestral haplotypes for the SARS-CoV-2 pandemic. The probability of the four most likely tree topologies are conceptually visualized along with two alternatively proposed topologies. Lineages are demarcated “A” and “B”, and the common ancestry of Huanan market linked viral sequences according to each topology is visualized in red. The probabilities shown on the panel correspond to the recCA-constrained analysis (see Methods and Table S1). (C) tMRCA distributions inferred for the global SARS-CoV-2 pandemic (constrained by recCA and unconstrained). The 95% highest posterior density interval of each distribution is highlighted.
Four near-complete SARS-CoV-2 genome sequences were recovered from environmental samples collected on January 1st 202025. The samples, labeled A20, B5, F13, and F54, were all collected in the west wing of the Huanan market, where most wildlife vendors were located4. We first confirmed that the sequence from sample A20 was indeed lineage A, whereas samples F54, F13, and B5 were lineage B, as previously reported25. The sampled reads strongly support the A or B consensus genotype at the lineage-defining sites, indicating that none of these sequences are a mixture of lineages A and B. The A20 consensus genome has an additional two substitutions, G26262T and C6145T, separating it from the lineage A root (Figure 1A), but with the 6145C reference allele present at 23% frequency, supporting the presence of a haplotype that was one private substitution diverged from the MRCA of lineage A (Table S1). While the exact timing of the shedding of virus present in this lineage A sample remains uncertain, a map shared during the “WHO-convened global study of origins of SARS-CoV-2: China Part” (hereafter “WHO mission”) noted a suspected case in the stall where it originated, with onset on or before December 15th (Figure S1)46. This case was not included on the final map provided in the WHO mission report, but the report recommended follow up mapping and review of potential early clinical cases4. One low-coverage sample (F46) has two duplicate reads covering the 8782 position and matching lineage A (C8782T), but this sample has no coverage at position 28144, the other lineage-defining position, so this sample could not be fully determined to be a second lineage A sequence sampled at the Huanan market (Table S1)25.
To compare the genetic diversity of SARS-CoV-2 sampled within the market to SARS-CoV-2 genetic diversity globally at the onset of the pandemic, we performed phylodynamic inference using BEAST11,47; see Methods) (Figure 1A). Using the sample collection date of 1st January 2020 for market environmental genomes, and by incorporating recently published genomes from COVID-19 cases from early 202048, we inferred the ancestral haplotype and time of the most recent common ancestor (tMRCA) of the SARS-CoV-2 pandemic (n=863 genomes collected by 14 February 2020; Table S1). We considered both unconstrained rooting, and rooting constrained by the inferred genome of a recombinant common ancestor (“recCA”)11. In both cases, these analyses strongly favored a most recent common ancestor (MRCA) of SARS-CoV-2 only as either the A or B haplotypes with no additional substitutions, or an intermediate between the two, as did previously published results (Figure 1B; Table S1)11,49. The alternatively proposed A+C18060T and A+C29095T23 haplotypes were strongly rejected as being ancestral, including when rooting with the inferred recombinant common ancestor (Figure 1B; Table S1). The MRCA of market-linked genomes on all four plausible tree topologies was therefore concordant with the common ancestor of the entire pandemic (Figure 1B). We inferred a median tMRCA of Dec 09, 2019 (95% highest posterity density (HPD): Nov 11–Dec 20) for the SARS-CoV-2 pandemic with unconstrained rooting, and of Dec 03 (95% HPD: Nov 04–Dec 16) with recCA-constrained rooting (Figure 1C), consistent with prior analyses11.
That the MRCA of SARS-CoV-2 linked to the Huanan market is equivalent to the MRCA of the pandemic establishes that the timing of the origin of the market outbreak is genetically indistinguishable from the timing of the origin of the pandemic as a whole. The presence of both lineages A and B at the market, and the spatial association of early lineage A cases with the market2,3, were results directly predicted under the hypothesis that SARS-CoV-2 first emerged in the human population at the Huanan market.
Increased SARS-CoV-2 positivity rate in and near a wildlife stall in the Huanan market
The Huanan market was sampled on multiple dates at the start of 2020, with different sampling trips having different purposes25. On January 1st, the market was sampled widely with an emphasis on stalls associated with human cases: 515 samples were tested, 27 were SARS-CoV-2 qPCR-positive, and mNGS sequencing results for 25 of these positive samples were shared. On January 12th, 10 samples per stall were taken from seven wildlife stalls: three were positive by qPCR for SARS-CoV-2, and this time all 70 samples (including negatives) were sequenced. Additional samples were collected from drains, sewage, stalls and warehouses after these two first dates until March 2020 (Table S2).
To determine whether SARS-CoV-2 positivity was associated with specific stalls in the Huanan market, we conducted a spatial relative risk analysis of SARS-CoV-2 qPCR-positive samples collected on January 1st and 12th, comparing the distribution of the qPCR-positive to qPCR-negative samples. The rate of qPCR-positivity was unevenly distributed within the Huanan market, with increased positivity in the southwest section (Figure 2A). Several clustered stalls in this section had a higher positivity rate than the average stall sampled in the market (Figure S1–S2). One stall, wildlife stall A, stood out with a 30% qPCR-positive rate (three of its ten samples collected on January 12th): a cart, a hair/feather removal machine, and a sample collected from the ground were qPCR-positive for SARS-CoV-2. Six of the 70 January 12th sequenced samples contained SARS-CoV-2 mNGS sequence reads, which included the three qPCR-positive samples from wildlife stall A, two qPCR-negative samples also from wildlife stall A, and one sample from the interior of a freezer in nearby wildlife stall B (Table S2; Figure 2B). Therefore, both qPCR testing and mNGS both identify SARS-CoV-2 RNA in and around wildlife stall A (Figure 2A, 2B). Although SARS-CoV-2 read counts are low, this is consistent with precedent for untargeted environmental sequencing of SARS-CoV-2, in which viral RNA can be nearly undetectable even in PCR-positive samples where the overwhelming majority of sequences are microbial50,51.
Figure 2: The spatial distribution of SARS-CoV-2 in the Huanan market and animal DNA/RNA in SARS-CoV-2 positive samples from wildlife stall A.

(A) Proportion of positive SARS-CoV-2 qPCR samples, across all stalls sampled on January 1st and 12th 2020. For A–C, the heatmaps represent the p-value surface distributions of a relative risk analysis, showing areas of significantly elevated positive test density. (B) Metatranscriptomic sequencing (mNGS)-based testing for SARS-CoV-2 in samples collected on January 12th 2020. (C) SARS-CoV-2 qPCR testing of water drains tested throughout the market. Arrows indicate the direction of reported drainage flows25. (D–H) Proportion of SARS-CoV-2 sequence reads and mammalian mtDNA reads in samples that tested positive for SARS-CoV-2 from one wildlife stall, relative to total mammalian mtDNA reads. The number after each bar is the raw number of reads. Only mammalian species reported in at least two samples or with greater than 300 total reads are shown.
Later sampling provided further support for wildlife stall A as a SARS-CoV-2 hotspot within the Huanan market. Of 60 samples from the underfloor drainage system of the Huanan market that were collected on January 27th and 29th, only four were SARS-CoV-2 qPCR-positive, including the drain directly in front of wildlife stall A (Figure 2C). Seventeen more drain samples were collected February 9th and 15th, with three testing qPCR-positive: one of these was again in front of wildlife stall A and the other two were from downstream locations that may have received runoff from this same stall (Figure 2C). Taken together, there are three independent spatial signals that identify SARS-CoV-2 positivity associated with a specific wildlife stall (A) in a section of the market with markedly higher environmental SARS-CoV-2 positivity.
The nearby wildlife stall B was also repeatedly resampled after January 12th and tested qPCR-positive multiple times (Table S2; Figure S2). In February, the offsite warehouse associated with this stall was sampled, and 5 of 12 samples tested positive for SARS-CoV-2 by qPCR (Table S2). Of the 16 samples collected from wildlife stall B on January 1st and 12th, SARS-CoV-2 was detected only by mNGS in the January 12th freezer sample, indicating lower positivity than wildlife stall A.
Outside of these wildlife stalls, several of the other SARS-CoV-2-positive stalls sampled on January 1st were associated with the known human cases in the market (Figure S1). These samples most likely reflect human shedding of SARS-CoV-2 in these other locations throughout the market, which was a site of ample human-to-human transmission3. As time of sampling progressed after the market’s closure, there was a noticeable decrease in SARS-CoV-2 viral abundance, indicating environmental viral RNA decay throughout the market over several weeks (Figure S2). As most wildlife stall samples were collected 11 days after the first sampling, a reduced capacity to detect SARS-CoV-2 in wildlife stall samples on January 12th would then be expected due to ongoing decay of viral RNA in the environment.
Mammalian wildlife species detected in five SARS-CoV-2 positive samples from a wildlife stall
Environmental samples with viral RNA can also contain genetic evidence of the mammalian hosts that shed that virus. We developed and benchmarked a highly specific metagenomic pipeline for quantifying the abundance of animal mitochondrial DNA (mtDNA) in environmental samples by stringently mapping reads to a dereplicated database of eukaryotic mitochondrial genomes and filtering hits by their breadth of coverage (Figure S3; see Methods). The five SARS-CoV-2-positive samples from wildlife stall A contained mtDNA from raccoon dogs, hoary bamboo rats, dogs (Canis lupus familiaris), and European rabbits (Oryctolagus cuniculus). Amur hedgehog and Malayan porcupine mtDNA was present in four samples, Reeves’s muntjac (Muntiacus reevesi) and Himalayan marmot (Marmota himalayana) mtDNA was found in three, and one sample contained masked palm civet mtDNA (Figure 2D–H; Table S2). Of these species, raccoon dogs, rabbits, and dogs are documented as susceptible to SARS-CoV-252–54, with raccoon dogs experimentally confirmed as capable of transmission52 and in vitro evidence of civet susceptibility55,56. Nearby to stall A, other SARS-CoV-2-positive samples also contained wildlife mtDNA, including a garbage cart where raccoon dog mtDNA was detected and a stall with bamboo rat mtDNA (Figure S2; Table S2). While all five positive samples from stall A contained human mtDNA, humans were not the most abundant mammalian species present in any of these samples (Figure 2D–H). Excluding the mitochondrial 16S and 12S rRNA regions which could be differentially impacted by any potential rRNA depletion performed on these samples did not change these results (Table S2; Figure S3).
Further, our results show that wildlife mtDNA detection was colocalized with the reported locations of wildlife stalls (Figure 3A, 3C–E; Table S2). In contrast, human mtDNA was distributed throughout the market, consistent with the market being a general place of human activity (Figure 3B). Genetic material from raccoon dogs and hoary bamboo rats was frequently found across the wildlife stalls, constituting the two most commonly detected mammalian wildlife species (Figure 3A, C–E). Genetic material from Masked palm civets was more rarely detected, being present in five samples from four stalls. Some wildlife species, such as nutria (Myocastor coypus), red foxes (Vulpes vulpes) and Arctic foxes (Vulpes lagopus) were detected only in samples and stalls that tested negative for SARS-CoV-2. To confirm species identification, we generated de novo contig assemblies and performed BLAST against a custom WGS database (Table S2) made from available genome assemblies of species known to be at Huanan market45. The BLAST results identified human and wildlife species consistent with those described above (Table S2).
Figure 3: The spatial distribution of animal DNA/RNA in the Huanan market.

(A) Sequence read counts of the mammalian species with mtDNA detected in at least three samples across all wildlife stall samples sequenced on January 12th (all located in the western part of the market). Samples are grouped by wildlife stall, horizontally ordered by detection of SARS-CoV-2 (red: positive by qPCR and sequencing; orange: positive by sequencing only; blue: negative), and species are those we detected whose genus was reported as sold live in Wuhan markets by Xiao et al.45, vertically ordered by abundance. The locations of the A–G wildlife stalls are provided in Table S2. (B–E) Spatial distribution of the mean proportions of mtDNA reads across sequenced samples collected in the market on January 1st and 12th for (B) humans (H. sapiens), (C) raccoon dogs (N. procyonoides), (D) hoary bamboo rat (R. pruinosus), (E) masked palm civet (P. larvata).
Of the eighteen species reported by Xiao et. al.45 to be present in the four Wuhan city markets they surveyed, we confirmed genetic signatures of eleven at the species level at the Huanan market and an additional two at the genus level (Figure 3A and Table S2); Siberian weasel (Mustela sibirica) was rare in the market, and was absent from any of the January 12th wildlife stall samples. We did not detect mtDNA sequence reads from American mink (Neogale vison), red squirrel (Sciurus vulgaris), Pallas’ squirrel (Callosciurus erythraeus), complex-toothed flying squirrel (Trogopterus xanthipes) nor Asian badger in any of the environmental samples. Notably, none of these, except Asian badgers, were observed at the Huanan market specifically in November 20193. Additionally, while Xiao et al.45 reported sales of Chinese bamboo rat (R. sinensis), we identified abundant mtDNA from the hoary bamboo rat (R. pruinosus) with only one sample containing trace amounts of R. sinensis mtDNA (Table S2). This discrepancy is likely due to the species having been identified by Xiao et. al.45 visually based on physical morphology, without genetic confirmation.
We found no evidence for the presence of any bat or pangolin genetic material, the two known hosts of sarbecovirus relatives of SARS-CoV-2, in the Huanan market. In contrast, the presence of mtDNA of Myotis bats was previously reported25. To check this, we replicated the methodology of Liu et al.25 by mapping reads to the Barcode of Life Data System COX1 gene database, which identified eight reads that mapped to any Myotis sequence with no mismatches. A BLAST analysis confirmed that all were non-specific matches and therefore uninformative. This indicates that neither live bats nor pangolins are likely to have been present in the sampled stalls of the Huanan market during the time period relevant to the emergence of SARS-CoV-2.
Prior studies calculated correlations of SARS-CoV-2 and animal sequence read abundances in market samples, concluding that SARS-CoV-2 was negatively correlated with mammalian wildlife species25,57. Such approaches are limited because metagenomic sequencing counts are relative (compositional)58 and further subject to temporal trends, spatial trends, and extraction biases that can all confound correlational interpretations in environmental samples59–61. These approaches are also challenged by the consideration that animal viral shedding would precede human viral shedding in a zoonotic scenario, and that most wildlife stalls were sampled 11 days after stalls with suspected human COVID-19 cases25. As a result, environmental SARS-CoV-2 RNA from non-human hosts could have had more time to decay than SARS-CoV-2 RNA from human infections. In addition, SARS-CoV-2 detected in non-wildlife stalls was very likely shed by humans, rendering univariate correlations including these samples inappropriate. In terms of experimental design, the overall sampling scheme of the market sampling was also imbalanced62. All wildlife stall samples from January 12th were sequenced regardless of their qPCR positivity, while other sequenced samples were predominantly qPCR positive and from elsewhere in the market (Table S2). Therefore, species present in wildlife stalls are disproportionately overrepresented in the sequence-negative set, and this sampling design will cause wildlife species to artifactually appear negatively correlated with SARS-CoV-2 (Figure S4).
As all wildlife stall samples collected on January 12th had been sequenced regardless of their SARS-CoV-2 positivity, we conducted a correlational analysis of relative species abundances in these samples (n=70) as this could represent a balanced dataset for informing which host had shed the virus detected therein. Across these wildlife stall samples, there was no significant correlation between human mtDNA and SARS-CoV-2 RNA (ρ=0.13; 95% confidence interval [CI] [−0.09,0.34]), similar to the average mammal (ρ=0.08; 95% CI [−0.12,0.29]) (Figure S4). Sequence read abundances of Malayan porcupine (ρ=0.45; P<0.001, false discovery rate (FDR)=5%) and Himalayan marmot were significantly correlated with SARS-CoV-2 after multiple hypothesis correction (ρ=0.34; P<0.033, FDR=5%) (Figure S4; Table S2), reflecting their increased detection in wildlife stall A. However, temporal trends and compositional effects in metagenomic sequencing data also influence correlations, further challenging their interpretation61. As previously described63, a correlational analysis would be unlikely to provide reliable insights into whether any particular species was or was not infected by SARS-CoV-2 within the market.
Wildlife stalls and SARS-CoV-2 positive samples contain other mammalian viruses associated with the animal trade
The presence of animal viruses with predictable host ranges can provide evidence of animals productively infected with viruses in the Huanan market at the end of 2019. By mapping sequencing reads to a custom database of human and animal viruses with stringent filtering, we identified several mammalian viruses present in the market (Table S3). Human-specific viruses were rare, even at a threshold of one read per sample. We found human coronavirus 229E in one stall and human respiratory syncytial virus (subgroup B) in another. Other detectable human viruses were dsDNA viruses such as human polyomavirus 6, human papillomaviruses, and human herpesviruses (Table S3).
We also detected several other mammalian viruses within the market (Table S3). In SARS-CoV-2 positive wildlife stalls, we identified close relatives of viruses reported to infect the wildlife species also detected in these samples (Figure S5). Of these viruses, close relatives of a raccoon dog amdoparvovirus, a bamboo rat betacoronavirus, and a civet kobuvirus were sufficiently abundant to reconstruct mostly complete genome sequences from samples across the market via a mapping-consensus approach. All three viruses were predominantly found in wildlife stalls with mNGS evidence of their putative hosts, and in some cases they were identified in samples from nearby locations as well (Figure 4A–C).
Figure 4: Animal viruses in the Huanan market.

(A–C) The spatial distribution of detection of three wildlife viruses detected in the Huanan market in sequenced samples collected in the market on January 1st and 12th. Bubbles correspond to stalls, and the bubble color represents the mean proportion of reads mapping to the viral genome from samples in that stall. The heatmaps represent the p-values of relative risk analyses, showing spatial distribution of enriched positivity for each virus. (D–F) Maximum likelihood whole genome phylogenies of the market consensus sequence for each of the three viruses shown in (A–C). Each reference virus is colored by the species it was reported as isolated from.
We inferred maximum likelihood whole genome phylogenetic trees incorporating these viruses and their known relatives with IQ-TREE 264 under a GTR+F+G4 substitution model (Figure 4D–F; see Methods for details). In each case, the virus present in the market was most closely related to reported viruses shed by a singular host species, indicating a predictable host specificity. The two closest relatives of the civet kobuvirus we detected were from sequences identified in samples from market animals from Sichuan and Guangxi provinces, and the bamboo rat betacoronavirus was a close and recent relative of a virus identified in bamboo rats on a Guangxi farm in 201965. These findings suggest some movement of infected animals from southern China to Wuhan, a trade conduit that could have also led to the emergence of SARS-CoV-2. This result is also consistent with reports that Huanan market vendors sourced bamboo rats from Guangxi and Yunnan provinces4. Movement of animal viruses such as these via the wildlife trade recapitulates the likely dispersal of SARS-CoV-1 from Yunnan to Guangdong and Hubei provinces29.
Additional viruses found at the market included polyomaviruses, hedgehog coronavirus HKU31, and skunk adenovirus PB1 (which has a broad host range) (Table S3). Further, we identified canine coronaviruses closely related to viruses sampled from dogs66, farmed and captured raccoon dogs37,67, and farmed red foxes68; these viruses may be expected to infect multiple canine species present in the market (Table S3). All eight genome segments of influenza A virus subtype H9N2 were detected together in a sample from one SARS-CoV-2 negative wildlife stall, and with sparse detection (<10 reads) in two other samples from the same stall and two samples from adjacent wildlife stalls (Table S3). Manual inspection of the reads identified the presence of the G57-like internal gene cassette, the predominant H9N2 genotype in China, also shared with zoonotic H7N9 viruses from China69. Read mapping to HA genes identified two different HA lineages, G1 (Eastern sublineage) and Y280/BJ94, mixed in the same sample, as well as the presence of an N2 NA gene, indicating the presence of two H9N2 lineages colocalized in the market (Table S3; see Methods). Phylogenetic analysis of the HA gene indicated that the G1 virus was most closely related to sequences collected in Guangdong in 2018 (EPI_ISL_17958293 and EPI_ISL_285577)70. Spillover of avian H9N2 had been reported in civets in another recent survey of market animals in China37. Human zoonotic cases of H9N2 have occurred71; hence, SARS-CoV-2 was not the only virus with zoonotic potential present in the Huanan market at the end of 2019. These results further add to the evidence for the presence of live animals at the market, and establish it as a place where potential wildlife hosts of SARS-CoV-2 were actively shedding other viruses.
Reconstruction of mitochondrial genotypes of potential intermediate host species of SARS-CoV-2 within the Huanan market
Genotypic differences within species can be valuable for identification of the subspecies and the geographic origin of individual animals present at the Huanan market. To facilitate subspecies identification and ascertainment of the likely geographic origin of animals in the Huanan market, we reconstructed mtDNA consensus genomes from wildlife stall samples. We used a reference-guided mapping approach to obtain partial to near-complete mitochondrial consensus genomes of several mammalian wildlife species. We obtained 33 consensus mitochondrial haplotypes from separate swabs that were >50% complete for seven abundant wildlife species: raccoon dog, masked palm civet, hoary bamboo rat, Amur hedgehog, Malayan porcupine, greater hog badger (Arctonyx collaris), and the Himalayan marmot (Figure 5A; Table S2). Ten of these mitochondrial genomes were >90% complete. We further identified the consensus single nucleotide variants (SNVs) for these genomes and found that on average they diverged 0.57% from the reference genome for each species (minimum: 0.16%, maximum: 2.1%).
Figure 5: Mitochondrial phylogenetics of potential intermediate host species of SARS-CoV-2 in the Huanan market.

(A) Coverage of wildlife mitochondrial genomes in Huanan market samples. Covered bases are colored, and consensus SNPs from the reference genome for each species are shown as black lines. (B) Cytochrome B (cytB) phylogeny of raccoon dog reference sequences collected from mainland Asia. (C) Heatmap of raccoon dog cytB SNVs found in the Huanan market samples and samples collected from other markets to the north of Hubei province. The color of each square represents the read mapping frequency of that allele in the sample. White squares indicate no read coverage at the site. SNVs are grouped by the branch of the reference tree they fall on, corresponding to the colors from (B). Samples from the wildlife stall positive for SARS-CoV-2 (stall A) are in bold.
To investigate the geographic origins of the raccoon dogs in the Huanan market within the context of the animal trade, we analyzed their mtDNA genotypes. In Asia, the raccoon dog’s current range extends from Vietnam to Russia72 and four subspecies are recognized: (a) N. p. procyonoides, found throughout China; (b) N. p. koreensis in the Korean peninsula, (c) N. p. orestes found in southern China and Vietnam; and (d) N. p. ussuriensis, a subspecies found in northeastern China and Russia and farmed in large numbers in this region for its thick fur29,73. Given the natural range of the closest known bat sarbecovirus relatives of SARS-CoV-2 in southern China, northern Laos, and Vietnam38,56,74, raccoon dogs from northern China would be an unlikely conduit for SARS-CoV-2 into Wuhan.
We performed phylogenetic inference on the mitochondrial cytB gene, as reference genes have been reported for wild raccoon dogs in Hubei province (2020)67 and Vietnam (2013)72, and multiple raccoon dog subpopulations can be distinguished using the cytB gene (Figure 5B). Because market environmental samples can contain DNA shed by unrelated but cohoused animals of the same species, we used a metagenomic single nucleotide variant (SNV)-based approach instead of relying solely on the consensus genomes. To compare animals in the Huanan market to those from other markets, we identified SNVs for mitochondrial genomes from an independent set of samples of pooled raccoon dog samples collected from markets in five cities to the north of Hubei province during 202037. Notably, raccoon dog samples from the other markets to the north of Hubei province were characterized by the presence of SNVs on two branches to N. p. ussuriensis and N. p. procyonoides sampled on fur farms75 and in the wild in northern China and Russia (Figure 5C; Figure S6). These SNVs were absent from the Huanan market; instead, SNVs from two genetically distinct raccoon dog populations sampled in 2020 and collected in the wild in Hubei in 202067 were present (Figure 5C). SNVs associated with two raccoon dog haplotypes collected in Vietnam in 2013 were absent from all samples. This suggests that the detected raccoon dogs in the Huanan market in late 2019 were not N. p. ussuriensis, and were from at least two populations, both genetically distinct from those raised on fur farms or sold in markets in cities in northern China. It is unknown how far south the wild and farmed range of the subpopulations detected here extends due to a lack of genetic data for N. procyonoides on the farms found in central or southern China. These data are consistent with a geographic origin of the raccoon dogs in the Huanan market in central or southern China, from which a viral transmission chain within the animal trade could have arisen after a spillover from a bat reservoir south of Wuhan.
Discussion
Extensive epidemiological evidence supports wildlife trade at the Huanan market as the most likely conduit for the COVID-19 pandemic’s origin3,76. Herein, we both describe metagenomic evidence for identification of the plausible intermediate host species at the market, and analyze metagenomic and phylogenetic evidence that further supports the hypothesis of zoonotic emergence at this location. While the species identity of an intermediate host between the likely Rhinolophus spp. (horseshoe bat) reservoir of SARS-CoV-2-like coronaviruses and humans remains unknown, our analysis informs this open question by determining the mammalian species present in the market with species and subspecies resolution. These results show that multiple plausible intermediate hosts of SARS-CoV-2 were present at the exact site within Wuhan to which COVID-19 was first epidemiologically linked. It is not possible to conclude which of these species may have been infected and/or introduced the virus to the market from these data alone. Nonetheless, our analysis provides a short and actionable list of species with genotypic details. Of the wildlife species detected in SARS-CoV-2 positive environmental samples, four have previously been implicated in bat coronavirus cross-species transmission through the animal trade: raccoon dogs, masked palm civets, hoary bamboo rats, and Malayan porcupines31,36.
Among the potential intermediate hosts present in the Huanan market, raccoon dogs are known to be susceptible to SARS-CoV-2, to shed high titers of virus, and to be able to transmit52. The common raccoon dog was the most abundantly detected animal species in market wildlife stalls sampled on January 12th, and in the wildlife stall with the most SARS-CoV-2 positive samples (Figure 3A; Table S2). The majority of civet mtDNA detectable in the market was from wildlife stall A, and while the susceptibility of civets is unknown, Paguma larvata cell lines are susceptible in vitro55,56. The susceptibility of bamboo rats, Malayan porcupines, and Amur hedgehogs remains unknown, and these species should be prioritized for susceptibility testing. Of the other species in the market, marmots may be an unlikely conduit for SARS-CoV-2 considering that their usual range is at very high elevations77, and while muntjac deer are closely related to cervids susceptible to SARS-CoV-278, the species has a truncated ACE2 gene without a signal peptide sequence that may suggest a lack of susceptibility (GenBank accession: CM035268.1:13062700-13095995). The siberian weasels79,80, foxes81, and greater hog badgers82 detected in the market are closely related to species known to be susceptible to SARS-CoV-2, but these species were very rare or absent in SARS-CoV-2 positive samples and stalls. Other market mammals are known to be susceptible to SARS-CoV-2 but do not represent a significant transmission risk, including dogs, rabbits, and boar, as infected animals do not produce or shed virus at high titers53,54,83,84.
Multiple lines of evidence are consistent with the infection of wildlife animals with SARS-CoV-2 in the Huanan market. Animal carts, a cage, a garbage cart, and a hair/feather removal machine from a wildlife stall tested positive for SARS-CoV-2, and there was more DNA from mammalian wildlife species in these samples than human DNA. The surrounding stalls also had relatively higher rates of SARS-CoV-2 positivity, and drains adjacent to and downstream of this wildlife stall tested positive for SARS-CoV-2. Finally, there were several other viruses known to infect wildlife in these samples. These data indicate either that the animals present at this stall shed the SARS-CoV-2 detected on the animal equipment, or that early unreported human case(s) of COVID-19 shed virus in the exact same location as the detected animals. Under a zoonotic scenario, viral shedding by infected animal handlers is expected to occur after shedding by the animals they were infected by. Therefore human viral shedding post-zoonosis could plausibly also explain these data; in such a case, the animals brought into the stall are therefore still the most likely candidates for the zoonotic source. While either animal or human viral shedding is consistent with these data, only a zoonotic origin of SARS-CoV-2 directly predicts co-detection of SARS-CoV-2 and wildlife genetic material.
It has been proposed that humans could have introduced the virus into the Huanan market57,25. It is most likely that there were human infections of SARS-CoV-2 earlier than the first documented and hospitalized market cases, including unascertained market cases or contacts thereof. However, the detection of lineage B and lineage A both within and indirectly (geographically) linked to the Huanan market implies that SARS-CoV-2 most likely emerged there or its supply chain before the tMRCA, by which time there would have been an estimated median of just three people infected (95% HPD, 1 to 18)11. Any hypothesis of COVID-19’s emergence has to explain how the virus arrived at one of only four documented live wildlife markets in a city of Wuhan’s size at a time when so few humans were infected3. Human introductions linked to the animal trade offer one explanation for this, and the introduction of the virus by an animal trader or farmer cannot be excluded, but these hypotheses are challenged by phylodynamic evidence for multiple spillovers11. The introduction by an animal trader infected by animals upstream of the market is further challenged by the probability that transmission chains dependent upon a single human would likely go extinct17, while a sustained interface between infected animals and humans in a market is more likely to result in the establishment of an epidemic.
The detection of SARS-CoV-2 RNA in the Huanan market in January 2020 could plausibly reflect deposition several weeks before sampling, compatible with estimated dates of the first human infections. SARS-CoV-2 RNA has been detected on indoor surfaces for prolonged periods up to several weeks85–87, and the temporal signal of viral RNA and animal mtDNA decay in the Huanan market samples themselves offers further support for these timescales (Figure S2, Figure S7). While the earliest zoonotic events of SARS-CoV-2 most likely occurred in late November 201911, infected cohoused animals could be expected to shed virus for weeks longer. SARS-CoV-2 genetic material detected in the Huanan market may be remnant from either animal or human sources during any time in that period, and this could vary both within and among samples because of differing environmental conditions and/or decay rates of various nucleic acids.
Focused genetic and serological sampling of raccoon dogs and the other mammalian species reported here throughout Southeast Asia and southern China can shed light on the animal trade networks that may have led to the emergence of SARS-CoV-2, as previously recommended4. Serological testing of the oldest animals (for instance the breeding stock) in source farms might provide additional information of transient circulation, as has been observed in mink farms infected with SARS-CoV-288. Future studies to clarify the susceptibility status of all of these species using in vitro approaches and live-animal infection experiments, should also be prioritized. The limited viral and serological sampling of these species in Southeast Asia and southern China67,89 indicates that the wildlife trade directly before the COVID-19 pandemic is highly undersampled, or underreported. Retrospective studies should be performed, where possible, testing the species described here throughout the animal supply chains of Southeast Asia and southern China, through which in all scientific likelihood the COVID-19 pandemic emerged.
Limitations of the study
Because the environmental metagenomic data used in this work cannot directly link viruses to their hosts in samples that contain DNA or RNA from multiple plausible host species (including humans), our analysis cannot conclusively identify which species may have shed SARS-CoV-2 in different samples from the Huanan market. Similarly, the exact timing of when viral or host genetic material were shed in the market environment can not be directly estimated. The samples sequenced from wildlife stalls analyzed here were sampled 11 days after several other stalls in the market, and SARS-CoV-2 sequencing read counts were low in both qPCR-positive and qPCR-negative samples from these stalls. The amount of degradation that occurred between deposition and sampling affects the relative abundances of genetic material from different species, and cannot be quantified. In addition, metagenomic sequence abundances are influenced by extraction biases specific to the species, virus, and type of genetic material, and by the technical specificity and sensitivity of different computational approaches. It is also challenging to distinguish very closely related animal species or subspecies without reference sequences, particularly in samples with very low coverage of the target. Finally, the publicly available genomic and epidemiological data from the start of the COVID-19 pandemic remain incomplete, and future data from this time could shed further light on hypotheses regarding its emergence90.
STAR Methods
Resource Availability
Lead contact
Requests for resources and further information may be directed to the lead contact, Florence Débarre (florence.debarre@sorbonne-universite.fr)
Materials availability
This study did not generate new unique reagents, but processed data generated for this study can be found in the supplementary files, and reconstructed genomes and phylogenies can be found at the GitHub repository associated with this work: https://zenodo.org/records/12571327 (Zenodo DOI: 10.5281/zenodo.12571327). https://github.com/sars-cov-2-origins/huanan-market-environment
Data and code availability
This paper analyzes existing, publicly available data, primarily from BioProjects PRJNA948658, PRJNA793740 and PRJNA795267, and NCBI accessions OR240356–OR240723 and OR251846–OR251847. Accession numbers for the datasets are listed in the key resources table and in Tables S1–S3.
All original code, along with genome FASTA files, BAM files, and intermediate data files are available at a GitHub repository associated with this work hosted on Zenodo: Zenodo DOI: 10.5281/zenodo.12571327.
Any additional information required to reanalyze the data reported in this paper is available from the lead contact upon request.
Key Resources Table
Experimental model and study participant details
The sources of bioinformatic data analyzed in this study are available in the key resources table.
Method Details
Sample preprocessing.
184 sequencing runs from the NCBI BioProject PRJNA948658 were downloaded and quality trimmed using BBDuk using the settings: ktrim=rl k=17 qtrim=r trimq=10 maq=10 minlen=30 entropy=0.5 threads=60 ref=./all_adapters.fa. A FASTA file of adapters which included BGI adapters was passed for trimming.
SARS-CoV-2 mapping.
Reads were mapped to the SARS-CoV-2 reference genome (NC_045512.2) using Bowtie291 and default settings. Mapped reads were filtered to those with at least 97% identity to the reference, a minimum mapping quality score of 20, a minimum alignment length of 95%, and reads mapping at least 200 bp away from the contig edge, and counted using a custom Python script (count_reads_sars2.py). For paired read samples, a mapped read pair was counted as a single observation.
SARS-CoV-2 phylogenetics.
ViralConsensus v0.0.392 was run to generate consensus genomes and examine SNVs for the samples with the settings: --min_qual 20, --min_depth 10, --min_freq 0.5, --ambig N. The iVar pipeline93 was run to generate consensus genomes and examine SNVs for the A20 sample, as this sample was generated with an amplicon-based approach. 15 bp were trimmed from the 5’ and 3’ ends of reads and a minimum depth of coverage of 15x was required. We augmented the data set of SARS-CoV-2 genomes from Pekar et al. 202211 (those collected by Feb 14, 2020) using the four reconstructed SARS-CoV-2 genomes from the environmental samples and 74 SARS-CoV-2 genomes from Lv et al. 202448, using only the earliest sampled genome with <5% ambiguous nucleotides from each patient. In all cases, the dates used in the analyses are the reported sample collection dates. Molecular clock phylodynamic inference was conducted using a Bayesian approach in BEAST v1.10.5 following the same protocol as in Pekar et al.11. We employed a non-reversible, random-effects substitution model, a strict molecular clock, and a non-parametric skygrid prior with 20 regular grid points and the last point at 0.37, which translates to 5 October 2019.
We performed an unconstrained analysis using 863 SARS-CoV-2 genomes representing the early global diversity of SARS-CoV-2, and the same analysis constrained using the recombinant common ancestor (recCA)11, in a manner similar to an outgroup (See Pekar et al.11 for further details on this approach; the recCA sequence was identical to the one from Pekar et al.11). We performed ancestral state reconstruction of the MRCA of all the SARS-CoV-2 genomes. For the unconstrained analysis, we ran four independent chains of 500 million generations, sub-sampling every 50 thousand iterations to continuous parameter log files and 200 thousand iterations for the ancestral state reconstruction of the MRCA. For the recCA-constrained analysis, we ran four independent chains of 500 million generations, sub-sampling every 50 thousand iterations to continuous parameter log files and 200 thousand iterations for the ancestral state reconstruction of the MRCA. The first 10% of each chain was discarded as burn-in. After removing burnin and combining the four chains, there were 9004 posterior samples for the ancestral state reconstruction. Convergence and mixing was assessed in Tracer v1.7.1, and the multiple chains for analyses were separately combined in LogCombiner. All relevant effective sample size (ESS) values were >150 for the final log file for each analysis. The accession IDs for all genomes used can be found in Table S1.
Mitochondrial mapping and benchmarking.
We developed a custom approach for quantifying animal DNA in environmental samples by mapping reads to mitochondrial genomes and filtering results based on read identity, read mapping quality (a measure of mapping uniqueness), and most crucially, breadth of coverage, made available at the GitHub repository for this work (10.5281/zenodo.12571327). Conceptually, this pipeline achieves very high specificity because multiple sequencing reads mapping evenly across a target genome (breadth of coverage) is a specific signal of true detection in a metagenome.
In this analysis, we primarily analyze mitochondrial DNA for the following reasons: (i) Several species only have mtDNA genomes reported; (ii) Unlike chromosomal genomes, mammalian mitochondrial genomes are of a consistent length (~16 Kb), contain fewer repetitive elements than nuclear DNA, are typically assembled in a complete contig, and can be quickly dereplicated and screened for erroneous sequences; and (iii) Mitochondrial genomes and genes (e.g., CytB) are known for high quality phylogenetic signal for distinguishing between species94.
For the mapping quantification pipeline, all eukaryotic mitochondrial genomes were downloaded from NCBI’s RefSeq and GenBank databases to build a custom mapping mitochondrial database. GenBank sequences with “partial”, “gene”, “genome assembly”, and “chromosome” in the description and those smaller than 12 Kb were removed. Genomes were clustered by Mash95 distances, first at 98% identity, preferentially selecting RefSeq genomes as cluster representatives. Reads were mapped with Bowtie2 to the 98% identity genome index and mapped reads with >=95% identity, MAPQ>=20, and mapping lengths>=40 were retained using a custom pipeline implemented in Python (count_reads98.py). For paired read samples, a mapped read pair was counted as a single observation. Next, a second round of reference genome clustering at 93% identity was performed, preferentially selecting the cluster representative as the genome with the highest sum of covered bases across all market samples. Reads were mapped again with Bowtie2 to this ‘93% clustered genome index’ and counted using a custom Python script (count_reads93.py) and similar cutoffs as described above. The resulting hits were filtered to Metazoa and assigned taxonomy with the Taxoniq package. To assess the potential differential impact of rRNA depletion on different species, we queried the mitochondrial genomic positions of the 16S and 12S rRNAs for all mammalian species observed in the market. A custom Python script (count_reads93_rRNAs.py) was used to count mapped reads filtered in the same way as above, except also excluding all reads that overlapped with the genomic positions of the 16S or 12S for each mitochondrial genome.
We benchmarked the sensitivity and specificity of this pipeline using in silico mock metagenomes. One hundred mock metagenomes were simulated, each with 1 million 43 bp reads, composed of 20 mammalian mitochondrial genomes, 40 eukaryotic mitochondrial genomes, and 20 random bacterial genomes, distributed at log-normal coverages, using InSilicoSeq96. Less than one percent of reads per metagenome were mammalian, simulating the dominance of microbial DNA in many environmental samples. To simulate intra-species divergence from reference genomes, all 60 mitochondrial genomes were randomly mutated by 1%, 3%, and 5% divergence in another 100 simulations each respectively. Specificity and sensitivity at the species level were then calculated for our approach, and plotted as a function of breadth of coverage (Figure S3). False positives disappeared as breadth of coverage increased, and for the breadth cutoff used in this study, a mean 100.0% specificity and 91.0% sensitivity were observed in the benchmark. Further benchmarking results are made available at the GitHub repository for this work (10.5281/zenodo.12571327).
Mapping and analysis of environmental samples.
We enhanced the market geospatial map from Worobey et al.3 using data on environmental samples taken from the market25, including both SARS-CoV-2 positive and negative samples. We could precisely locate 783 of the 819 samples from inside the Huanan market. The resulting sample locations and associated metadata were integrated with reported qPCR results and the results of our mNGS mapping for downstream analyses. Samples were grouped by stall to calculate the fraction of positive samples or the average proportion of reads associated with the species of interest. Overground and city drainage paths were plotted in accordance with published drainage maps25.
Viral mapping and assembly.
A viral database of all viruses deposited in the RefSeq database was created and supplemented with viral genomes from two recently published studies37,65 that reported viruses from wildlife animals. This set of genomes was clustered by Mash distances at >95% nucleotide identity. Low-complexity regions of these viruses were detected using dustmasker 1.0.0 with default settings. Reads from each sample were mapped to this dereplicated viral database using Bowtie2. The resulting mappings were filtered with a custom Python script (count_reads_viral.py) that counted reads and/or read pairs and covered bases of each viral genome with the following filters: mapping quality >30, read alignment length >95%, read percent identity to the reference >97%, and base pairs mapping to within 200 bp of the contig edges, or to low-complexity regions, were ignored. Only viral genomes with a breadth of coverage of at least 500 genomic nucleotides in at least one market sample were retained.
To assemble consensus genomes for the raccoon dog amdovirus, bamboo rat coronavirus, and civet kobuvirus, we used a reference-guided co-assembly approach due to low sequencing coverages of viruses in the data using a custom Python script (get_viral_consensus.py). Reads from all samples with at least 500 bp of genomic breadth of coverage of the most closely related reference genome were pooled, and the consensus genotype of all mapped reads at each genomic position was used to infer the consensus genomes. Reference positions with genotype ties or no mapped reads were filled with ‘N’. To identify Influenza H9N2 partial genomic fragments, we first noticed reads mapped to multiple Influenza A genome fragments in sample SRR23971532. Because our viral read mapping based approach does not distinguish closely related segmented virus subtypes, we reconstructed the partial consensus sequences for these segments from the sample and performed a BLAST against the NR database. The PB2 sequences, for which we had the best coverage, were more closely related to H9N2 sequences; other fragments matched H9N2 and H7N9 equally well (as these viruses share the same internal gene cassettes). However, reads mapping to the HA protein had BLASTN 100% identity to the H9N2 HA gene, confirming the placement of these sequences as H9N2. Reads were then mapped to contemporary G1 Eastern and Y280 HA sequences to generate consensus sequences for each lineage, and neighbor joining trees were created with EpiFlu references in Geneious Prime (Biomatters). The codetection of genome segments in the same sample greatly increased confidence in this call. Viral sequences, alignments, and phylogenetic trees are shared on the GitHub repository for this work (10.5281/zenodo.12571327).
Viral phylogenetics.
We collated viral genome sequences from Genbank (299 amdoparvovirus, 283 kobuvirus) and aligned them with the Huanan Market sequences using MAFFT v.7.49098 with default parameters. For amdoviruses we proceeded with phylogenetic inference using the full genome alignment, but downsampled to the RdRp-encoding region of the kobuvirus RNA genome. We inferred a maximum likelihood tree with IQ-TREE 2 v2.0.764, using a GTR+F+G4 model with 1000 bootstrap replicates. The trees were midpoint rooted.
We aligned the Huanan Market bamboo rat coronavirus sequence with 54 Embecovirus full genomes from NCBI using MAFFT v.7.490 with default parameters. Because the market sequence is fragmented, we removed all regions from the alignment where it consisted of Ns, leaving a concatenated alignment of 29,468 nucleotides. We used this alignment to infer a maximum likelihood tree with IQ-TREE 2 using a GTR+F+G4 model with 1000 bootstrap replicates. We midpoint rooted the tree for analysis and visualization.
Mitochondrial genotype reconstruction.
A reference-guided mapping based approach was used to reconstruct mitochondrial consensus genomes from each sample. Reads were mapped to the eukaryotic mitochondrial database as described above, and for mammalian wildlife species, the consensus base at each position was used to infer the consensus genome with a custom Python script (mt_consensus_genomes.py), filling in all reference positions without coverage with ‘N’. Mitochondrial genomes are shared via the GitHub repository for this work (10.5281/zenodo.12571327). Animal silhouettes in the figures are provided by the Phylopic R package102.
Cytochrome B phylogenetics.
We collected 44 published raccoon dog mitochondrial sequences and aligned them to the reference (NC_013700.1) using MAFFT (options --auto --keeplength --addfragments). Raw sequencing reads from 38 additional raccoon dog samples collected on a farm in Heilongjiang province were mapped to the reference and their mitochondrial genotypes were reconstructed via the reference-guided mapping approach described above, and cytB genes were extracted75. As most of these were only of the cytochrome B (cytB) gene, we performed phylogenetic inference using only the cytochrome B gene. We removed two genomes with haplotypes identical to other genomes from Kim et al. (2013) and then inferred a maximum likelihood tree with IQ-TREE 2 v.2.0.7. using a generalized time reversible model with four gamma rates (GTR+G4). The tree was midpoint-rooted, and we then used TreeTime v0.8.199 to perform ancestral sequence reconstruction. Trees were visualized using baltic 0.2.2 (https://github.com/evogytis/baltic).
We inferred a maximum likelihood tree using the entire mitochondrial genomes (genomes where only the cytochrome B gene was available were padded with Ns) with IQ-TREE 2. The tree was midpoint-rooted, and then we used TreeTime to perform ancestral sequence reconstruction. The inferred sequence for the most recent common ancestor (MRCA) of the non-Japanese clade of raccoon dog genomes (Fig. 5b) was used as a reference genome for subsequent analyses. Using pysam 0.21.0, we calculated the major allele frequency, minor allele frequency, allele frequency matching the reconstructed MRCA sequence, and allele frequency matching the inferred cytochrome B substitutions relative to the reconstructed MRCA sequence (Fig. 5b). We created heatmaps with the latter mutation allele frequencies using Seaborn 0.12.2.
Transcriptomics assembly and BLAST.
The de novo transcriptomic assemblies for 180 adapter cleaned samples were generated using rnaSPADES (v3.15.5)100,101. The resulting assembled transcripts were searched using BLASTN (v 2.14.0+)100 against the NCBI non-redundant nucleotide database (last update; 29th May 2023) downloaded on 1 June 2023 https://ftp.ncbi.nlm.nih.gov/blast/db/) using BLASTN (v 2.14.0+). The specific parameters used are: -outfmt ‘6 qseqid sseqid pident evalue score bitscore length qstart qend sstart send stitle’ -max_target_seqs 2. The output files were filtered to exclude hits with alignment length of less than 100. BLAST (v2.14.0+.) searches were also performed against the in-house database of genome sequences assemblies from 108 animal species (Table S2). The genome assemblies were downloaded from the NCBI genome database. The BLASTN search parameters used are: -outfmt ‘6 qseqid sseqid pident evalue score bitscore length qstart qend sstart send stitle’ -max_target_seqs 2. The output files were filtered to exclude hits with alignment length of less than 300 bp and <99.5% nucleotide identity to the reference.
Quantification and statistical analysis
Spatial relative risk analyses of environmental samples.
As in Worobey et al.3, spatial relative risk analyses were performed for SARS-CoV-2 and other key viruses using the “sparr” package available in R97, with linear boundary kernels for edge correction and bandwidth selection using least-squares cross validation. For analyses including market drains, we used a wider market boundary that included the drain sites outside of the market building. We studied variation in the relative risk quantity r(z)=f(z)/g(z) at each position z, where f(z) is the test distribution and g(z) is the control distribution, and tested the null hypothesis H0: r(z) = 1, against the alternative hypothesis of increased relative risk, H1: r(z) > 1. We then plotted an asymptotic p-value approximation P(z), a pointwise estimate of statistical significance.
Correlational analyses.
Spearman’s rank correlation coefficients and p-values were calculated using the scipy package between animal species abundances (mitochondrial mapping results) and SARS-CoV-2 mapped read counts, both normalized to total number of reads per sample after preprocessing. Reported conclusions were robust against normalization methods (total reads, mapped reads, or no normalization). Species were included in analysis if they were identified in three or more samples. Reported correlation coefficients and 95% CI were estimated by bootstrapping with 1000 permutations. P-values for statistical significance of correlations of mammalian species and SARS-CoV-2 in wildlife stall data were corrected for multiple hypotheses using the Benjamini/Hochberg procedure implemented in the statsmodel package.
Supplementary Material
Figure S1: Map of environmental samples and reported human cases from the Huanan market, Related to Figure 2.
Figure S2: Overview of the SARS-CoV-2 positive samples and the animal mtDNA detection in SARS-CoV-2 positive samples, Related to Figure 2.
(A) SARS-CoV-2 stall positivity for samples collected Jan 1–12. (B) Mammalian wildlife mtDNA abundances in SARS-CoV-2 positive samples in and nearby wildlife stall A and wildlife stall B. (C) SARS-CoV-2 qPCR Ct values by date of sampling. *: Ct values were not recorded by Liu et al. for the January 12th samples (3 were positive by qPCR). Two Ct values are available for the February 20th sample. Data from Liu et al. Supplementary Table 2.
Figure S3: Methodological benchmarking of mtDNA detection, Related to Figure 3.
(A) Specificity and specificity of in silico benchmarking of the mitochondrial mapping approach used in this study. (B) Abundances of mitochondrial DNA from humans and key wildlife species in samples from Wildlife Stall A with and without including mitochondrial rRNA regions.
Figure S4: Spearman correlations between animal species abundances and SARS-CoV-2 reads in different sample sets, Related to Figure 3.
The estimated Spearman correlation coefficient and its 95% CI are shown for species detected in 3 or more samples collected on January 1st, January 12th, or either date. Highlighted points have uncorrected p-values below 0.05.
Figure S5: Viral abundances within 5 SARS-CoV-2 positive samples from a wildlife stall, Related to Figure 4.
Figure S6: Phylogenetic tree of all raccoon dog cytochrome B sequences in this study, Related to Figure 5.
Sequences are labeled by the locale of the sample origin. Study codes for the 38 raccoon dog individuals sequenced by Lam et al. are used for these sequences without accession numbers (H1-H38).
Figure S7: Sequencing read abundances for the common raccoon dog (Nyctereutes procyonoides) and masked palm civet (Paguma larvata) in wildlife stall A by date of sampling, Related to Figure 2.
Table S1. SARS-CoV-2 genomic data, Related to Figure 1.
A20 SNVs tab: iVar SNVs of sample SRR23971533 (A20). Low-coverage reads tab: Mapping read coordinates of low-coverage SARS-CoV-2 samples in this study. Dec SARS-CoV-2 cases tab: Known early sequenced SARS-CoV-2 cases from December 2019. Early SARS-CoV-2 genomes tab: All early SARS-CoV-2 genomes collected prior to Feb 14, 2020 used in this study. Rooting probabilities tab: Inferred ancestral rooting probabilities of SARS-CoV-2. GISAID acknowledgements tab: GISAID accession numbers of genomes used in this study.
Table S2. Environmental sampling, SARS-CoV-2 positivity, and animal metagenomic data, Related to Figure 2 and Figure 3.
Sample metadata tab: All sample metadata, adapted and extended from (W. J. Liu et al. 2023). Sequencing metadata tab: All sample metadata for sequencing data from BioProject PRJNA948658. SARS-CoV-2 read counts tab: SARS-CoV-2 sequence read counts from each sample. Animal scientific names tab: Scientific and common names of animals referred to in this study. Mammals in SARS-CoV-2 samples tab: Mammalian mtDNA detection in SARS-CoV-2 positive samples. Mammalian mtDNA read counts tab:: Mammalian mtDNA sequence read counts in each sample. Mammalian mtDNA coverage tab: Mammalian mtDNA genome breadth of coverage. Animal mtDNA read counts tab: All animal mtDNA sequence read counts. Animal mtDNA coverage tab: All animal mtDNA genome breadth of coverage. Mammalian counts without rRNA tab: Mammalian mtDNA sequence read counts excluding rRNA regions. BLAST WGS database tab: BLAST WGS database built for transcriptome contig taxonomic assignment. Contig BLAST hits tab: Closest BLAST hits of contigs in SARS-CoV-2 positive samples from wildlife stall A. Comparison to observed tab: Comparison of mammals observed at the Huanan market to mammals detected in environmental sequencing data. Correlations tab: Correlations between SARS-CoV-2 and mammalian mtDNA sequence read abundances. Mitochondrial genomes tab: Statistics of mammalian mtDNA consensus genotypes reconstructed in this study.
Table S3. Viral metagenomic data, Related to Figure 4.
Virus abundances tab: Sequence read abundances and genome coverage of viruses detected in this study. Influenza sequences tab: Sequencing reads mapping to Influenza H9N2.
Highlights.
Common ancestor of SARS-CoV-2 linked to Huanan market matches the global common ancestor
Wildlife mitochondrial DNA identified in samples from stalls positive for SARS-CoV-2
DNA from raccoon dogs, civets, and other wildlife species detected in market samples
Genotypes of potential hosts were reconstructed for retracing animal geographic origins
Acknowledgements
We gratefully acknowledge all data contributors for generating the data on which our analyses are based. The Huanan market sequence data were generated by Liu et al.25 and shared via NCBI BioProject PRJNA948658. We have also analyzed data in this work from BioProject PRJNA793740 and PRJNA795267, and NCBI accessions OR240356-OR240723 and OR251846-OR251847. Figure 1 includes genomes from data shared on GISAID (Table S1), and we gratefully acknowledge the authors from the originating laboratories and the submitting laboratories, who generated and shared through GISAID the viral genomic sequences and metadata on which this research is based103. We gratefully acknowledge comments from Stuart Neil and Ben Pierce on the text.
This project has been funded in part with federal funds from the National Institute of Allergy and Infectious Diseases, National Institutes of Health (NIH), Department of Health and Human Services (contract no. 75N93021C00015 to M.W.). This work was partially supported through US National Institutes Health grants U19 AI135995 (KGA, RFG, MAS), U01 AI151812 (KGA, RFG), R01 AI153044 (MAS, PL, AR), R01 AI135992 (JW), 5T32AI007244-38 (JIL), EU commission H2020 programme grant number 874735 (MPGK), Fundação para a Ciência e a Tecnologia (FCT) through MOSTMICRO-ITQB (UIDB/04612/2020, UIDP/04612/2020, ZH) and LS4FUTURE (LA/P/0087/2020, ZH), Wellcome Trust (Collaborators Award 206298/Z/17/Z, ARTIC network) (MAS, PL, AR), European Research Council (grant agreement no. 725422 - ReservoirDOCS) (MAS, PL, AR), National Institutes of Health (T15LM011271; JEP), the UC San Diego Merkin Fellowship (JEP), National Health and Medical Research Council, Australia (GNT2017197, ECH), UK Medical Research Council (MRC, MC_UU_12014/12, MC_UU_00034/5 and MR/V01157X/1, DLR), AIR@InnoHK administered by the Innovation and Technology Commission, Hong Kong Special Administrative Region, China (ECH), European Union Horizon 2020 (project MOOD, grant agreement n°874850, PL), Research Foundation - Flanders (G0D5117N, G051322N, PL), the Canadian Institutes of Health Research as part of the Coronavirus Variants Rapid Response Network (CoVaRR-Net; CIHR FRN#175622; ALR, RS), and the Canada Foundation for Innovation - Major Science Initiatives Fund and from the Government of Saskatchewan through Innovation Saskatchewan and the Ministry of Agriculture (ALR, RS, MBR)
Declaration of interests
J.O.W. and N.M. receive funding from the Centers for Disease Control and Prevention (CDC) through contracts to his institution unrelated to this research. M.A.S. receives contracts from the US Food & Drug Administration, US Department of Veterans Affairs and Janssen Research & Development, all outside the scope of this work. R.F.G. is a cofounder of Zalgen Labs, a biotechnology company developing countermeasures for emerging viruses. A.C-C. is an employee of Cultivarium, a nonprofit organization studying environmental microbes, unrelated to the scope of this work. M.W., A.L.R., J.E.P., A.R., M.A.S., E.C.H., S.A.G., J.O.W., and K.G.A. have received consulting fees and/or provided compensated expert testimony on SARS-CoV-2 and the COVID-19 pandemic. M.P.G.K. was involved in the WHO convened SARS-CoV-2 origins mission.
Footnotes
Publisher's Disclaimer: This is a PDF file of an unedited manuscript that has been accepted for publication. As a service to our customers we are providing this early version of the manuscript. The manuscript will undergo copyediting, typesetting, and review of the resulting proof before it is published in its final form. Please note that during the production process errors may be discovered which could affect the content, and all legal disclaimers that apply to the journal pertain.
Contributor Information
Alexander Crits-Christoph, Independent researcher..
Joshua I. Levy, Department of Immunology and Microbiology, The Scripps Research Institute, La Jolla, CA 92037, USA.
Jonathan E. Pekar, Department of Biomedical Informatics, University of California San Diego, La Jolla, CA, USA.
Stephen A. Goldstein, Department of Human Genetics, University of Utah School of Medicine, Salt Lake City, UT, USA.
Reema Singh, Vaccine and Infectious Disease Organization, University of Saskatchewan, Saskatoon, SK, Canada..
Zach Hensel, ITQB NOVA, Universidade NOVA de Lisboa, Lisbon, Av. da República, 2780-157, Oeiras, Portugal.
Karthik Gangavarapu, Department of Human Genetics, University of California, Los Angeles, Los Angeles, CA 90024, USA..
Matthew B. Rogers, Vaccine and Infectious Disease Organization, University of Saskatchewan, Saskatoon, SK, Canada.
Niema Moshiri, Department of Computer Science & Engineering, University of California San Diego, La Jolla, CA, USA..
Robert F. Garry, Tulane University, School of Medicine, Department of Microbiology and Immunology, New Orleans, LA 70112, USA. Zalgen Labs, Frederick, MD 21703, USA. Global Virus Network (GVN), Baltimore, MD 21201, USA.
Edward C. Holmes, School of Medical Sciences, The University of Sydney, Sydney, NSW 2006, Australia.
Marion P. G. Koopmans, Department of Viroscience, and Pandemic and Disaster Preparedness Centre., Erasmus Medical Centre, Rotterdam, The Netherlands.
Philippe Lemey, Department of Microbiology, Immunology and Transplantation, Rega Institute, KU Leuven, Leuven, Belgium..
Thomas P. Peacock, The Pirbright Institute, Woking, Surrey, UK, GU24 0NF; Department of Infectious Disease, Imperial College London, London, UK, W2 1PG.
Saskia Popescu, University of Maryland, School of Medicine, Department of Epidemiology & Public Health, Baltimore, MD 21201, USA..
Andrew Rambaut, Institute of Ecology and Evolution, University of Edinburgh, Edinburgh, UK..
David L. Robertson, MRC-University of Glasgow Center for Virus Research, Glasgow, G61 1QH, UK.
Marc A. Suchard, Department of Biostatistics, University of California, Los Angeles, Los Angeles, CA 90024, USA.
Joel O. Wertheim, Department of Medicine, University of California San Diego, La Jolla, CA, USA.
Angela L. Rasmussen, Vaccine and Infectious Disease Organization, University of Saskatchewan, Saskatoon, SK, Canada.
Kristian G. Andersen, Department of Immunology and Microbiology, The Scripps Research Institute, La Jolla, CA 92037, USA..
Michael Worobey, Department of Ecology and Evolutionary Biology, University of Arizona, Tucson, AZ, USA..
Florence Débarre, Institut d’Écologie et des Sciences de l’Environnement (IEES-Paris, UMR 7618), CNRS, Sorbonne Université, UPEC, IRD, INRAE, Paris, France..
References
- 1.Anonymous (2019). The “Emergency Notice” document of the Municipal Health Commission on submitting the treatment of unexplained pneumonia is true. Eagle Net. [Google Scholar]
- 2.Worobey M (2021). Dissecting the early COVID-19 cases in Wuhan. Science 374, 1202–1204. [DOI] [PubMed] [Google Scholar]
- 3.Worobey M, Levy JI, Malpica Serrano L, Crits-Christoph A, Pekar JE, Goldstein SA, Rasmussen AL, Kraemer MUG, Newman C, Koopmans MPG, et al. (2022). The Huanan Seafood Wholesale Market in Wuhan was the early epicenter of the COVID-19 pandemic. Science 377, 951–959. [DOI] [PMC free article] [PubMed] [Google Scholar]
- 4.World Health Organization (2021). WHO-convened Global Study of Origins of SARS-CoV-2: China Part: Joint WHO-China Study, 14 January-10 February 2021 : Joint Report.
- 5.Débarre F, and Worobey M (2024). Confirmation of the centrality of the Huanan market among early COVID-19 cases. arxiv.org/abs/2403.05859
- 6.Chen N, Zhou M, Dong X, Qu J, Gong F, Han Y, Qiu Y, Wang J, Liu Y, Wei Y, et al. (2020). Epidemiological and clinical characteristics of 99 cases of 2019 novel coronavirus pneumonia in Wuhan, China: a descriptive study. Lancet 395, 507–513. [DOI] [PMC free article] [PubMed] [Google Scholar]
- 7.Li Q, Guan X, Wu P, Wang X, Zhou L, Tong Y, Ren R, Leung KSM, Lau EHY, Wong JY, et al. (2020). Early Transmission Dynamics in Wuhan, China, of Novel Coronavirus–Infected Pneumonia. N. Engl. J. Med 10.1056/NEJMoa2001316. [DOI] [PMC free article] [PubMed] [Google Scholar]
- 8.Wang D, Cai J, Shi T, Xiao Y, Feng X, Yang M, Li W, Liu W, Yu L, Ye Z, et al. (2020). Epidemiological characteristics and the entire evolution of coronavirus disease 2019 in Wuhan, China. Respir. Res 21, 1–8. [DOI] [PMC free article] [PubMed] [Google Scholar]
- 9.Li Z, Guan X, Mao N, Luo H, Qin Y, He N, Zhu Z, Yu J, Li Y, Liu J, et al. (2021). Antibody seroprevalence in the epicenter Wuhan, Hubei, and six selected provinces after containment of the first epidemic wave of COVID-19 in China. The Lancet Regional Health – Western Pacific 8. 10.1016/j.lanwpc.2021.100094. [DOI] [PMC free article] [PubMed] [Google Scholar]
- 10.He Z, Ren L, Yang J, Guo L, Feng L, Ma C, Wang X, Leng Z, Tong X, Zhou W, et al. (2021). Seroprevalence and humoral immune durability of anti-SARS-CoV-2 antibodies in Wuhan, China: a longitudinal, population-level, cross-sectional study. Lancet 397, 1075–1084. [DOI] [PMC free article] [PubMed] [Google Scholar]
- 11.Pekar JE, Magee A, Parker E, Moshiri N, Izhikevich K, Havens JL, Gangavarapu K, Malpica Serrano LM, Crits-Christoph A, Matteson NL, et al. (2022). The molecular epidemiology of multiple zoonotic origins of SARS-CoV-2. Science 377, 960–966. [DOI] [PMC free article] [PubMed] [Google Scholar]
- 12.Duchene S, Featherstone L, Haritopoulou-Sinanidou M, Rambaut A, Lemey P, and Baele G (2020). Temporal signal and the phylodynamic threshold of SARS-CoV-2. Virus Evol 6, veaa061. [DOI] [PMC free article] [PubMed] [Google Scholar]
- 13.Lu J, du Plessis L, Liu Z, Hill V, Kang M, Lin H, Sun J, François S, Kraemer MUG, Faria NR, et al. (2020). Genomic Epidemiology of SARS-CoV-2 in Guangdong Province, China. Cell 181, 997–1003.e9. [DOI] [PMC free article] [PubMed] [Google Scholar]
- 14.Giovanetti M, Benvenuto D, Angeletti S, and Ciccozzi M (2020). The first two cases of 2019-nCoV in Italy: Where they come from? J. Med. Virol 92. 10.1002/jmv.25699. [DOI] [PMC free article] [PubMed] [Google Scholar]
- 15.Gómez-Carballa A, Bello X, Pardo-Seco J, Martinón-Torres F, and Salas A (2020). Mapping genome variation of SARS-CoV-2 worldwide highlights the impact of COVID-19 super-spreaders. Genome Res. 30, 1434. [DOI] [PMC free article] [PubMed] [Google Scholar]
- 16.Li X, Wang W, Zhao X, Zai J, Zhao Q, Li Y, and Chaillon A (2020). Transmission dynamics and evolutionary history of 2019-nCoV. J. Med. Virol 92, 501–511. [DOI] [PMC free article] [PubMed] [Google Scholar]
- 17.Pekar J, Worobey M, Moshiri N, Scheffler K, and Wertheim JO (2021). Timing the SARS-CoV-2 index case in Hubei province. Science 372, 412–417. [DOI] [PMC free article] [PubMed] [Google Scholar]
- 18.Jijón S, Czuppon P, Blanquart F, and Débarre F (2024). Using early detection data to estimate the date of emergence of an epidemic outbreak. PLoS Comput Biol. Mar 8;20(3):e1011934. 10.1371/journal.pcbi.1011934 [DOI] [PMC free article] [PubMed] [Google Scholar]
- 19.Chang L, Zhao L, Xiao Y, Xu T, Chen L, Cai Y, Dong X, Wang C, Xiao X, Ren L, et al. (2023). Serosurvey for SARS-CoV-2 among blood donors in Wuhan, China from September to December 2019. Protein Cell 14, 28–36. [DOI] [PMC free article] [PubMed] [Google Scholar]
- 20.Chang L, Hou W, Zhao L, Zhang Y, Wang Y, Wu L, Xu T, Wang L, Wang J, Ma J, et al. (2021). The prevalence of antibodies to SARS-CoV-2 among blood donors in China. Nat. Commun 12, 1–10. [DOI] [PMC free article] [PubMed] [Google Scholar]
- 21.Kong W-H, Li Y, Peng M-W, Kong D-G, Yang X-B, Wang L, and Liu M-Q (2020). SARS-CoV-2 detection in patients with influenza-like illness. Nature Microbiology 5, 675–678. [DOI] [PubMed] [Google Scholar]
- 22.Tao J, Gao H, Zhu S, Yang L, and He D (2020). Influenza versus COVID-19 cases among influenza-like illness patients in travelers from Wuhan to Hong Kong in January 2020. Int. J. Infect. Dis 101, 323–325. [DOI] [PMC free article] [PubMed] [Google Scholar]
- 23.Bloom JD (2021). Recovery of Deleted Deep Sequencing Data Sheds More Light on the Early Wuhan SARS-CoV-2 Epidemic. Mol. Biol. Evol 38, 5211–5224. [DOI] [PMC free article] [PubMed] [Google Scholar]
- 24.Lu R, Zhao X, Li J, Niu P, Yang B, Wu H, Wang W, Song H, Huang B, Zhu N, et al. (2020). Genomic characterisation and epidemiology of 2019 novel coronavirus: implications for virus origins and receptor binding. Lancet 395. 10.1016/S0140-6736(20)30251-8. [DOI] [PMC free article] [PubMed] [Google Scholar]
- 25.Liu WJ, Liu P, Lei W, Jia Z, He X, Shi W, Tan Y, Zou S, Wong G, Wang J, et al. (2023). Surveillance of SARS-CoV-2 at the Huanan Seafood Market. Nature. 10.1038/s41586-023-06043-2. [DOI] [PubMed] [Google Scholar]
- 26.Pruvot M, Khammavong K, Milavong P, Philavong C, Reinharz D, Mayxay M, Rattanavong S, Horwood P, Dussart P, Douangngeun B, et al. (2019). Toward a quantification of risks at the nexus of conservation and health: The case of bushmeat markets in Lao PDR. Sci. Total Environ 676, 732–745. [DOI] [PMC free article] [PubMed] [Google Scholar]
- 27.Yen HL, Sit THC, Brackman CJ, Chuk SSY, Gu H, Tam KWS, Law PYT, Leung GM, Peiris M, and Poon LLM (2022). Transmission of SARS-CoV-2 delta variant (AY.127) from pet hamsters to humans, leading to onward human-to-human transmission: a case study. Lancet 399. 10.1016/S0140-6736(22)00326-9. [DOI] [PMC free article] [PubMed] [Google Scholar]
- 28.Koh LP, Li Y, and Lee JSH (2021). The value of China’s ban on wildlife trade and consumption. Nature Sustainability 4, 2–4. [Google Scholar]
- 29.Shi Z, and Hu Z (2008). A review of studies on animal reservoirs of the SARS coronavirus. Virus Res. 133. 10.1016/j.virusres.2007.03.012. [DOI] [PMC free article] [PubMed] [Google Scholar]
- 30.Xu R-H, He J-F, Evans MR, Peng G-W, Field HE, Yu D-W, Lee C-K, Luo H-M, Lin W-S, Lin P, et al. (2004). Epidemiologic Clues to SARS Origin in China. Emerg. Infect. Dis 10, 1030. [DOI] [PMC free article] [PubMed] [Google Scholar]
- 31.Guan Y, Zheng BJ, He YQ, Liu XL, Zhuang ZX, Cheung CL, Luo SW, Li PH, Zhang LJ, Guan YJ, et al. (2003). Isolation and characterization of viruses related to the SARS coronavirus from animals in southern China. Science 302. 10.1126/science.1087139. [DOI] [PubMed] [Google Scholar]
- 32.Tu C, Crameri G, Kong X, Chen J, Sun Y, Yu M, Xiang H, Xia X, Liu S, Ren T, et al. (2004). Antibodies to SARS Coronavirus in Civets. Emerg. Infect. Dis 10, 2244. [DOI] [PMC free article] [PubMed] [Google Scholar]
- 33.Kan B, Wang M, Jing H, Xu H, Jiang X, Yan M, Liang W, Zheng H, Wan K, Liu Q, et al. (2005). Molecular Evolution Analysis and Geographic Investigation of Severe Acute Respiratory Syndrome Coronavirus-Like Virus in Palm Civets at an Animal Market and on Farms. J. Virol 79, 11892. [DOI] [PMC free article] [PubMed] [Google Scholar]
- 34.Liu L, Fang Q, Deng F, Wang H, Yi CE, Ba L, Yu W, Lin RD, Li T, Hu Z, et al. (2007). Natural mutations in the receptor binding domain of spike glycoprotein determine the reactivity of cross-neutralization between palm civet coronavirus and severe acute respiratory syndrome coronavirus. J. Virol 81. 10.1128/JVI.02389-06. [DOI] [PMC free article] [PubMed] [Google Scholar]
- 35.Keusch GT, Amuasi JH, Anderson DE, Daszak P, Eckerle I, Field H, Koopmans M, Lam SK, Cg DN, Peiris M, et al. (2022). Pandemic origins and a One Health approach to preparedness and prevention: Solutions based on SARS-CoV-2 and other RNA viruses. Proc. Natl. Acad. Sci. U. S. A 119. 10.1073/pnas.2202871119. [DOI] [PMC free article] [PubMed] [Google Scholar]
- 36.Huong NQ, Nga NTT, Van Long N, Luu BD, Latinne A, Pruvot M, Phuong NT, Quang LTV, Van Hung V, Lan NT, et al. (2020). Coronavirus testing indicates transmission risk increases along wildlife supply chains for human consumption in Viet Nam, 2013–2014. PLoS One 15, e0237129. [DOI] [PMC free article] [PubMed] [Google Scholar]
- 37.He WT, Hou X, Zhao J, Sun J, He H, Si W, Wang J, Jiang Z, Yan Z, Xing G, et al. (2022). Virome characterization of game animals in China reveals a spectrum of emerging pathogens. Cell 185. 10.1016/j.cell.2022.02.014. [DOI] [PMC free article] [PubMed] [Google Scholar]
- 38.Temmam S, Vongphayloth K, Baquero E, Munier S, Bonomi M, Regnault B, Douangboubpha B, Karami Y, Chrétien D, Sanamxay D, et al. (2022). Bat coronaviruses related to SARS-CoV-2 and infectious for human cells. Nature 604, 330–336. [DOI] [PubMed] [Google Scholar]
- 39.Lam TT-Y, Jia N, Zhang Y-W, Shum MH-H, Jiang J-F, Zhu H-C, Tong Y-G, Shi Y-X, Ni X-B, Liao Y-S, et al. (2020). Identifying SARS-CoV-2-related coronaviruses in Malayan pangolins. Nature 583, 282–285. [DOI] [PubMed] [Google Scholar]
- 40.Nga NTT, Latinne A, Thuy HB, Van Long N, Ngoc PTB, Anh NTL, Van Thai N, Phuong TQ, Van Thai H, Hai LK, et al. (2022). Evidence of SARS-CoV-2 Related Coronaviruses Circulating in Sunda pangolins (Manis javanica) Confiscated From the Illegal Wildlife Trade in Viet Nam. Front. Public Health 10, 826116. [DOI] [PMC free article] [PubMed] [Google Scholar]
- 41.Xiao K, Zhai J, Feng Y, Zhou N, Zhang X, Zou J-J, Li N, Guo Y, Li X, Shen X, et al. (2020). Isolation of SARS-CoV-2-related coronavirus from Malayan pangolins. Nature 583, 286–289. [DOI] [PubMed] [Google Scholar]
- 42.Wacharapluesadee S, Tan CW, Maneeorn P, Duengkae P, Zhu F, Joyjinda Y, Kaewpom T, Chia WN, Ampoot W, Lim BL, et al. (2021). Evidence for SARS-CoV-2 related coronaviruses circulating in bats and pangolins in Southeast Asia. Nat. Commun 12, 1–9. [DOI] [PMC free article] [PubMed] [Google Scholar]
- 43.Peng M-S, Li J-B, Cai Z-F, Liu H, Tang X, Ying R, Zhang J-N, Tao J-J, Yin T-T, Zhang T, et al. (2021). The high diversity of SARS-CoV-2-related coronaviruses in pangolins alerts potential ecological risks. Zoological Research 42, 834. [DOI] [PMC free article] [PubMed] [Google Scholar]
- 44.Evans TS, Tan CW, Aung O, Phyu S, Lin H, Coffey LL, Toe AT, Aung P, Aung TH, Aung NT, et al. (2023). Exposure to diverse sarbecoviruses indicates frequent zoonotic spillover in human communities interacting with wildlife. Int. J. Infect. Dis 131, 57–64. [DOI] [PMC free article] [PubMed] [Google Scholar]
- 45.Xiao X, Newman C, Buesching CD, Macdonald DW, and Zhou Z-M (2021). Animal sales from Wuhan wet markets immediately prior to the COVID-19 pandemic. Sci. Rep 11, 1–7. [DOI] [PMC free article] [PubMed] [Google Scholar]
- 46.Origins of COVID, BMJ Webinar (2021). https://youtu.be/eLSv4Iwk_jM?si=LfZ3LrasZClZVZka&t=1892.
- 47.Suchard MA, Lemey P, Baele G, Ayres DL, Drummond AJ, and Rambaut A (2018). Bayesian phylogenetic and phylodynamic data integration using BEAST 1.10. Virus evolution 4. 10.1093/ve/vey016. [DOI] [PMC free article] [PubMed] [Google Scholar]
- 48.Lv JX, Liu X, Pei YY, Song ZG, Chen X, Hu SJ, She JL, Liu Y, Chen YM, and Zhang YZ (2024). Evolutionary trajectory of diverse SARS-CoV-2 variants at the beginning of COVID-19 outbreak. Virus evolution 10. 10.1093/ve/veae020. [DOI] [PMC free article] [PubMed] [Google Scholar]
- 49.Débarre F, and Hensel Z (2024). A critical reexamination of recovered SARS-CoV-2 sequencing data. bioRxiv, 2024.02.15.580500. 10.1101/2024.02.15.580500. [DOI] [Google Scholar]
- 50.Rothman JA, Loveless TB, Adams ED, Steele JA, Zimmer-Faust AG, Langlois K, Wanless D, Griffith M, Mao L, Chokry J, et al. (2021). RNA Viromics of Southern California Wastewater and Detection of SARS-CoV-2 Single-Nucleotide Variants. Appl. Environ. Microbiol 10.1128/AEM.01448-21. [DOI] [PMC free article] [PubMed] [Google Scholar]
- 51.Crits-Christoph A, Kantor RS, Olm MR, Whitney ON, Al-Shayeb B, Lou YC, Flamholz A, Kennedy LC, Greenwald H, Hinkle A, et al. (2021). Genome Sequencing of Sewage Detects Regionally Prevalent SARS-CoV-2 Variants. MBio. 10.1128/mbio.02703-20. [DOI] [PMC free article] [PubMed] [Google Scholar]
- 52.Freuling CM, Breithaupt A, Müller T, Sehl J, Balkema-Buschmann A, Rissmann M, Klein A, Wylezich C, Höper D, Wernike K, et al. (2020). Susceptibility of Raccoon Dogs for Experimental SARS-CoV-2 Infection - Volume 26, Number 12—December 2020 - Emerging Infectious Diseases journal - CDC. Emerging Infectious Diseases 26. 10.3201/eid2612.203733. [DOI] [PMC free article] [PubMed] [Google Scholar]
- 53.Bosco-Lauth AM, Hartwig AE, Porter SM, Gordy PW, Nehring M, Byas AD, VandeWoude S, Ragan IK, Maison RM, and Bowen RA (2020). Experimental infection of domestic dogs and cats with SARS-CoV-2: Pathogenesis, transmission, and response to reexposure in cats. Proc. Natl. Acad. Sci. U. S. A 117. 10.1073/pnas.2013102117. [DOI] [PMC free article] [PubMed] [Google Scholar]
- 54.Mykytyn AZ, Lamers MM, Okba NMA, Breugem TI, Schipper D, van den Doel PB, van Run P, van Amerongen G, de Waal L, Koopmans MPG, et al. (2021). Susceptibility of rabbits to SARS-CoV-2. Emerg. Microbes Infect 10.1080/22221751.2020.1868951. [DOI] [PMC free article] [PubMed] [Google Scholar]
- 55.Li M, Du J, Liu W, Li Z, Lv F, Hu C, Dai Y, Zhang X, Zhang Z, Liu G, et al. (2023). Comparative susceptibility of SARS-CoV-2, SARS-CoV, and MERS-CoV across mammals. ISME J. 17, 549–560. [DOI] [PMC free article] [PubMed] [Google Scholar]
- 56.Zhou P, Yang X-L, Wang X-G, Hu B, Zhang L, Zhang W, Si H-R, Zhu Y, Li B, Huang C-L, et al. (2020). A pneumonia outbreak associated with a new coronavirus of probable bat origin. Nature 579, 270–273. [DOI] [PMC free article] [PubMed] [Google Scholar]
- 57.Bloom JD (2023). Association between SARS-CoV-2 and metagenomic content of samples from the Huanan Seafood Market. Virus Evol 9, vead050. [DOI] [PMC free article] [PubMed] [Google Scholar]
- 58.Gloor GB, Macklaim JM, Pawlowsky-Glahn V, and Egozcue JJ (2017). Microbiome Datasets Are Compositional: And This Is Not Optional. Front. Microbiol 8, 294209. [DOI] [PMC free article] [PubMed] [Google Scholar]
- 59.Pinto S, Benincà E, van Nes EH, Scheffer M, and Bogaards JA (2022). Species abundance correlations carry limited information about microbial network interactions. PLoS Comput. Biol 18. 10.1371/journal.pcbi.1010491. [DOI] [PMC free article] [PubMed] [Google Scholar]
- 60.Coenen AR, and Weitz JS (2018). Limitations of Correlation-Based Inference in Complex Virus-Microbe Communities. mSystems 3. 10.1128/mSystems.00084-18. [DOI] [PMC free article] [PubMed] [Google Scholar]
- 61.Carr A, Diener C, Baliga NS, and Gibbons SM (2019). Use and abuse of correlation analyses in microbial ecology. ISME J. 13, 2647–2655. [DOI] [PMC free article] [PubMed] [Google Scholar]
- 62.Débarre F (2023). What we can and cannot learn from SARS-CoV-2 and animals in metagenomic samples from the Huanan market. Virus evolution 10. 10.1093/ve/vead077. [DOI] [PMC free article] [PubMed] [Google Scholar]
- 63.Crits-Christoph A, Gangavarapu K, Pekar JE, Moshiri N, Singh R, Levy JI, Goldstein SA, Suchard MA, Popescu S, Robertson DL, et al. (2023). Genetic evidence of susceptible wildlife in SARS-CoV-2 positive samples at the Huanan Wholesale Seafood Market, Wuhan: Analysis and interpretation of data released by the Chinese Center for Disease Control. 10.5281/zenodo.7754299. [DOI] [Google Scholar]
- 64.Minh BQ, Schmidt HA, Chernomor O, Schrempf D, Woodhams MD, von Haeseler A, and Lanfear R (2020). IQ-TREE 2: New Models and Efficient Methods for Phylogenetic Inference in the Genomic Era. Mol. Biol. Evol 37, 1530–1534. [DOI] [PMC free article] [PubMed] [Google Scholar]
- 65.Cui X, Fan K, Liang X, Gong W, Chen W, He B, Chen X, Wang H, Wang X, Zhang P, et al. (2023). Virus diversity, wildlife-domestic animal circulation and potential zoonotic viruses of small mammals, pangolins and zoo animals. Nat. Commun 14, 1–13. [DOI] [PMC free article] [PubMed] [Google Scholar]
- 66.He HJ, Zhang W, Liang J, Lu M, Wang R, Li G, He JW, Chen J, Chen J, Xing G, et al. (2020). Etiology and genetic evolution of canine coronavirus circulating in five provinces of China, during 2018–2019. Microb. Pathog 145. 10.1016/j.micpath.2020.104209. [DOI] [PMC free article] [PubMed] [Google Scholar]
- 67.Wang W, Tian J-H, Chen X, Hu R-X, Lin X-D, Pei Y-Y, Lv J-X, Zheng J-J, Dai F-H, Song Z-G, et al. (2022). Coronaviruses in wild animals sampled in and around Wuhan at the beginning of COVID-19 emergence. Virus Evol 8, veac046. [DOI] [PMC free article] [PubMed] [Google Scholar]
- 68.Liu Y, Deng Y, Niu S, Zhu N, Song J, Zhang X, Su W, Nie W, Lu R, Irwin DM, et al. (2023). Discovery and identification of a novel canine coronavirus causing a diarrhea outbreak in Vulpes. Sci Bull. Fac. Agric. Kyushu Univ 68. 10.1016/j.scib.2023.09.011. [DOI] [PubMed] [Google Scholar]
- 69.Pu J, Wang S, Yin Y, Zhang G, Carter RA, Wang J, Xu G, Sun H, Wang M, Wen C, et al. (2015). Evolution of the H9N2 influenza genotype that facilitated the genesis of the novel H7N9 virus. Proc. Natl. Acad. Sci. U. S. A 112. 10.1073/pnas.1422456112. [DOI] [PMC free article] [PubMed] [Google Scholar]
- 70.Wang Z, Li H, Li Y, Wu Z, Ai H, Zhang M, Rong L, Blinov ML, Tong Q, Liu L, et al. (2023). Mixed selling of different poultry species facilitates emergence of public-health-threating avian influenza viruses. Emerg. Microbes Infect 12. 10.1080/22221751.2023.2214255. [DOI] [PMC free article] [PubMed] [Google Scholar]
- 71.Butt KM, Smith GJD, Chen H, Zhang LJ, Connie Leung YH, Xu KM, Lim W, Webster RG, Yuen KY, Malik Peiris JS, et al. (2005). Human Infection with an Avian H9N2 Influenza A Virus in Hong Kong in 2003. J. Clin. Microbiol 10.1128/jcm.43.11.5760-5767.2005. [DOI] [PMC free article] [PubMed] [Google Scholar]
- 72.Kim S-I, Park S-K, Lee H, Oshida T, Kimura J, Kim Y-J, Nguyen ST, Sashika M, and Min M-S (2013). Phylogeography of Korean raccoon dogs: implications of peripheral isolation of a forest mammal in East Asia. J. Zool 290, 225–235. [Google Scholar]
- 73.China’s Fur Trade and its position in the Global Fur Industry (2023). ACTAsia. https://www.actasia.org/resources/chinas-fur-trade-and-its-position-in-the-global-fur-industry/.
- 74.Pekar JE, Lytras S, Ghafari M, Magee AF, Parker E, Havens JL, Katzourakis A, Vasylyeva TI, Suchard MA, Hughes AC, et al. (2023). The recency and geographical origins of the bat viruses ancestral to SARS-CoV and SARS-CoV-2. bioRxiv, 2023.07.12.548617. 10.1101/2023.07.12.548617. [DOI] [Google Scholar]
- 75.Lan T, Li H, Yang S, Shi M, Han L, Sahu SK, Lu Y, Wang J, Zhou M, Liu H, et al. (2022). The chromosome-scale genome of the raccoon dog: Insights into its evolutionary characteristics. iScience 25. 10.1016/j.isci.2022.105117. [DOI] [PMC free article] [PubMed] [Google Scholar]
- 76.Holmes EC, Goldstein SA, Rasmussen AL, Robertson DL, Crits-Christoph A, Wertheim JO, Anthony SJ, Barclay WS, Boni MF, Doherty PC, et al. (2021). The origins of SARS-CoV-2: A critical review. Cell 184, 4848–4856. [DOI] [PMC free article] [PubMed] [Google Scholar]
- 77.Wu H, Wu H, Wang Y, Li H, Tian F, Zhou K, Qi Z, Zhang Y, Zhang Q, and Zhang X (2023). Analysis of Himalayan marmot distribution and plague risk in Qinghai province of China using the “3S” technology. Sci. Rep 13, 1–13. [DOI] [PMC free article] [PubMed] [Google Scholar]
- 78.Lopes LR (2023). Cervids ACE2 Residues that Bind the Spike Protein can Provide Susceptibility to SARS-CoV-2. Ecohealth 20. 10.1007/s10393-023-01632-z. [DOI] [PMC free article] [PubMed] [Google Scholar]
- 79.Boklund A, Gortázar C, Pasquali P, Roberts H, Nielsen SS, Stahl K, Stegeman A, Baldinelli F, Broglia A, Van Der Stede Y, et al. (2021). Monitoring of SARS-CoV-2 infection in mustelids. EFSA Journal 19. 10.2903/j.efsa.2021.6459. [DOI] [PMC free article] [PubMed] [Google Scholar]
- 80.Shi J, Wen Z, Zhong G, Yang H, Wang C, Huang B, Liu R, He X, Shuai L, Sun Z, et al. (2020). Susceptibility of ferrets, cats, dogs, and other domesticated animals to SARS-coronavirus 2. Science 368. 10.1126/science.abb7015. [DOI] [PMC free article] [PubMed] [Google Scholar]
- 81.Porter SM, Hartwig AE, Bielefeldt-Ohmann H, Bosco-Lauth AM, and Root JJ (2022). Susceptibility of Wild Canids to SARS-CoV-2. Emerg. Infect. Dis 28. 10.3201/eid2809.220223. [DOI] [PMC free article] [PubMed] [Google Scholar]
- 82.Davoust B, Guérin P, Orain N, Fligny C, Flirden F, Fenollar F, Mediannikov O, and Edouard S (2022). Evidence of antibodies against SARS-CoV-2 in wild mustelids from Brittany (France). Transbound. Emerg. Dis 69. 10.1111/tbed.14663. [DOI] [PMC free article] [PubMed] [Google Scholar]
- 83.Meekins DA, Morozov I, Trujillo JD, Gaudreault NN, Bold D, Carossino M, Artiaga BL, Indran SV, Kwon T, Balaraman V, et al. (2020). Susceptibility of swine cells and domestic pigs to SARS-CoV-2. Emerg. Microbes Infect 10.1080/22221751.2020.1831405. [DOI] [PMC free article] [PubMed] [Google Scholar]
- 84.Bosco-Lauth AM, Walker A, Guilbert L, Porter S, Hartwig A, McVicker E, Bielefeldt-Ohmann H, and Bowen RA (2021). Susceptibility of livestock to SARS-CoV-2 infection. Emerg. Microbes Infect 10.1080/22221751.2021.2003724. [DOI] [PMC free article] [PubMed] [Google Scholar]
- 85.Renninger N, Nastasi N, Bope A, Cochran SJ, Haines SR, Balasubrahmaniam N, Stuart K, Bivins A, Bibby K, Hull NM, et al. (2021). Indoor Dust as a Matrix for Surveillance of COVID-19. mSystems 6. 10.1128/mSystems.01350-20. [DOI] [PMC free article] [PubMed] [Google Scholar]
- 86.Liu H, Fei C, Chen Y, Luo S, Yang T, Yang L, Liu J, Ji X, Wu W, and Song J (2021). Investigating SARS-CoV-2 persistent contamination in different indoor environments. Environ. Res 202, 111763. [DOI] [PMC free article] [PubMed] [Google Scholar]
- 87.Zhou J, Singanayagam A, Goonawardane N, Moshe M, Sweeney FP, Sukhova K, Killingley B, Kalinova M, Mann AJ, Catchpole AP, et al. (2023). Viral emissions into the air and environment after SARS-CoV-2 human challenge: a phase 1, open label, first-in-human study. The Lancet Microbe 4, e579–e590. [DOI] [PMC free article] [PubMed] [Google Scholar]
- 88.Rasmussen TB, Fonager J, Jørgensen CS, Lassaunière R, Hammer AS, Quaade ML, Boklund A, Lohse L, Strandbygaard B, Rasmussen M, et al. (2021). Infection, recovery and re-infection of farmed mink with SARS-CoV-2. PLoS Pathog. 17, e1010068. [DOI] [PMC free article] [PubMed] [Google Scholar]
- 89.Wang X, Ren Z, Wang L, Chen J, Zhang P, Chen J-P, Chen X, Li L, Lin X, Qi N, et al. (2022). Identification of coronaviruses in farmed wild animals reveals their evolutionary origins in Guangdong, southern China. Virus Evol 8, veac049. [DOI] [PMC free article] [PubMed] [Google Scholar]
- 90.Van Kerkhove M (2023). Share all SARS-CoV-2 data immediately. Science 380. 10.1126/science.adi0490. [DOI] [PubMed] [Google Scholar]
- 91.Langmead B, and Salzberg SL (2012). Fast gapped-read alignment with Bowtie 2. Nat. Methods 9, 357–359. [DOI] [PMC free article] [PubMed] [Google Scholar]
- 92.Moshiri N (2023). ViralConsensus: a fast and memory-efficient tool for calling viral consensus genome sequences directly from read alignment data. Bioinformatics 39, btad317. [DOI] [PMC free article] [PubMed] [Google Scholar]
- 93.Grubaugh ND, Gangavarapu K, Quick J, Matteson NL, De Jesus JG, Main BJ, Tan AL, Paul LM, Brackney DE, Grewal S, et al. (2019). An amplicon-based sequencing framework for accurately measuring intrahost virus diversity using PrimalSeq and iVar. Genome Biol. 20, 1–19. [DOI] [PMC free article] [PubMed] [Google Scholar]
- 94.Farias IP, Ortí G, Sampaio I, Schneider H, and Meyer A (2001). The cytochrome b gene as a phylogenetic marker: the limits of resolution for analyzing relationships among cichlid fishes. J. Mol. Evol 53, 89–103. [DOI] [PubMed] [Google Scholar]
- 95.Ondov BD, Treangen TJ, Melsted P, Mallonee AB, Bergman NH, Koren S, and Phillippy AM (2016). Mash: fast genome and metagenome distance estimation using MinHash. Genome Biol. 17, 1–14. [DOI] [PMC free article] [PubMed] [Google Scholar]
- 96.Gourlé H, Karlsson-Lindsjö O, Hayer J, and Bongcam-Rudloff E (2019). Simulating Illumina metagenomic data with InSilicoSeq. Bioinformatics 35, 521–522. [DOI] [PMC free article] [PubMed] [Google Scholar]
- 97.Davies TM, Marshall JC, and Hazelton ML (2018). Tutorial on kernel estimation of continuous spatial and spatiotemporal relative risk. Stat. Med 37, 1191–1221. [DOI] [PubMed] [Google Scholar]
- 98.Katoh K, and Standley DM (2013). MAFFT Multiple Sequence Alignment Software Version 7: Improvements in Performance and Usability. Mol. Biol. Evol 30, 772–780. [DOI] [PMC free article] [PubMed] [Google Scholar]
- 99.Sagulenko P, Puller V, and Neher RA (2018). TreeTime: Maximum-likelihood phylodynamic analysis. Virus Evol 4, vex042. [DOI] [PMC free article] [PubMed] [Google Scholar]
- 100.McGinnis S, and Madden TL (2004). BLAST: at the core of a powerful and diverse set of sequence analysis tools. Nucleic Acids Res. 32, W20–W25. [DOI] [PMC free article] [PubMed] [Google Scholar]
- 101.Bushmanova E, Antipov D, Lapidus A, and Prjibelski AD (2019). rnaSPAdes: a de novo transcriptome assembler and its application to RNA-Seq data. Gigascience 8. 10.1093/gigascience/giz100. [DOI] [PMC free article] [PubMed] [Google Scholar]
- 102.Gearty W, and Jones LA (2023). rphylopic: An R package for fetching, transforming, and visualising PhyloPic silhouettes. bioRxiv, 2023.06.22.546191. 10.1101/2023.06.22.546191. [DOI] [Google Scholar]
- 103.Khare S, Gurry C, Freitas L, Schultz MB, Bach G, Diallo A, Akite N, Ho J, Lee RT, Yeo W, et al. (2021). GISAID’s Role in Pandemic Response. China CDC weekly 3. 10.46234/ccdcw2021.255. [DOI] [PMC free article] [PubMed] [Google Scholar]
Associated Data
This section collects any data citations, data availability statements, or supplementary materials included in this article.
Supplementary Materials
Figure S1: Map of environmental samples and reported human cases from the Huanan market, Related to Figure 2.
Figure S2: Overview of the SARS-CoV-2 positive samples and the animal mtDNA detection in SARS-CoV-2 positive samples, Related to Figure 2.
(A) SARS-CoV-2 stall positivity for samples collected Jan 1–12. (B) Mammalian wildlife mtDNA abundances in SARS-CoV-2 positive samples in and nearby wildlife stall A and wildlife stall B. (C) SARS-CoV-2 qPCR Ct values by date of sampling. *: Ct values were not recorded by Liu et al. for the January 12th samples (3 were positive by qPCR). Two Ct values are available for the February 20th sample. Data from Liu et al. Supplementary Table 2.
Figure S3: Methodological benchmarking of mtDNA detection, Related to Figure 3.
(A) Specificity and specificity of in silico benchmarking of the mitochondrial mapping approach used in this study. (B) Abundances of mitochondrial DNA from humans and key wildlife species in samples from Wildlife Stall A with and without including mitochondrial rRNA regions.
Figure S4: Spearman correlations between animal species abundances and SARS-CoV-2 reads in different sample sets, Related to Figure 3.
The estimated Spearman correlation coefficient and its 95% CI are shown for species detected in 3 or more samples collected on January 1st, January 12th, or either date. Highlighted points have uncorrected p-values below 0.05.
Figure S5: Viral abundances within 5 SARS-CoV-2 positive samples from a wildlife stall, Related to Figure 4.
Figure S6: Phylogenetic tree of all raccoon dog cytochrome B sequences in this study, Related to Figure 5.
Sequences are labeled by the locale of the sample origin. Study codes for the 38 raccoon dog individuals sequenced by Lam et al. are used for these sequences without accession numbers (H1-H38).
Figure S7: Sequencing read abundances for the common raccoon dog (Nyctereutes procyonoides) and masked palm civet (Paguma larvata) in wildlife stall A by date of sampling, Related to Figure 2.
Table S1. SARS-CoV-2 genomic data, Related to Figure 1.
A20 SNVs tab: iVar SNVs of sample SRR23971533 (A20). Low-coverage reads tab: Mapping read coordinates of low-coverage SARS-CoV-2 samples in this study. Dec SARS-CoV-2 cases tab: Known early sequenced SARS-CoV-2 cases from December 2019. Early SARS-CoV-2 genomes tab: All early SARS-CoV-2 genomes collected prior to Feb 14, 2020 used in this study. Rooting probabilities tab: Inferred ancestral rooting probabilities of SARS-CoV-2. GISAID acknowledgements tab: GISAID accession numbers of genomes used in this study.
Table S2. Environmental sampling, SARS-CoV-2 positivity, and animal metagenomic data, Related to Figure 2 and Figure 3.
Sample metadata tab: All sample metadata, adapted and extended from (W. J. Liu et al. 2023). Sequencing metadata tab: All sample metadata for sequencing data from BioProject PRJNA948658. SARS-CoV-2 read counts tab: SARS-CoV-2 sequence read counts from each sample. Animal scientific names tab: Scientific and common names of animals referred to in this study. Mammals in SARS-CoV-2 samples tab: Mammalian mtDNA detection in SARS-CoV-2 positive samples. Mammalian mtDNA read counts tab:: Mammalian mtDNA sequence read counts in each sample. Mammalian mtDNA coverage tab: Mammalian mtDNA genome breadth of coverage. Animal mtDNA read counts tab: All animal mtDNA sequence read counts. Animal mtDNA coverage tab: All animal mtDNA genome breadth of coverage. Mammalian counts without rRNA tab: Mammalian mtDNA sequence read counts excluding rRNA regions. BLAST WGS database tab: BLAST WGS database built for transcriptome contig taxonomic assignment. Contig BLAST hits tab: Closest BLAST hits of contigs in SARS-CoV-2 positive samples from wildlife stall A. Comparison to observed tab: Comparison of mammals observed at the Huanan market to mammals detected in environmental sequencing data. Correlations tab: Correlations between SARS-CoV-2 and mammalian mtDNA sequence read abundances. Mitochondrial genomes tab: Statistics of mammalian mtDNA consensus genotypes reconstructed in this study.
Table S3. Viral metagenomic data, Related to Figure 4.
Virus abundances tab: Sequence read abundances and genome coverage of viruses detected in this study. Influenza sequences tab: Sequencing reads mapping to Influenza H9N2.
Data Availability Statement
This paper analyzes existing, publicly available data, primarily from BioProjects PRJNA948658, PRJNA793740 and PRJNA795267, and NCBI accessions OR240356–OR240723 and OR251846–OR251847. Accession numbers for the datasets are listed in the key resources table and in Tables S1–S3.
All original code, along with genome FASTA files, BAM files, and intermediate data files are available at a GitHub repository associated with this work hosted on Zenodo: Zenodo DOI: 10.5281/zenodo.12571327.
Any additional information required to reanalyze the data reported in this paper is available from the lead contact upon request.
Key Resources Table