

Abstract
The importance of lipids in biology continues to grow with their recent linkages to more diseases and conditions, microbiome fluctuations, and environmental exposures. These associations have motivated researchers to evaluate lipidomic changes in numerous matrices and studies. Lipidomic analyses, however, present numerous challenges as lipid species have broad chemistries that require different extraction methods and instrumental analyses to evaluate and separate their many isomers and isobars. Increasing knowledge about different lipid characteristics is therefore crucial for improving their separation and identification. Here, we present a multidimensional database for lipids analyzed on a platform combining reversed-phase liquid chromatography, drift tube ion mobility spectrometry, collision-induced dissociation, and mass spectrometry (RPLC-DTIMS-CID-MS). This platform and the different separation characteristics it provides enables more confident lipid annotations when compared to traditional tandem mass spectrometry platforms, especially when analyzing highly isomeric molecules such as lipids. This database expands on our previous publication containing only human plasma and bronchoalveolar lavage fluid lipids and provides experimental RPLC retention times, IMS collision cross section (CCS) values, and m/z information for 877 unique lipids from additional biofluids and tissues. Specifically, the database contains 1504 precursor [M + H ]+, [M + N H4]+, [M + Na]+, [M-H]−, [M-2H]2−, [M + H COO]−, and [M + CH3COO]− ion species and their associated CID fragments which are commonly targeted in clinical and environmental studies, in addition to being present in the chloroform layer of Folch extractions. Furthermore, this multidimensional RPLC-DTIMS-CID-MS database spans 5 lipid categories (fatty acids, sterols, sphingolipids, glycerolipids, and glycerophospholipids) and 24 lipid classes. We have also created a webpage (tarheels.live/bakerlab/databases/) to enhance the accessibility of this resource which will be populated regularly with new lipids as we identify additional species and integrate novel standards.
Keywords: Lipids, Lipidomics, Ion mobility spectrometry, Collision cross section, Mass spectrometry, Database, Reverse phase liquid chromatography (RPLC)
Introduction
Lipids are hydrophobic or amphipathic biomolecules that are insoluble in water but soluble in organic solvents [1]. This broad molecular classification results in tens of thousands of molecules falling under this definition. LIPID MAPS, a consortium that aims to classify and provide nomenclature guidance for lipids, currently contains over 48,000 different lipids with ~ 26,000 curated and ~ 22,000 computationally generated [2]. They have also classified these lipids into eight categories: glycerophospholipids, glycerolipids, fatty acids, sterols, sphingolipids, polyketides, prenols, and saccharolipids [3, 4], of which five are of great interest due to their detection in blood samples (fatty acids, sterols, sphingolipids, glycerolipids, and glycerophospholipids) [3, 4]. Furthermore, each lipid category contains distinct classes and tens to hundreds of species per class. For example, the ~ 10,000 unique lipid species in the glycerophospholipid category in LIPID MAPS are divided into > 25 classes including the glycerophosphocholines, glycerophosphoserines, and glycerophosphoethanolamines [3, 4]. Thus to fully understand lipid biology, it is essential to correctly identify and speciate the lipids observed in lipidomic studies. However, due to the differing extraction methods and instrumentation needed to separate the many isomeric and isobaric lipids, this is still challenging, and more experimental molecular characteristics are greatly needed [5, 6].
Given the significance in nomenclature for establishing the known parts of lipid structure, it is imperative that annotations reflect measurement certainties and uncertainties. To make sure to not over-annotate lipids in experimental studies, lipids should only be annotated as far as analytical evaluation allows [5]. For example, minimum annotations are often at the class level or species level (e.g., class and fatty acyl sum composition such as PC(38:2)) [7]. While tandem mass spectrometry (MS/MS) platforms can aid in headgroup and fatty acyl identification from the fragmentation information and help classify constitutional isomers such as PC(14:1/14:1) and PC(12:1_16:1), speciation can still be difficult [8]. For example, determining sn-positions (sn-1, sn-2, or sn-3) of fatty acyl groups and double bond positions/orientations is quite difficult if advanced analytical methods are not utilized. In some cases, sn-1 and sn-2 position fatty acyl isomers, such as lysophospholipids, can be determined using liquid chromatography (LC) before MS/MS [9]. However, other common techniques such as silver chromatography [10], chemical modifications (e.g., ozone-induced dissociation [11] and Paternò–Büchi reaction [12]), and advanced fragmentation approaches [13, 14] are needed, but often require instrument modifications or extremely time-consuming data analysis [5, 7].
While many lipid databases exist online, most only include LC retention times and m/z values for precursor and fragment peaks. One analytical technique that has been helpful for lipid class and isomer analysis is ion mobility spectrometry (IMS). IMS separates ions by their size, shape, and charge state by assessing the time it takes each ion to drift through a cell filled with a buffer gas (typically nitrogen) [15]. These drift times can then be used to calculate ion-neutral collision cross section (CCS) values using the Mason-Schamp Eq. [16]. Given the reproducibility of CCS values, the integration of IMS can be highly beneficial across laboratories for putative identifications. Furthermore, IMS can also be coupled between LC and MS separations, providing multidimensional separation characteristics for each molecule, thereby providing more confident lipid identifications, increased specificity, and greater accuracy in reporting [17]. While different databases exist for lipids, more molecular knowledge is still greatly needed due to the cost and shortage of lipid standards. For example, an individual lipid standard may cost $200 to over $1000, and as there are thousands of lipids with isomers differing only in double bond positions and geometries, it becomes impossible to procure a standard for each possible identification present in each sample. To address this problem, computationally predicted spectra and theoretically calculated CCS values are currently needed but are still just estimates based off existing experimental numbers. Therefore, our database provides more experimental data from multiple, real-world matrices, making the observed data more applicable for the user and aiding in the accuracy of theoretical calculations. Additionally, while observed LC retention times are known to fluctuate due to changes in matrix composition [18], CCS values do not. Thus, here we expand on our previous human plasma and bronchoalveolar lavage fluid (BALF) multidimensional lipidomic database [17, 19] using the same instrument method to provide experimental RPLC retention times, IMS CCS values, and precursor and fragment m/z information for 877 unique lipids from additional biofluid and tissue samples, in addition to creating a webpage for regular updates as new lipid values are acquired.
Materials and methods
Lipid extraction
Collected human plasma, California sea lion plasma, fruit fly and zebrafish tissues, and purchased samples of NIST SRM 1950 human plasma (Gaithersburg, MD), Avanti Polar Lipids (Alabaster, AL) extracts (brain polar extract, brain PS extract, and egg PG extracts) and individual heavy labeled standards from Avanti Polar Lipids (Alabaster, AL) were analyzed for the composition of this database, which builds on the work done by Kirkwood et al., where only human plasma and human bronchoalveolar lavage fluid (BALF) were analyzed [17, 19]. All solvents for the current study were purchased from Thermo Fisher Scientific (Waltham, MA). The same modified Folch extraction [20] procedure utilized in the previous study [17] was performed for the NIST SRM 1950 metabolites in frozen human plasma (Gaithersburg, MD) and sea lion plasma. All the heavy labeled standards from Avanti Polar Lipids (Alabaster, AL) were spiked into 50 μL of the NIST SRM 1950 metabolites in frozen human plasma (Gaithersburg, MD) prior to extraction. Briefly, for these two sample sets, 50 μL of plasma was transferred to a 1.7 mL Sorenson SafeSeal™ Microcentrifuge tube (Waltham, MA) with 600 μL of 2:1 chloroform/LC–MS grade methanol at − 20 °C. The samples were vortexed for 30 s at 1200 rpm using a Digital Vortex Mixer (Thermo Scientific; Waltham, MA), and then 150 μL of LC–MS grade water was added, prior to mixing again for 30 s. The samples were left at room temperature for 5 min to allow for phase separation of the methanol and chloroform layers, and then the tubes were centrifuged at 12,000 rpm for 10 min at 4 °C. The bottom organic layer was removed (100 μL), and then the samples were dried down using a SpeedVac vacuum concentrator (Thermo Fisher Scientific; Waltham, MA). Reconstitution consisted of 10 μL of chloroform and 190 μL of methanol after which the extracts were stored in 2-mL amber glass LC autosampler vials fitted with glass inserts (Agilent Technologies; Santa Clara, CA) at − 20 °C until analysis (< 1 week). For the fruit fly and zebrafish tissues, a similar approach was used except ~ 25 fruit flies or 25 mg of zebrafish tissue were placed into 4-mL glass vials (Thermo Fisher Scientific, Waltham, MA), and their tissue was homogenized. Next, the same ratio of chloroform–methanol-water was used to extract the lipids, and the same steps from the modified Folch extraction previously described were performed except additional wait times was added for extraction of the lipids from the tissue [17, 21]. The Avanti Polar Lipids (Alabaster, AL) extracts (Egg PG extract, Brain Polar, and Brain PS) were aliquoted as is into LC vials.
Instrumentation
Lipid analyses were conducted using a previously described untargeted platform combining liquid chromatography, ion mobility spectrometry, collision-induced dissociation, and mass spectrometry (LC-IMS-CID-MS) [17]. This analysis was performed on an Agilent 1290 Infinity UPLC system (Agilent Technologies; Santa Clara, CA) coupled to an Agilent 6560 IM-QTOF platform (Agilent Technologies; Santa Clara, CA) with a commercial gas kit and a MKS Instruments precision flow controller (Andover, MA). For the evaluations, 10 μL of each sample injected onto a Waters Acquity UPLC CSH™ C18 column (Milford, MA) (3.0 mm × 150 mm × 1.7 μm particle size) where MPA consisted of 40:60 LC–MS grade ACN/H2O and 10 mM ammonium acetate and MPB consisted of 90:10 LC–MS grade IPA/ACN with 10 mM ammonium acetate. The 34-min LC gradient and 4-min column wash are outlined in Table 1. For the drift tube IMS-MS analyses, an Agilent Jet Stream ESI source was operated in both positive and negative ionization modes. The funnel trap fill time was set to 10 ms, and the release time was set to 400 μs. Directly after drift time separation in nitrogen, a data-independent all ions approach was utilized in the collision cell with a fragmentation ramp based on the precursor ions drift time [22]. The ramp was as follows (drift time (ms): collision energy (V)): 0:10, 15:14, 19:27, 25:45, 40:52, and 50:58. The quadrupole time-of-flight (QTOF) mass spectrometer then evaluated ions from 50 to 1700 m/z. The whole analysis generated.d files with the multidimensional LC, IMS, CID, and MS data. The files were single-field calibrated in Agilent MassHunter Workstation Software IMS-MS Browser v.B.10.00 using an Agilent ESI-L Low Concentration tuning mix solution.d file that was collected immediately before data acquisition (Agilent Technologies; Santa Clara, CA).
Table 1.
Reversed-phase liquid chromatography gradient and column wash
| Time (min) | % MPB | Flow rate (mL/min) |
|---|---|---|
|
| ||
| Elution gradient | ||
| 0 | 40 | 0.25 |
| 2 | 50 | 0.25 |
| 3 | 60 | 0.25 |
| 12 | 70 | 0.25 |
| 15 | 75 | 0.25 |
| 17 | 78 | 0.25 |
| 19 | 85 | 0.25 |
| 22 | 92 | 0.25 |
| 25 | 99 | 0.25 |
| 34 | 99 | 0.25 |
| Column wash | ||
| 34.5 | 40 | 0.3 |
| 35 | 99 | 0.3 |
| 35.5 | 99 | 0.3 |
| 36 | 40 | 0.35 |
| 37 | 40 | 0.3 |
| 38 | 40 | 0.25 |
Lipid identification
The single-field calibrated raw.d files for each ionization mode were imported into Skyline software (Skyline-daily 20.2.1.315–23.1.1.425) [23] where putative lipid identifications were made. The untargeted data files were assessed with a target list containing the lipid class, precursor name, precursor neutral formula, precursor adduct, product name, product neutral formula, and product adduct information which was imported into Skyline [23] using a software called Lipid Creator [24]. For the lipids not included in Lipid Creator, the same information was imported from a.csv file, and the products were decided based on the lipid fragmentation literature [25]. The ion mobility resolving power window in Skyline was then set to 50, and CCS values were calculated using Skyline’s ion mobility library feature and exported for addition to the lipid database [23]. Fragment ions which have slightly higher drift times due to their added energy in the collision cell had a high energy drift time offset set of − 0.5 ms applied. The QTOF resolving power window was set to 20,000. All experimentally evaluated precursor ions in the database had a mass error of less than 5 ppm and the expected precursor isotopic distribution. Retention times were validated based on the expected order of lipid fatty acyl elution on a reversed-phase LC gradient, as well as co-elution of targets with adducts present.
Results and discussion
In this study, we utilized a LC-DTIMS-CID-MS platform to create a multidimensional database for lipids identified in collected human plasma, NIST SRM 1950 (human plasma (Gaithersburg, MD)), fruit flies, zebrafish, California sea lion plasma, and Avanti Polar Lipids (Alabaster, AL) standards and extracts. This database is an expansion of the lipid database from Kirkwood et al. in 2022 which only contained lipids found in human plasma and BALF [17, 19]. This database therefore provides information on an additional 361 lipids, of which 23 are heavy labeled internal standards commonly used by the lipidomics community. Additionally, the new lipid values include 6 additional classes (e.g., cardiolipin (CLs), lysophosphatidylethanolamine alkyl ether/plasmalogen (LPE O/Ps), phosphatidylglycerols (PGs), lysophosphatidylglycerols (LPGs), lysophosphatidylinositols (LPIs), and phosphatidylserines (PSs)) and great expansions on classes such as the gangliosides, phosphatidic acids (PAs), and phosphatidylinositols (PIs). For all new and pre-existing entries, this database contains RPLC retention times, m/z values for both precursor and fragment ions, and CCS values for 877 unique lipids identified from the plasma and tissue samples. Collectively, these span 5 of the 8 lipid categories: fatty acids, sterols, sphingolipids, glycerolipids, and glycerophospholipids and 24 lipid classes (Fig. 1). These 877 unique lipids also correlate with 1504 precursor ion species from [M + H ]+, [M + NH4]+, [M + Na]+, [M − H]−, [M − 2H]2−, [M + HCOO]−, and [M + CH3COO]− ion types observed in both positive and negative ionization modes (114 lipids were observed in both modes) (Table S1). To provide regular updates of this information, we have also created a webpage (tarheels.live/bakerlab/databases) so our most current multidimensional lipid database can be downloaded as an Excel workbook for direct use in Skyline [23], used as a resource for building target lists in different lipid analysis software, or incorporated into untargeted software such as MS-DIAL [23, 26] for annotating features. Additionally, release notes will be provided on this webpage every time alterations to the databases are made so the lipidomic and scientific communities are informed of the date of each change.
Fig. 1.
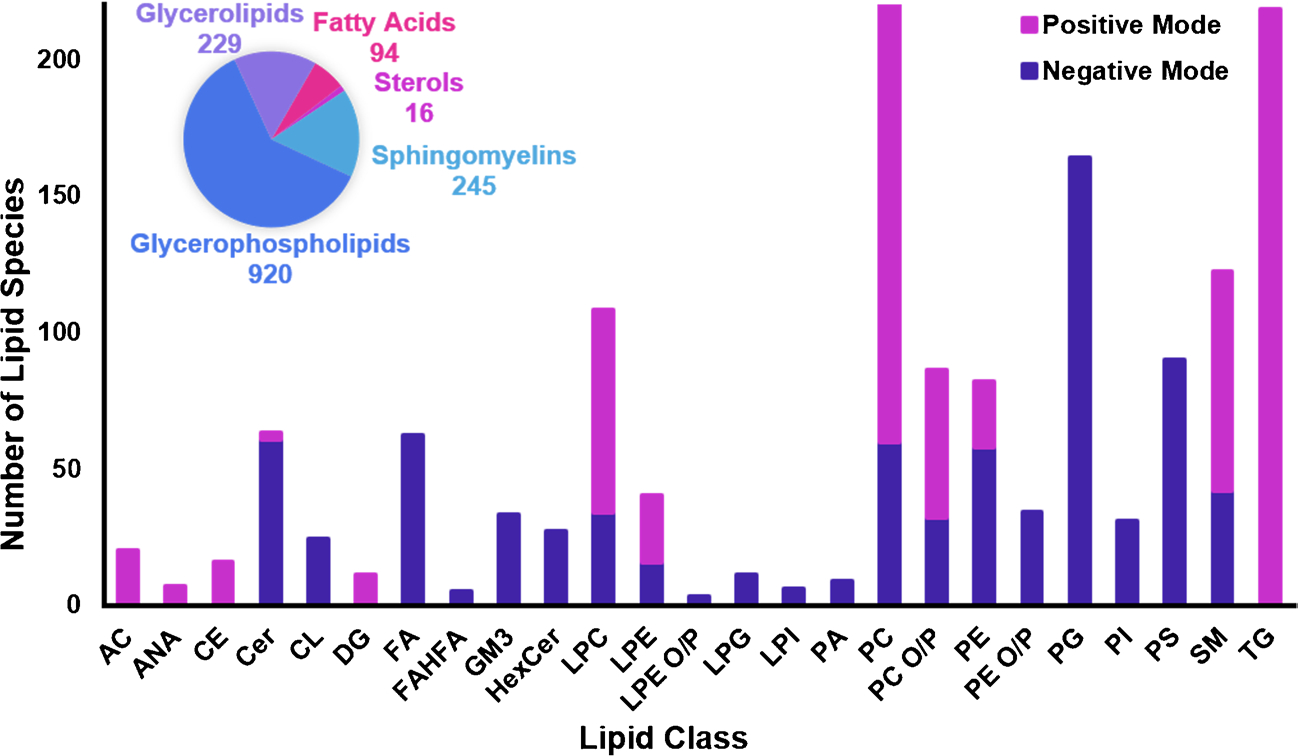
RPLC-IMS-CID-MS lipid database information. This database contains 1504 precursor ion species from 877 unique lipids from five lipid categories (pie chart) and 24 classes abbreviated in the stacked bar graph. Class abbreviations are defined in the “Abbreviation” section of the manuscript. Ion species are given for both ionization modes with positive mode species in magenta and negative mode in purple
For further information on the lipid entries, the putative lipid identifications in the database were made using LIPID MAPS naming conventions [3]. More specifically, lipids with fatty acyl tails assigned in the database had fragment ions observed that were drift time aligned to the precursor ion, mass error less than 5 ppm, and were denoted with a “/” if the sn-position was assigned or “_” if the sn-position was unknown. Lipids with a “;” between two or more species were specified due to CID data indicating multiple fatty acyl tail compositions present. If a lipid had more than one extracted ion chromatogram, the assignment included “a,” “b,” or “c” to indicate the order in which they were observed. Geometry and position of double bond isomers were not annotated due to instrument limitations. Lipids that did not have fatty acyl fragment peaks but had a precursor ion and head group fragment ion (and that met the criteria above) were reported by class and fatty acyl sum compositions.
When assessing the multidimensional information in the database, it is known that the LC, IMS, CID, and MS dimensions provide important lipid characterization properties for lipid classification and identification. For example, trendlines of CCS versus m/z can be plotted to differentiate lipids from other biomolecules and even lipid classes from each other (Fig. 2) [27–29]. These trendlines can also be utilized to predict lipids computationally and should be investigated further for lipid discovery. For example, information for unknown features from untargeted studies can be plotted on the trendline to determine if it fits into a specific lipid class. Additionally, size information also gives hits as the structures and types of lipids such as smaller lipids (anandamides and fatty acids) occurring where the CCS and m/z values are lower and larger such as triglycerides and gangliosides at the highest CCS and m/z values plotted. Notably, the doubly charged cardiolipins and gangliosides also clustered together above the singly charged trendline in the negative mode plot. Other associations of interests are how each class has specific mass defects, unsaturation in the fatty acyls reduce CCS values per each trendline, and adduction of N H4 and Na cause class specific CCS shifts [29]. The IMS and MS characteristics therefore provide unique opportunities for locating new lipids and adducts where gaps exist. Of potential exploration interest is the gap between the lysophosphatidylcholines (LPCs) and diglycerides (DGs) in the positive mode trendline (starting at an m/z of ~ 600 and CCS of ~ 250 Å2). We feel this is uncharted territory and deserves further investigation, as there may be LPCs with longer acyl chain lengths or less degrees of unsaturation in this area [29]. Similarly, our database only contains a few identified DGs, so there may be other DGs with smaller acyl tail chain lengths and more degrees of unsaturation we have not detected yet [29]. Furthermore, using this database with Skyline [23] only enables targeted data analysis, so untargeted analyses will be necessary. The negative mode trendline also illustrates a gap between the PIs and the singly charged gangliosides (starting at an m/z of ~ 950 and CCS of ~ 300 Å2). Again, untargeted data analysis provides a unique opportunity to assess these regions of the nested IMS-MS spectra to search for lipids not already in the database and potentially unknown to the field. Thus, the RPLC-DTIMS-CID-MS library will provide researchers with new information for their studies and theoretical evaluations, and each dimension can be collapsed if other instrumental studies are desired.
Fig. 2.
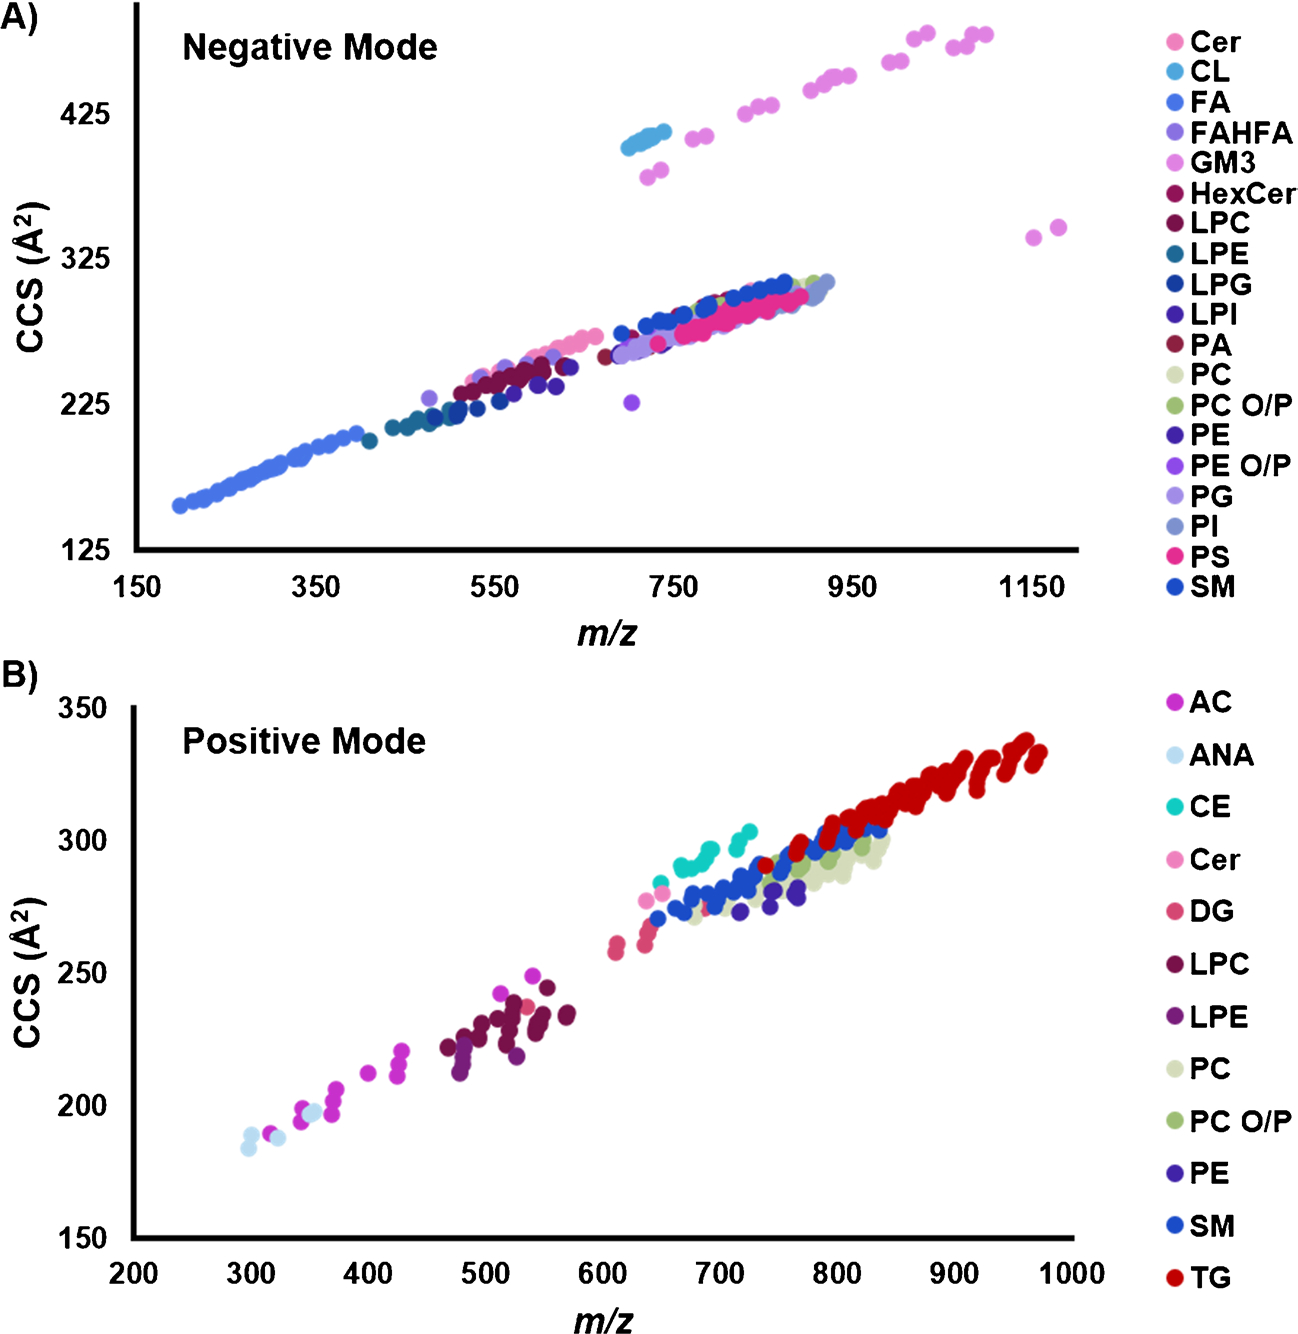
Collision cross section (CCS) versus m/z trendlines of all the unique lipids in the database. Lipids species in both A negative ionization mode and B positive mode illustrate unique lipid class relationships
Conclusions
This work provides access to LC, IMS, and MS characteristics for 1504 precursor [M + H]+, [M + NH4]+, [M + Na]+, [M − H]−, [M − 2H]2−, [M + HCOO]−, and [M + CH3COO]− ion species and their associated fragment ions. The detailed multidimensional RPLC-DTIMS-CID-MS database contains RPLC retention times, m/z values for precursor and fragment ions, and CCS values for 877 unique lipids from 5 lipid categories (fatty acids, sterols, sphingolipids, glycerolipids, and glycerophospholipids) and 24 lipid classes. It also provides 361 additional unique lipids since the original multidimensional human plasma and BALF database publication in 2022 [17, 19]. While this database was built using a specific RPLC gradient, and platform with DTIMS and CID, these values could pertain to other RPLC gradient lengths and IMS instruments. Additionally, each separation dimension can be ignored if not required by the researcher. To provide access to this resource of experimentally validated lipids, the RPLC-DTIMS-CID-MS database will be regularly updated at the webpage (tarheels.live/bakerlab/databases/) to enable accessibility to our values as more identifications are made and new chemical standards are studied. Future implementations of this database could also include adding values from others. Therefore, the multidimensional database will serve as an important resource to the lipidomic community by providing new experimental lipidomic characteristics, improving identification confidence, and enabling better theoretical predictions, biological interpretations, and informative pathway analyses.
Supplementary Material
Funding
This work was funded by grants from the National Institute of Environmental Health Sciences (P42 ES027704), the National Institute of General Medical Sciences (R01 GM141277 and RM1 GM145416), and a cooperative agreement with the Environmental Protection Agency (STAR RD 84003201). This research was supported in part by the Intramural Research Program of the NIH (ZIC ES103363). The views expressed in this manuscript do not reflect those of the funding agencies.
Abbreviations
- FA
Fatty acid
- FAHFA
Fatty acyl esters of hydroxy fatty acid
- PE
Phosphatidylethanolamine
- DG
Diacylglycerol
- TG
Triacylglycerol
- CE
Cholesterol ester
- CL
Cardiolipin
- PC
Phosphatidylcholine
- PE
O/P Phosphatidylethanolamine alkyl ether/plasmalogen
- PG
Phosphatidylglycerol
- PS
Phosphatidylserine
- HexCer
Hexosylceramide
- PI
Phosphatidylinositol
- SM
Sphingomyelin
- PA
Phosphatidic acid
- AC
Acylcarnitine
- ANA
Anandamide
- GM3
GM3 ganglioside
- Cer
Ceramide
- prefix L (e.g., in LPC)
Lyso
Footnotes
Declarations
Conflict of interest The authors declare no competing interests.
Published in the topical collection New Trends in Lipidomics with guest editor Michal Holčapek.
Supplementary Information The online version contains supplementary material available at https://doi.org/10.1007/s00216-024-05351-4.
References
- 1.Park J, Choi J, Kim D-D, Lee S, Lee B, Lee Y, et al. Bioactive lipids and their derivatives in biomedical applications. Biomolecules & Therapeutics. 2021;29(5):465–82. [DOI] [PMC free article] [PubMed] [Google Scholar]
- 2.LIPID MAPS® Structure Database (LMSD) [Available from: https://www.lipidmaps.org/databases/lmsd/overview]. [DOI] [PMC free article] [PubMed] [Google Scholar]
- 3.Fahy E, Subramaniam S, Murphy RC, Nishijima M, Raetz CRH, Shimizu T, et al. Update of the LIPID MAPS comprehensive classification system for lipids. JLR. 2009;50(Supplement):S9–14. [DOI] [PMC free article] [PubMed] [Google Scholar]
- 4.Fahy E, Cotter D, Sud M, Subramaniam S. Lipid classification, structures and tools. BBA - Mol Cell Biol Lipids. 2011;1811(11):637–47. [DOI] [PMC free article] [PubMed] [Google Scholar]
- 5.Köfeler HC, Ahrends R, Baker ES, Ekroos K, Han X, Hoffmann N, et al. Recommendations for good practice in MS-based lipidomics. JLR. 2021;62:100138. [DOI] [PMC free article] [PubMed] [Google Scholar]
- 6.Liebisch G, Ahrends R, Arita M, Arita M, Bowden JA, Ejsing CS, et al. Lipidomics needs more standardization. Nat Metab. 2019;1(8):745–7. [DOI] [PubMed] [Google Scholar]
- 7.Triebl A, Hartler J, Trötzmüller M. Köfeler CH (2017) Lipidomics: prospects from a technological perspective. BBA - Mol Cell Biol Lipids. 1862;8:740–6. [DOI] [PMC free article] [PubMed] [Google Scholar]
- 8.Koelmel JP, Ulmer CZ, Jones CM, Yost RA, Bowden JA. Common cases of improper lipid annotation using high-resolution tandem mass spectrometry data and corresponding limitations in biological interpretation. BBA - Mol Cell Biol Lipids. 2017;1862(8):766–70. [DOI] [PMC free article] [PubMed] [Google Scholar]
- 9.Zheng X, Smith RD, Baker ES. Recent advances in lipid separations and structural elucidation using mass spectrometry combined with ion mobility spectrometry, ion-molecule reactions and fragmentation approaches. COCHBI. 2018;42:111–8. [DOI] [PMC free article] [PubMed] [Google Scholar]
- 10.Morris LJ. Separations of lipids by silver ion chromatography. JLR. 1966;7(6):717–32. [PubMed] [Google Scholar]
- 11.Poad BLJ, Pham HT, Thomas MC, Nealon JR, Campbell JL, Mitchell TW, et al. Ozone-induced dissociation on a modified tandem linear ion-trap: observations of different reactivity for isomeric lipids. JASMS. 2010;21(12):1989–99. [DOI] [PubMed] [Google Scholar]
- 12.Kumarasamy E, Raghunathan R, Kandappa SK, Sreenithya A, Jockusch S, Sunoj RB, et al. Transposed Paternò-Büchi Reaction. J ACS. 2017;139(2):655–62. [DOI] [PubMed] [Google Scholar]
- 13.Cody RB, Freiser BS. Electron impact excitation of ions from organics: an alternative to collision induced dissociation. Anal Chem. 1979;51(4):547–51. [Google Scholar]
- 14.Brodbelt JS, Morrison LJ, Santos I. Ultraviolet photodissociation mass spectrometry for analysis of biological molecules. Chem Rev. 2020;120(7):3328–80. [DOI] [PMC free article] [PubMed] [Google Scholar]
- 15.Dodds JN, Baker ES. Ion mobility spectrometry: fundamental concepts, instrumentation, applications, and the road ahead. JASMS. 2019;30(11):2185–95. [DOI] [PMC free article] [PubMed] [Google Scholar]
- 16.Stow SM, Causon TJ, Zheng X, Kurulugama RT, Mairinger T, May JC, et al. An interlaboratory evaluation of drift tube ion mobility–mass spectrometry collision cross section measurements. Anal Chem. 2017;89(17):9048–55. [DOI] [PMC free article] [PubMed] [Google Scholar]
- 17.Kirkwood KI, Christopher MW, Burgess JL, Littau SR, Foster K, Richey K, et al. Development and application of multidimensional lipid libraries to investigate lipidomic dysregulation related to smoke inhalation injury severity. JPR. 2022;21(1):232–42. [DOI] [PMC free article] [PubMed] [Google Scholar]
- 18.Fang N, Yu S, Ronis MJ, Badger TM. Matrix effects break the LC behavior rule for analytes in LC-MS/MS analysis of biological samples. EBM. 2015;240(4):488–97. [DOI] [PMC free article] [PubMed] [Google Scholar]
- 19.Kirkwood KI, Pratt BS, Shulman N, Tamura K, Maccoss MJ, Maclean BX, et al. Utilizing Skyline to analyze lipidomics data containing liquid chromatography, ion mobility spectrometry and mass spectrometry dimensions. Nat Protoc. 2022;17(11):2415–30. [DOI] [PMC free article] [PubMed] [Google Scholar]
- 20.Folch J, Lees M, Stanley GHS. A simple method for the isolation and purification of total lipides from animal tissues. J BC. 1957;226(1):497–509. [PubMed] [Google Scholar]
- 21.Odenkirk MT, Horman BM, Dodds JN, Patisaul HB, Baker ES. Combining micropunch histology and multidimensional lipidomic measurements for in-depth tissue mapping. ACS Measurement Science Au. 2022;2(1):67–75. [DOI] [PMC free article] [PubMed] [Google Scholar]
- 22.Feuerstein ML, Kurulugama RT, Hann S, Causon T. Novel acquisition strategies for metabolomics using drift tube ion mobility-quadrupole resolved all ions time-of-flight mass spectrometry (IM-QRAI-TOFMS). Anal Chim Acta. 2021;1163:338508. [DOI] [PubMed] [Google Scholar]
- 23.MacLean B, Tomazela DM, Shulman N, Chambers M, Finney GL, Frewen B, et al. Skyline: an open source document editor for creating and analyzing targeted proteomics experiments. Bioinformatics. 2010;26(7):966–8. [DOI] [PMC free article] [PubMed] [Google Scholar]
- 24.Peng B, Kopczynski D, Pratt BS, Ejsing CS, Burla B, Hermansson M, et al. LipidCreator workbench to probe the lipidomic landscape. Nat Commun. 2020;11(1). [DOI] [PMC free article] [PubMed] [Google Scholar]
- 25.Murphy RC. Tandem mass spectrometry of lipids: RSC; 2014.
- 26.Tsugawa H, Cajka T, Kind T, Ma Y, Higgins B, Ikeda K, et al. MS-DIAL: data-independent MS/MS deconvolution for comprehensive metabolome analysis. Nat Methods. 2015;12(6):523–6. [DOI] [PMC free article] [PubMed] [Google Scholar]
- 27.Kim HI, Kim H, Pang ES, Ryu EK, Beegle LW, Loo JA, et al. Structural characterization of unsaturated phosphatidylcholines using traveling wave ion mobility spectrometry. Anal Chem. 2009;81(20):8289–97. [DOI] [PMC free article] [PubMed] [Google Scholar]
- 28.Fenn LS, Mclean JA. Biomolecular structural separations by ion mobility–mass spectrometry. ABC. 2008;391(3):905–9. [DOI] [PubMed] [Google Scholar]
- 29.Leaptrot KL, May JC, Dodds JN, Mclean JA. Ion mobility conformational lipid atlas for high confidence lipidomics. Nat. Commun. 2019;10(1). [DOI] [PMC free article] [PubMed] [Google Scholar]
Associated Data
This section collects any data citations, data availability statements, or supplementary materials included in this article.