Abstract
Diffuse optical tomography (DOT) enhances the localization accuracy of neural activity measured with electroencephalography (EEG) while preserving EEG’s high temporal resolution. However, the spatial resolution of reconstructed activity diminishes for deeper neural sources. In this study, we analyzed DOT-enhanced EEG localization of neural sources modeled at depths ranging from 11-25 mm in simulations. Our findings reveal systematic biases in reconstructed depth related to DOT channel length. To address this, we developed a data-informed method for selecting DOT channels to improve the spatial accuracy of DOT-enhanced EEG reconstruction. Using our method, the average absolute reconstruction depth errors of DOT reconstruction across all depths are 0.9 ± 0.6 mm, 1.2 ± 0.9 mm, and 1.2 ± 1.1 mm under noiseless, low-level noise, and high-level noise conditions, respectively. In comparison, using fixed channel lengths resulted in errors of 2.6 ± 1.5 mm, 5.0 ± 2.6 mm, and 7.3 ± 4.5 mm under the same conditions. Consequently, our method improved the depth accuracy of DOT reconstructions and facilitated the use of more accurate spatial priors for EEG reconstructions, enhancing the overall precision of the technique.
1. Introduction
Electroencephalography (EEG) is a non-invasive neural imaging technique that measures voltage changes due to neural activities on the scalp. While it offers high temporal resolution on the order of milliseconds, its spatial resolution is limited to centimeters [1]. This limitation arises because brain tissues act as a low-pass filter spatially, causing voltage changes from the cortex to spread rapidly to detectors on the scalp [2]. In contrast, diffuse optical tomography (DOT), another non-invasive neural imaging technique, has high spatial resolution on the order of millimeters but limited temporal resolution on the order of seconds [3,4]. By shining near-infrared light into the brain via sensors placed on the scalp, DOT can perform 3D reconstruction of neural activity-induced localized hemoglobin concentration changes using optical data from multiple channels. Thus, combining EEG and DOT could provide simultaneous high spatial and temporal resolution in functional neuroimaging [5,6].
EEG source localization identifies the origin of neural activity within the brain, providing significant clinical benefits such as epilepsy diagnosis and surgical planning, brain-computer interfaces, and cognitive and behavioral research [7]. However, the process remains challenging because localizing neural activity from billions of neurons based on small-amplitude voltage changes at dozens of detectors is an ill-posed problem, often resulting in significant localization errors [2].
Previous research has shown that EEG source localization can be improved by incorporating spatial priors from modalities such as functional magnetic resonance imaging (fMRI) [8], and positron emission tomography (PET) [9]. However, both fMRI and PET suffer from high cost, limited accessibility, and relatively poor temporal resolution [10–12]. Additionally, the noisy nature of PET data [13] and the exposure to ionizing radiation [14] adds limitations to the application of PET. The indirect relationship between fMRI signals and neural activity [15], and low temporal resolution, pose challenges for accurate EEG source localization [16]. Hemodynamic signals as measured by DOT are also indirectly linked to neural activity. The signals are related to EEG signals via neurovascular coupling [17]. Eggebrecht et al. demonstrated that high-density DOT can map cortical brain function across a wide field of view, achieving image quality comparable to fMRI with higher temporal resolution [3,18], indicating that DOT could serve as an effective spatial prior for EEG, which can be measured simultaneously.
In our previous simulation studies [5] and human experiments [6], we demonstrated enhanced EEG source localization using DOT reconstruction as a spatial prior in the somatosensory and the visual cortex. However, neural activations in the visual cortex are closer to the scalp surface (∼10 -15 mm) as compared to those in other regions, such as the auditory cortex (∼15 -30 mm) [19]. DOT is known to have limited depth sensitivity (∼30 mm) [20] because photon density decays exponentially from the scalp surface. Additionally, it has been shown that DOT reconstruction worsens with increased neuronal activation depth [20–23]. Thus, it is crucial to ensure that DOT functions effectively at varying depths and to evaluate how the performance of the DOT-enhanced EEG algorithm changes as neural sources move deeper into the brain. To increase the depth accuracy of DOT reconstruction and preserve the function of DOT priors, a data-informed selective channel method is proposed here for higher spatial accuracy.
In this work, we propose a data-informed method to select the optimal channel (source/detector) length for a more accurate DOT reconstruction in terms of recovered depth accuracy. For this purpose, we conducted a simulation study. Applying this algorithm to EEG and DOT simulations, we then present the performance of this DOT-enhanced EEG algorithm as a function of neural source depth in the auditory cortex. We found that by optimizing the channel length used in DOT reconstruction, the accuracy of neural activity depth reconstruction is improved without sacrificing spatial resolution. The combination of optimized DOT and EEG thus improves both the spatial resolution and localization accuracy of EEG reconstruction even in deeper regions, such as the auditory cortex.
2. Methods
We simulated functional activation at nine different depths. We assumed that neural and vascular changes are co-localized. We reconstructed the location of vascular changes using DOT, and used these derived DOT spatial prior for EEG neural activity reconstruction. In this work, we simulated EEG signals by modeling current from neuron activation and DOT signals by modeling changes in absorption of near-infrared light caused by neurovascular coupling in the activation region.
2.1. Forward modeling
2.1.1. Mesh generation
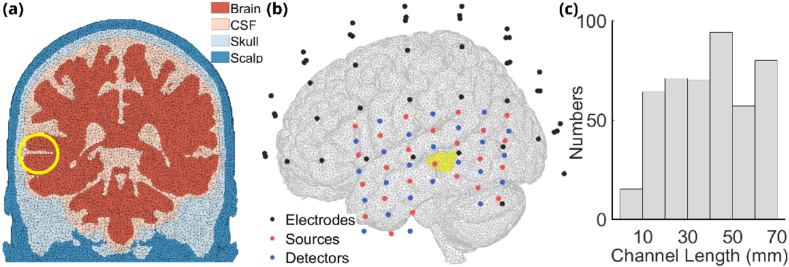
The head model used in this work was segmented from ICBM152 2009c Nonlinear Asymmetric brain atlas [24]. Four layers of brain tissue were included: brain, cerebrospinal fluid (CSF), skull and scalp with clear sulci and gyri in the segmentation. A mesh for computational models using Finite Elements was generated based on the segmented head model using iso2mesh toolbox [25]. There were 2,171,485 linear tetrahedra in the four-layer head model layer with an average element volume of 1.76 cubic millimeter, consisting of 364,280 nodes, among which 101,154 are inside the brain. The thickness of the skull and the scalp covering the auditory cortex were 6 mm and 5 mm, respectively which is consistent with literature values [26,27]. Figure 1(a) shows the coronal plane of one slice of the mesh.
Fig. 1.
(a) One coronal slice of the head mesh containing four layers: brain, CSF, skull, scalp. Neural activities were modeled in superior temporal sulcus inside the yellow circle. (b) Placements of electrodes and DOT probes. Black dots represent the locations of EEG electrodes, red and blue dots represent the locations of DOT sources and detectors. Yellow region shows the area where neural activities were modeled. (c) Histogram of DOT channel lengths up to 70 mm.
The EEG simulation was implemented on a boundary element model (BEM), which was interpolated from the finite element model (FEM) of the head mesh, accounting for the fact that EEG electrodes detect electric signals emanating from the brain cortex surface. Given the pronounced gyri and sulci in the brain region of the head model, the depth of reconstruction from neural activities to the scalp varies significantly across different neural sources in the BEM. For DOT simulation, the neural sources and reconstructions were first implemented on FEM and then interpolated to BEM when using as spatial priors considering that hemodynamic response changes occur throughout the brain's vascular system.
2.1.2. EEG forward modeling
The EEG forward model was generated on the BEM from Section 2.1.1. SimBio in FieldTrip toolbox [28,29] was used for the generation of the forward model. The placement of the electrodes followed the placement of the 10-05 system containing 64 channels [30] as shown with black dots in Fig. 1(b). The electric resistance of the four layers [Rbrain: RCSF: Rskull: Rscalp = 1 :1/5 :80 :1] [Ω] corresponded to literature values [5,31]. The forward model can be defined in the linear form,
| (1) |
where Y represents the measured signals on the scalp, H represents the forward matrix, x represents the neural activities and represents EEG measurement noise.
2.1.3. DOT forward modeling
The DOT forward model was generated from NIRFASTer [31] toolbox using FEM of the head model defined above. High-density DOT optodes, consisting of 29 sources and 29 detectors (shown in Fig. 1(b) - red and blue dots), were placed on the scalp of the left hemisphere, ensuring complete coverage of the temporal lobe. A total of 451 source-detector (channel) distances, ranging from 7 mm to 70 mm were used for the simulation, the distribution of which is shown in Fig. 1(c). For this work, one wavelength of 850 nm was used for the baseline optical properties of each tissue (Table 1, [5]) and simulation of absorption only changes due to the functional activations were considered. Optical detectors collect intensity which can be converted to changes in optical densities.
Table 1. Optical Properties of DOT Forward Model.
| Tissue Type | Brain | CSF | Skull | Scalp | |
|---|---|---|---|---|---|
| µa(mm-1) | 0.0192 | 0.0040 | 0.0139 | 0.0190 | |
| 850 nm | µ’s(mm-1) | 0.6726 | 0.0100 | 0.8400 | 0.6400 |
The continuous wave (CW) DOT forward model can also be written in a linear form:
| (2) |
where J is the forward matrix, or Jacobian, which describes the relationship between the detected optical signals and hemodynamic responses inside the brain. is changes in absorption coefficients which are caused by neural activities inside the brain. Changes in optical densities, , are defined as
| (3) |
in which I is optical intensity measured from DOT detectors and is baseline intensity. In the simulation, I was modeled with changes in absorption coefficient in neural sources while was modeled under baseline.
2.1.4. Data simulation
We simulated 9 sources (neural and vascular) at different depths along the middle part of the superior temporal sulcus with depths from 11 mm to 25 mm (yellow circle in Fig. 1(a) and yellow region in Fig. 1(b)). For DOT simulation, the sources were hemispheres with a radius of 5 mm each. While for EEG simulation, the voxels on the surface of the same hemispheres were defined as activated voxels. We assumed that electrical signals from neuronal activation and hemodynamic responses are co-localized. For every depth, functional activities are represented with changes in absorption coefficient, . Voxels inside the defined activation area were assigned an increase of 10% in the absorption coefficient (which led to optical density changes, ∂Φ, smaller than 2.5% [3,32–34]), and other voxels stayed at baseline values shown in Table 1. Simulations were run on baseline and activation. Hence, only two time points were considered and no temporal variations in absorption coefficient were considered. For EEG, neural activities were modeled with an increase in current density (1 A/m2, leading to 10 µV voltage changes). The neural sources were selected within the yellow circle in Fig. 1(a) and the yellow region in Fig. 1(b), which is the middle of the superior temporal sulcus.
2.1.5. Realistic noise model
The simulations of EEG and DOT reconstructions were done under both noise-free and noise-added conditions. EEG noise is generated with a zero-mean Gaussian distribution with the standard deviation of 1/20 maximum amplitude of the EEG signals [5]. A total of 30 blocks of EEG signals were averaged and reconstructed for localization for the reducing of randomness.
DOT noise is modeled following literature [22,23]. In the realistic noise model, percentage of changes in noise is randomly generated from a Gaussian distribution with a zero mean and the standard deviation follows
| (4) |
in which n is the standard deviation, r is the DOT source-detector distance and a, b, c, and d are coefficients following literature [22,23] (a = 0.6019, b = 0.01052, c = 9.685e-05, d = 0.1382). With the calculated standard deviation , the noise [% of optical intensity I] follows the Gaussian distribution:
| (5) |
Adding the noise to optical intensity, I, the noise-added changes in optical density, , can be represented as:
| (6) |
which substitutes when modeling DOT signals and reconstructions in noise-added conditions.
Two different noise levels were added to DOT signals by changing the magnitude of n(r) considering the different thickness of skull at different brain regions [27]. Considering the thickness of the skull at the temporal lobe is 1/3 of the thickness of the skull at the occipital lobe, and the thickness of skull highly influences the scattering of photons [35], the standard deviation of low-level noise was defined as 1/3 of the standard deviation of high-level noise with other setting keeping the same. With low-level noise and high-level noise, we tested the influence of the noise level on the performance of the DOT-enhanced EEG algorithm. Under both low-level DOT noise and high-level DOT noise conditions, noise-added signals were generated 30 times and averaged, corresponding to block averaging in experimental data. The same level EEG noise was generated and added to EEG signals under two DOT noise levels.
2.2. Inverse modeling
Inverse modeling is divided into three parts: EEG inverse model, DOT inverse model and the combination of DOT priors and EEG reconstruction. The algorithm was developed previously and is described in Cao et al. [5].
The EEG inverse model is implemented using Tikhonov regularization [36]:
| (7) |
in which is the Tikhonov regularization parameter for EEG reconstruction [5,6].
The DOT inverse problem follows the Moore-Penrose generalized inverse [18].
| (8) |
in which is the Jacobian matrix after spatially regularization:
| (9) |
and are parameters in Tikhonov regularization parameter and spatially variant regularization with and [18,22].
The combination of DOT priors and EEG reconstruction is fulfilled using restricted maximum like hood (ReML) [37,38]:
| (10) |
in which denotes the covariance matrix of measurement noise from EEG, and denotes the covariance matrix of the distribution of DOT priors. Covariance matrices and can be calculated by linear decomposition:
| (11) |
in which and are symmetric matrices denoting covariance matrices components, and and denote coefficients to be estimated. DOT priors are used to construct the symmetric matrix in ReML.
2.3. Novel data-informed selective channels method
Here we propose a novel method to enhance spatial accuracy. The depth sensitivity of DOT reconstruction is proportional to the source-detector distances [39]. There is a trade-off between the depth sensitivity and the accuracy of reconstructed depths. A higher depth sensitivity goes hand in hand with a decrease in resolution at deeper sources. By analyzing the reconstruction depths using different DOT source-detector distances, it can be observed that for a certain DOT source-detector distance threshold, the reconstruction depth is biased. Neural activities below the biased reconstruction depth will be overestimated, while neural activities deeper than the biased depth will be underestimated. If for each experiment, an optimal DOT channel length threshold (maximum source detector distance to be included) can be found, the reconstruction depth can be closer to the ground truth.
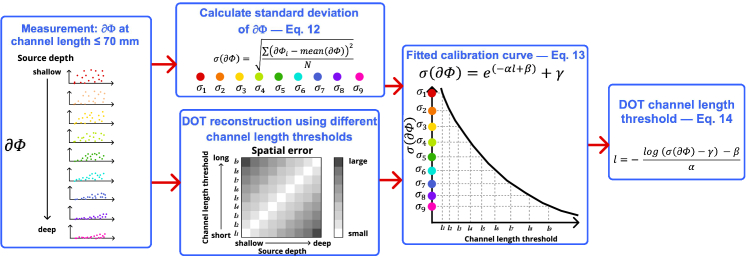
However, in real experiments, it is impossible for us to know the location of neural activities only using DOT. What we are proposing here is to analyze changes in optical densities, , specifically the distribution of the magnitude of , to determine which channels to include in the DOT reconstruction. Figure 2 shows the flowchart of the proposed data-informed method for DOT channel selection. Details on fitting results are described in section 3.1. Reconstruction depths were first calculated using different DOT channel length thresholds (equal or shorter than the thresholds were used). For each neural sources, channel length threshold that leads to the minimum reconstruction error is used as optimal channel length for calibration curve fitting.
Fig. 2.
Flowchart of the data-informed selective channel method on DOT reconstruction.
In this work, we are using the standard deviation as the determining matrix for DOT channel selection. The standard deviation of for the entire dataset (451 DOT channels in this case) is computed as
| (12) |
where N is the number of DOT channels. Using the standard deviation, denoted as , and observed optimal channel length, denoted as l, we can fit an equation to describe the relationship between the standard deviation and the optimal DOT channel threshold l:
| (13) |
in which α, β and γ are fitted coefficients from a fitting set of simulated data.
After deriving from the previous equation, we can get the equation to determine a DOT channel length threshold l based on the standard distribution of changes in optical densities :
| (14) |
With the fitted calibration curve, we can get the optimal DOT channel length threshold for any given DOT signal . Using Eq. (13), fitting for optimal channel length, l, and the standard deviation , neural sources are reconstructed using optimal DOT channel lengths inferred from the curve. DOT reconstruction up to the calculated channel length, l, can optimize DOT reconstruction, thus decrease the localization error and increase depth sensitivity.
2.4. Metrics
To evaluate the performance of the DOT-enhanced EEG reconstruction, two aspects have been considered: the accuracy of the reconstruction location and the spatial spread of the DOT-enhanced EEG reconstruction. We used reconstruction depth and full width half maximum (FWHM) as evaluation.
Reconstruction depth is defined as the distance between the scalp and the center of the mass of the reconstruction, which shows the accuracy of reconstruction locations and reflects the depth sensitivity of the DOT-only and DOT-enhanced EEG reconstruction. And FWHM is defined as the longest distance within the reconstruction that has a value larger than half of the maximum value. It can show changes in the spatial resolution of the EEG reconstructions with and without spatial priors.
3. Results
3.1. Fitted model for data-informed selective method
For evaluating the effects of the data-informed method for DOT channel selection, analysis and reconstruction were first done on DOT-only data under noise-free and noise-added conditions and then expanded to DOT-prior EEG data.
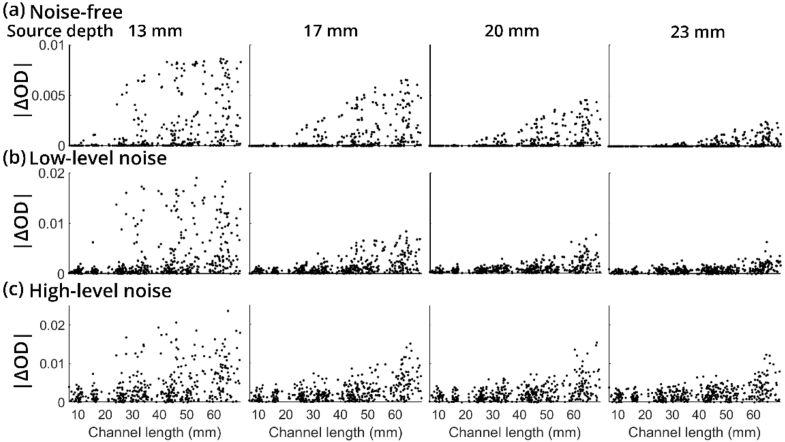
Figure 3 shows four examples of the distribution of optical density changes under both noise-free and noise-added conditions. From left to right, the four subfigures in Fig. 3(a) show the absolute magnitude of changes in optical densities as a function of DOT channel length for neural source depths of 13 mm, 17 mm, 20 mm, and 23 mm under the noise-free condition. As the depths increase, the magnitudes of all channels decrease, and fewer short channels can capture hemodynamic changes from the activated location. The overall magnitude distribution of changes in optical density is less dispersed when the neural source is deeper. Similarly, under the noise-added condition, changes in optical densities are getting less dispersed when the neural sources are deeper. Figure 3(b) and Fig. 3(c) are showing the absolute values of changes in optical densities of the same four neutral sources under low-level noise (maximum 1% noise) and high-level noise (maximum 3% noise) conditions, respectively. A higher noise level leads to larger magnitudes of optical density changes and less concentrated distributions.
Fig. 3.
(a) Distribution of simulated DOT signals of four neural sources at different depths under the noise-free condition. X axis denotes DOT channel lengths and y axis denotes the absolute value of optical densities. (b) Distribution of simulated DOT signals of four neural sources at different depths under low-level noise. (c) Distribution of simulated DOT signals of four neural sources at different depths under high-level noise.
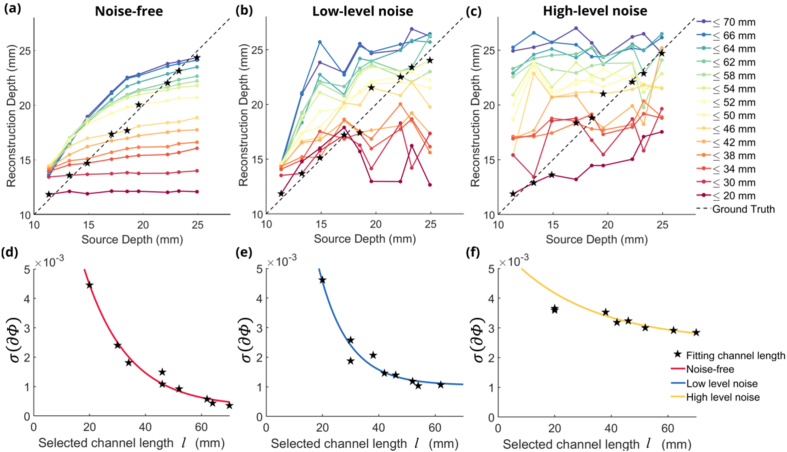
Figure 4(a), (b) and (c) are showing the reconstruction depth curves using multiple channel length thresholds for DOT under noise-free and noise-added conditions. As shown in Fig. 4(a), for each DOT channel length threshold, there exists a biased reconstructed depth. Neural sources shallower than the biased reconstructed depth are spatially overestimated, leading to the reconstructed center of mass being deeper than the ground truth. And neural sources deeper than the biased reconstructed depth are spatially underestimated, leading to the reconstructed center of mass being shallower than the ground truth. If we can determine the optimal DOT for each neural source depth, we are able to get a more accurate reconstructed depth compared to using all DOT channel lengths. Doing the same analysis on low-level noise added optical density data, the biased deconstruction depths can still be observed from the reconstruction depth figure using fourteen different DOT channel length thresholds (Fig. 4(b)) though the reconstruction depth curves are not smooth with noise added. However, when the noise level became higher, the DOT channels can hardly reconstruct the depth of the neural sources at all the channel length thresholds (Fig. 4(c)).
Fig. 4.
(a)Reconstruction depths of 9 sources using 14 different DOT channel length thresholds under noise-free condition. Black stars represent selected sources and corresponding optimal DOT channel lengths for curve fitting. (b) Reconstruction depths under low-level noise condition. (c) Reconstruction depths under high-level noise condition. (d) Fitted exponential decay curve using 4 selected DOT channel length thresholds and corresponding standard deviations under noise-free condition. (e) Fitted exponential decay curve under low-level noise condition. (f) Fitted exponential decay curve under high-level noise condition.
All nine neural sources were used for fitting the curve modeling under noise-free and noise-added conditions. By plotting the selected DOT channel length by the absolute value of the standard deviation of changes in optical densities, we found that the relationship between optimal channel length and the standard deviation follows an exponential decay, as discussed in section 2.3. Figure 4(d) shows the fitted curve for the noise-free condition, Fig. 4(e) for low-level noise condition and Fig. 4(f) for high-level noise condition. Table 2 shows the fitted values from the four points marked with stars in Fig. 4(a-c) corresponding to noise-free, low-level noise and high-level noise conditions. The difference between noise-free and noise-added conditions is that under the noise-free condition, the standard deviation of changes in optical densities tend to zero when the selected channel length tends to infinity. Under the noise-added condition, the standard deviation of changes in optical densities tends to a certain value which is the standard deviation value of noise from activities in the brain.
Table 2. Values of Coefficients in for DOT Channel Selection Model.
| Coefficients | α | β | γ |
|---|---|---|---|
| Noise-free | 0.6391 | -4.204 | 3.051e-04 |
| Low level noise | 0.9486 | -3.758 | 5.137-04 |
| High level noise | 0.346 | -5.72 | 2.53e-03 |
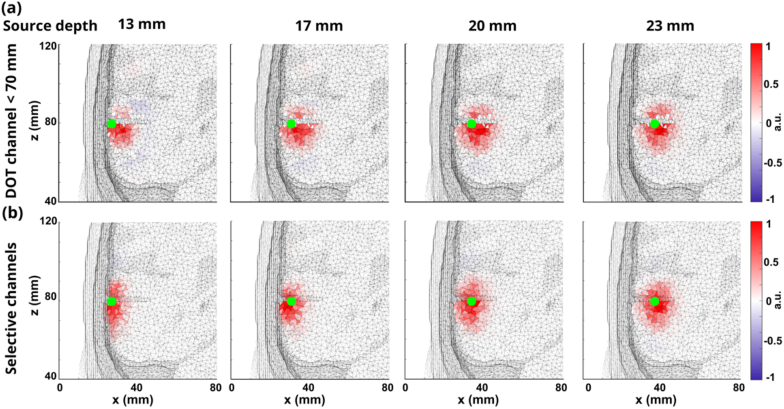
By implementing the data-informed selective channel method to DOT reconstructions, we show four examples for DOT reconstruction without noise in Fig. 5. All the reconstructions are normalized between -1 and 1 for comparison. Figure 5(a) shows the DOT reconstructions of four neural sources with the depths of 13 mm, 17 mm, 20 mm, and 23 mm from left to right using all DOT channels with the length smaller than 70 mm. Figure 5(b) shows the DOT reconstructions of the four neural sources using the proposed data-informed selective channel method. Green dots in all subfigures show the location of the ground truths of the neural sources. As shown in the figure, when using all channels shorter than 70 mm, the centers of mass of red areas (DOT reconstruction) do not overlap with the green dots. Instead, the depths of the centers of mass of red areas are deeper than the depths of green dots, which means that the reconstructions tend to be deeper than the ground truth. While using selected DOT channels for reconstruction, the centers of mass of the reconstructed areas are closer to the center of the neural activities, which means the reconstructed neural activities are more accurate.
Fig. 5.
(a) DOT reconstructions at four different depths: 13 mm, 17 mm, 20 mm, and 23 mm using fixed DOT channels ≤ 70 mm under noise-free conditions. Green dots represent the center of ground truths. (b) DOT reconstructions at four different depths: 13 mm, 17 mm, 20 mm, and 23 mm using selective DOT channel lengths under noise-free conditions.
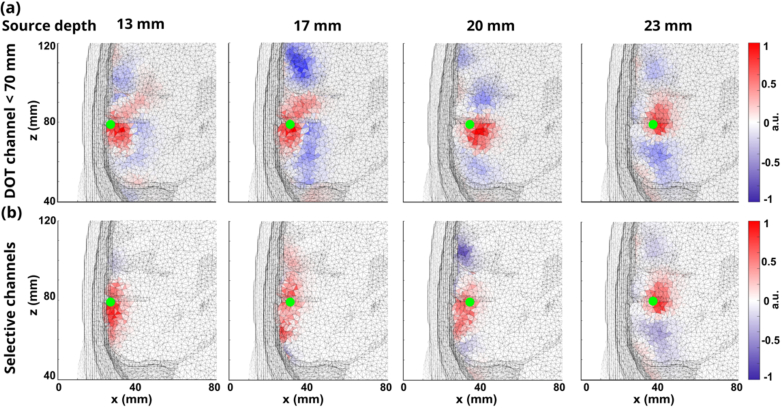
Same DOT reconstructions were done with realistic noise added to the signals. Figure 6. And Fig. 7 show the DOT reconstructions for neural sources at depths of 13 mm, 17 mm, 20 mm, and 23 mm using all DOT channel lengths shorter than 70 mm and selected DOT channel lengths with low-level noise and high-level noise. As shown in Fig. 6, under low-level noise condition, selected DOT channels avoided the effects of overestimation compared with the reconstruction using all DOT channel length, which made the localization errors smaller. When the neural source was moved to a deep location (23 mm), the magnitude of noise was large which made the reconstructed location inaccurate. And even longer channels cannot reconstruct the correct neural activity, which leads to reconstruction away from the center of the neural source for both DOT reconstruction when the neural source had the depth of 23 mm.
Fig. 6.
(a) DOT reconstructions at four different depths: 13 mm, 17 mm, 20 mm, and 23 mm using fixed DOT channels ≤ 70 mm under low-level noise condition. Green dots represent the center of ground truths. (b) DOT reconstructions at four different depths: 13 mm, 17 mm, 20 mm, and 23 mm using selective DOT channel lengths under low-level noise condition.
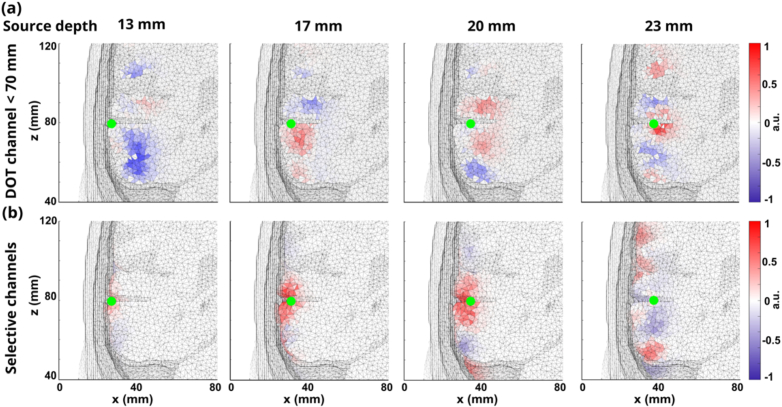
Fig. 7.
(a) DOT reconstructions at four different depths: 13 mm, 17 mm, 20 mm, and 23 mm using fixed DOT channels ≤ 70 mm under high-level noise condition. (b) DOT reconstructions at four different depths: 13 mm, 17 mm, 20 mm, and 23 mm using selective DOT channel lengths under high-level noise condition.
However, when the noise level is high as shown in Fig. 7., the reconstructions show slight move towards deeper location when the neural sources are deeper. However, the overall reconstructed depths are highly underestimated and the magnitude of the reconstructed are relatively small compared with the reconstructions in the other two conditions. The selected channel method removed some noise compared with the reconstruction from all DOT channel lengths even though both all DOT channels and selected DOT channels cannot reconstruct the neural activities at correct locations.
3.2. EEG reconstruction examples
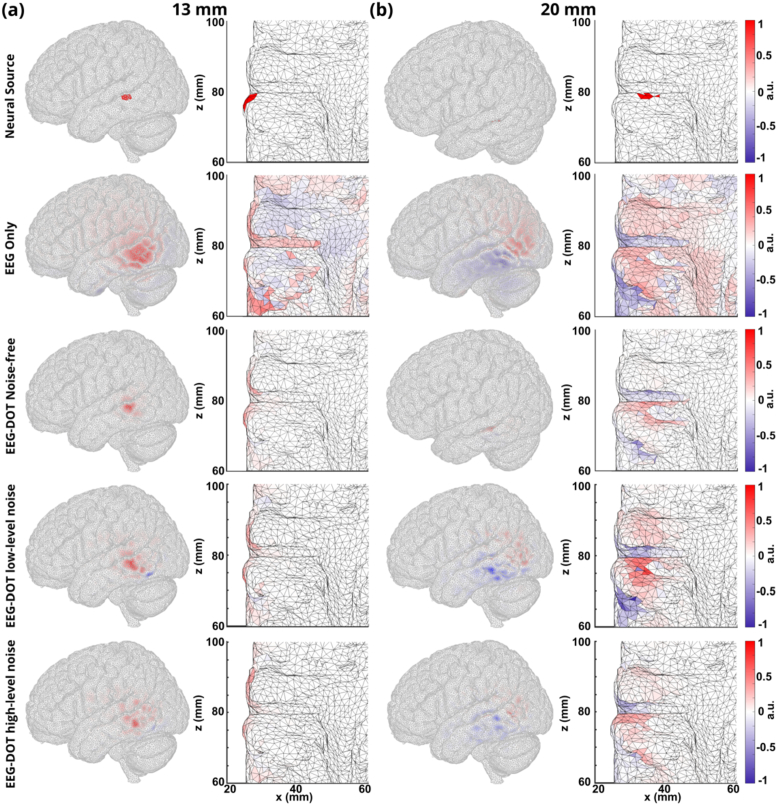
Figure 8 shows the EEG reconstructions for two example neural activities at different depths (13 mm and 20 mm). The neural sources and normalized reconstruction using EEG only, and DOT-enhanced EEG without and with selective channels DOT priors are shown both from a whole view and from a slice view under DOT noise-free, low-level DOT noise and high-level DOT noise conditions. When the neural source is at 13 mm (Fig. 8(a)), added noise in DOT doesn’t impact the DOT-enhanced EEG reconstruction very much. DOT-enhanced EEG reconstruction with high-level DOT noise has larger area compared with the reconstruction with low-level noise, but the EEG reconstruction is still more concentrated with the DOT prior and the spatial resolution can still be improved. Under both noise-free and noise-added conditions, the areas of DOT-enhanced EEG reconstruction shrunk significantly compared with the EEG only reconstruction. Using the ground truth of the neural source as a reference, the DOT priors have helped increase the spatial resolution and keep the location accurate for the EEG reconstruction. When the neural source is at a depth of 20 mm (Fig. 8(b)), EEG reconstruction shows positive and negative areas due to the directions of dipoles changed in this case. Under the noise-free condition for DOT signals, the area of EEG reconstruction was significantly decreased by the DOT priors, allowing for accurate localization for both shallow and deep neural sources. When there was noise added to the DOT, the overall area was still decreased by the DOT prior compared with EEG-only reconstruction.
Fig. 8.
(a) The side views and slice views of neural source, EEG-only reconstruction, EEG-DOT using selective channels under noise-free conditions, EEG-DOT using selective channels under low-level DOT noise and high-level DOT noise conditions for a shallow neural source (13 mm). (b) The side views and slice views of neural source, EEG-only reconstruction, EEG-DOT using selective channels under noise-free conditions, EEG-DOT using selective channels under low-level DOT noise and high-level DOT noise conditions for a shallow neural source (20 mm).
3.3. Quantitative analysis for depth sensitivity of reconstructions
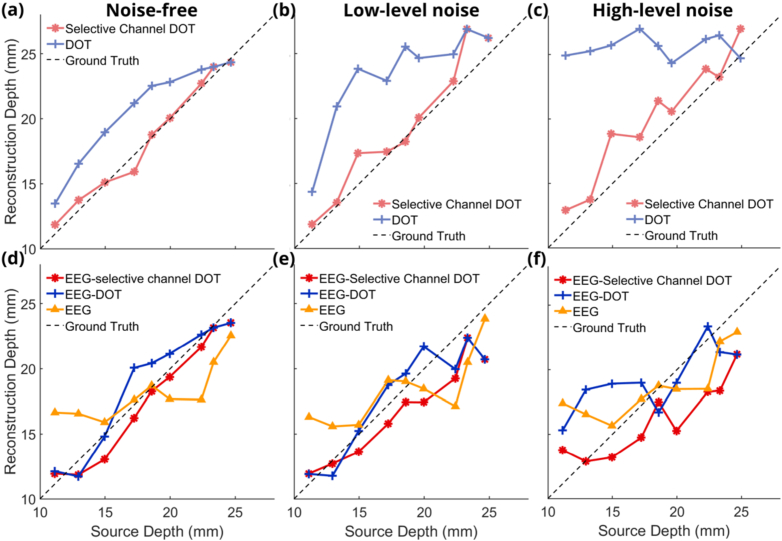
The quantification of DOT-enhanced EEG localization is seen in Fig. 10 for reconstruction depth and Fig. 11 for the full width half maximum (FWHM) of EEG reconstructions. Figure 10 shows the reconstruction depths of DOT priors only and DOT-enhanced EEG reconstructions. For the comparison with the proposed method, DOT channel lengths up to 70 mm were used. Figure 10(a) shows the reconstruction depth of DOT reconstruction using all channels shorter than 70 mm and using the selected channels based on the methods introduced here. The red curve, which represents the reconstruction depth using the proposed method, significantly lowers the localization errors compared to the blue curve, which represents the DOT reconstruction depth using all channel lengths. Using these DOT priors from two methods to improve the EEG reconstruction, Fig. 10(d) shows the reconstruction depth of EEG-only reconstruction, all channel DOT reconstruction enhanced EEG and selected channels DOT reconstruction enhanced EEG reconstructions. While both DOT priors can highly improve the accuracy of the reconstruction depth for EEG reconstructions, the DOT priors from the data-informed selective channel methods can furthermore lower the difference between the reconstructed depth and the ground truth, which means it has better performance on optimizing the algorithm. The errors of reconstruction depth using the DOT channel selection method have a decrease ranging from 0 mm to 3.8 mm under noiseless condition compared with the reconstruction depth of DOT-enhanced EEG using all DOT channels shorter than 70 mm. Adding low-level noise to the DOT signals, the reconstruction depth of both DOT-only reconstruction (Fig. 10(b)) and DOT-enhanced EEG reconstruction (Fig. 10(e)) can be promoted using the data-informed selective channel method compared with using all DOT channel lengths. In all the four figures, the reconstruction depth curves using the proposed method show a high correlation with the ground truth. There is a decrease of errors ranging from 0 mm to 3.3 mm under low-level noise condition after using the DOT channel selection. When the DOT noise level is higher, the reconstruction depths of DOT (Fig. 10(c)) and the reconstruction depth of DOT-enhanced EEG reconstructions are not accurate, leading to limited improvement in the reconstruction depth of DOT-enhanced EEG reconstructions. There is a decrease ranging from 1.0 mm to 8.7 mm under high-level noise condition after using DOT channel selection compared with DOT-enhanced EEG reconstruction using all channel lengths up to 70 mm.
Fig. 10.
Figure 10. DOT reconstruction depth using channels shorter than 70 mm and DOT reconstruction using selective channels for 9 neural source depths under noise-free condition (a), for low-level noise (b), and high-level noise (c). EEG reconstruction depth without priors, with DOT priors using channels shorter than 70 mm and DOT priors using selective channels for 9 neural source depths under noise-free condition (d), for low-level noise (e), and high-level noise (f).
Fig. 11.
(a) Full width half maximum (FWHM) of EEG reconstruction without priors, with DOT priors using channels shorter than 70 mm and DOT priors using selective channels for 9 neural source depths under noise-free condition. (b) FWHM of EEG reconstruction without priors, with DOT priors using channels shorter than 70 mm and DOT priors using selective channels for 9 neural source depths under low-level noise condition. (c) FWHM of EEG reconstruction without priors, with DOT priors using channels shorter than 70 mm and DOT priors using selective channels for 9 neural source depths under high-level noise condition.
The DOT channel length thresholds for channel selection in DOT reconstructions are shown in Fig. 9 for noise-free, low-level noise and high-level noise conditions. When the depth of neural source increases, DOT channels equal or smaller than the thresholds were used for the DOT reconstruction. As reflected in Fig. 9, the DOT channel length threshold increases with the increasing of neural source depth under each noise condition.
Fig. 9.
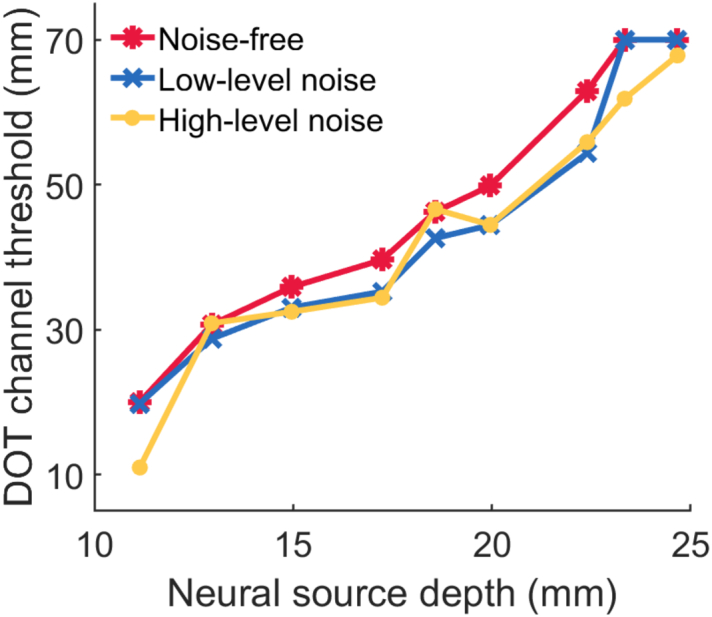
Neural source depth versus selected DOT channel threshold using the data-informed selective method.
The spatial resolution analyses are shown in Fig. 11 with FWHM. Under noise-free (Fig. 11(a)), low-level noise (Fig. 11(b)) and high-level noise (Fig. 11(c)) conditions, the FWHM significantly decreased after using the DOT reconstructions as spatial priors for EEG reconstruction. But there’s no significant difference between the spatial resolution of using all channels or using selective channels for DOT reconstruction, which means that the spatial resolution can be kept when the depth-sensitivity is increased for the DOT-enhanced EEG reconstruction. FWHM increases as the level of noise increases. In all three subfigures in Fig. 11, there are significant increases between the third and the fourth neural sources. This phenomenon can be attributed to the direction changes of the dipole. The direction of first three neural sources is more vertical to the cortex, which leads to concentrated positive reconstruction using EEG-only (one example can be Fig. 8. (a)). However, when the neural sources are deeper, the direction of the dipoles are more parallel to the cortex because of the geometry of the sulcus. Thus, the current spreads to the cortex in two directions, positive and negative, and has less concentrated reconstruction with smaller maximum values, leading to a larger FWHM.
4. Discussion
This study introduced a data-informed method to determine DOT source-detector distances to improve depth reconstruction accuracy of DOT and DOT-enhanced EEG for neural source reconstruction. Our results demonstrate that this approach can significantly increase the spatial resolution of EEG by reconstructing more accurate locations and reducing the reconstruction area, even in the presence of realistic noise. These findings could lead to improved accuracy and applicability of neuroimaging techniques in both research and clinical settings.
Our method builds upon previous research aimed at improving the accuracy of EEG and DOT reconstruction separately. Techniques such as low resolution electromagnetic tomography (LORETA) [20,40,41], focal under determined system solution (FOCUSS) [42] and recursive multiple signal classification (MUSIC) [43] have been proposed for EEG source localization and reconstruction. LORETA [20,40,41] smooths the reconstructed neural activities but leads to lower resolution. FOCUSS [42] and MUSIC [43] improve EEG localization using different iteration methods. Meanwhile, various normalization methods have been used to address the depth sensitivity bias in DOT. Depth sensitivity of DOT decreases as the location of brain activity moves deeper [39] because the density of photons decays exponentially with the depth of imaging increasing. Eggebrecht et al. proposed a high-density DOT system and added a spatial penalty in DOT reconstruction considering the reconstruction bias towards the surface of the head [3,18]. Eames and Dehghani improved the sensitivity of DOT reconstruction by normalizing the Jacobian [44]. Chiarelli et al. combined the energy constraint with Laplacian constraint, which increased the accuracy of reconstruction depth, but the spatial resolution is negatively influenced [20]. The distribution of optical signals has also been used in previous near infrared spectroscopy (NIRS) research [45,46]. Our approach is unique in its combination of these modalities using a data-informed channel selection method. By leveraging the strengths of both EEG and DOT, we have developed a technique that can offer better spatial and temporal resolution compared to either modality alone.
The improved reconstruction depth accuracy achieved by our method is particularly relevant for auditory neuroscience research. fMRI studies have shown that neural activities in the temporal lobe can be as deep as 50 millimeters [19,47], highlighting the need for techniques that can accurately reconstruct activity at these depths. By enhancing the spatial reconstruction accuracy of DOT-enhanced EEG, our approach offers a more cost-effective and convenient alternative to fMRI for studying auditory processing in the brain. This could have significant implications for understanding the neural basis of auditory perception, language processing, and related cognitive functions [48,49]. Moreover, improved localization of neural activity could aid in the diagnosis and treatment of neurological disorders such as epilepsy, development of brain-computer interfaces, and other neuromodulation techniques that rely on precise targeting of specific location inside the brain [40,50–52].
However, our study has some limitations that should be addressed in future research. The source-detector distances used in this study are unrealistically large (∼70 mm), and the performance of our method under more realistic distance thresholds (35-50 mm) needs to be evaluated. Additionally, the influence of noise levels on the reconstruction accuracy requires further investigation to determine the limitations of our approach. Current EEG and DOT noise models consider device noise. Other types of noise such as noise from heart beats, respiration, and other physiological factors will need to be considered in real experiments. It is also crucial to validate our method using different source-detector setups and neural activation patterns to establish its wider applicability. To simplify the simulation, we assumed EEG and DOT at only two time points – baseline and activation. In order to consider temporal variations, evoked neural activities could be modeled as a delta function and optical density changes follows hemodynamic response function [5]. Moreover, 9 neural sources were used in this work limited by the resolution of the mesh. Theoretically, 3 pairs of data are enough for fitting an equation with three unknown coefficients. More data pairs being used means more reliable fitting results. In clinical application, the necessary number of data pairs for fitting a reliable calibration curve needs further research.
To translate our method from simulation to experimental conditions and clinical applications, as shown in Fig. 12, we propose a pipeline that involves fitting a calibration curve using resting-state data and applying the data-informed channel selection method to experimental data. This approach will need to be rigorously tested and refined to ensure its robustness and reliability across different experimental conditions and subject populations. Questions including the duration of the resting state and the processing of the measured EEG and DOT data need to be solved in future work.
Fig. 12.
Block diagram of clinical applications of the data-informed selective channel DOT reconstruction.
Future research should also focus on integrating our method with other advanced signal processing techniques, such as channel subtraction [46], to further improve the signal-to-noise ratio and reconstruction accuracy. The development of standardized scalp and skull masks based on averaged MRI data could also help to mitigate the effects of hemodynamic responses in superficial layers, enhancing the specificity of the reconstructed neural activity.
In conclusion, our data-informed method for selecting DOT source-detector distances offers an improved depth reconstruction accuracy and spatial resolution for DOT-enhanced EEG reconstruction. With further refinement and validation, this approach could have wide-ranging applications in both basic neuroscience research and clinical practice, ultimately leading to a deeper understanding of brain function and more effective diagnosis and treatment of neurological disorders.
Funding
Office of Naval Research10.13039/100000006 (ONR N00014-19-1-1223).
Disclosures
No conflict of interest is declared.
Data availability
Data underlying the results presented in this paper may be obtained from the authors upon reasonable request.
References
- 1.Grinvald A., Hildesheim R., “VSDI: a new era in functional imaging of cortical dynamics,” Nat. Rev. Neurosci. 5(11), 874–885 (2004). 10.1038/nrn1536 [DOI] [PubMed] [Google Scholar]
- 2.Grover P., Venkatesh P., “An information-theoretic view of EEG sensing,” Proc. IEEE 105(2), 367–384 (2017). 10.1109/JPROC.2016.2615179 [DOI] [Google Scholar]
- 3.Eggebrecht A. T., White B. R., Ferradal S. L., et al. , “A quantitative spatial comparison of high-density diffuse optical tomography and fMRI cortical mapping,” NeuroImage 61(4), 1120–1128 (2012). 10.1016/j.neuroimage.2012.01.124 [DOI] [PMC free article] [PubMed] [Google Scholar]
- 4.O’Leary M. A., Boas D. A., Chance B., et al. , “Experimental images of heterogeneous turbid media by frequency-domain diffusing-photon tomography,” Opt. Lett. 20(5), 426 (1995). 10.1364/OL.20.000426 [DOI] [PubMed] [Google Scholar]
- 5.Cao J., Huppert T. J., Grover P., et al. , “Enhanced spatiotemporal resolution imaging of neuronal activity using joint electroencephalography and diffuse optical tomography,” Neurophotonics 8(01), 015002 (2021). 10.1117/1.NPh.8.1.015002 [DOI] [PMC free article] [PubMed] [Google Scholar]
- 6.Cao J., Bulger E., Shinn-Cunningham B., et al. , “Diffuse optical tomography spatial prior for EEG source localization in human visual cortex,” NeuroImage 277, 120210 (2023). 10.1016/j.neuroimage.2023.120210 [DOI] [PubMed] [Google Scholar]
- 7.Michel C. M., He B., “EEG source localization,” Handb. Clin. Neurol. 160, 85–101 (2019). 10.1016/B978-0-444-64032-1.00006-0 [DOI] [PubMed] [Google Scholar]
- 8.Liu Z., He B., “fMRI–EEG integrated cortical source imaging by use of time-variant spatial constraints,” NeuroImage 39(3), 1198–1214 (2008). 10.1016/j.neuroimage.2007.10.003 [DOI] [PMC free article] [PubMed] [Google Scholar]
- 9.Shah N. J., Oros-Peusquens A.-M., Arrubla J., et al. , “Advances in multimodal neuroimaging: hybrid MR-PET and MR-PET-EEG at 3 T and 9.4 T.,” J. Magn. Reson. 229, 101–115 (2013). 10.1016/j.jmr.2012.11.027 [DOI] [PubMed] [Google Scholar]
- 10.Ladd M. E., Bachert P., Meyerspeer M., et al. , “Pros and cons of ultra-high-field MRI/MRS for human application,” Prog. Nucl. Magn. Reson. Spectrosc. 109, 1–50 (2018). 10.1016/j.pnmrs.2018.06.001 [DOI] [PubMed] [Google Scholar]
- 11.Hahn A., Reed M. B., Vraka C., et al. , “High-temporal resolution functional PET/MRI reveals coupling between human metabolic and hemodynamic brain response,” Eur. J. Nucl. Med. Mol. Imaging 51(5), 1310–1322 (2024). 10.1007/s00259-023-06542-4 [DOI] [PMC free article] [PubMed] [Google Scholar]
- 12.Aine C. J., “A conceptual overview and critique of functional neuroimaging techniques in humans: I. MRI/FMRI and PET,” Crit. Rev. Neurobiol. 9(2-3), 229–309 (1995). [PubMed] [Google Scholar]
- 13.Pajevic S., Daube-Witherspoon M. E., Bacharach S. L., et al. , “Noise characteristics of 3-D and 2-D PET images,” IEEE Trans. Méd. Imaging 17(1), 9–23 (1998). 10.1109/42.668691 [DOI] [PubMed] [Google Scholar]
- 14.Stöcklin G., Qaim S. M., Rösch F., “The Impact of Radioactivity on Medicine Metallic,” Radiochim. Acta 70-71(Supplement), 249–272 (1995). 10.1524/ract.1995.7071.special-issue.249 [DOI] [Google Scholar]
- 15.Liao C. H., Worsley K. J., Poline J.-B., et al. , “Estimating the Delay of the fMRI Response,” NeuroImage 16(3), 593–606 (2002). 10.1006/nimg.2002.1096 [DOI] [PubMed] [Google Scholar]
- 16.Laufs H., Kleinschmidt A., Beyerle A., et al. , “EEG-correlated fMRI of human alpha activity,” NeuroImage 19(4), 1463–1476 (2003). 10.1016/S1053-8119(03)00286-6 [DOI] [PubMed] [Google Scholar]
- 17.Phillips A. A., Chan F. H., Zheng M. M. Z., et al. , “Neurovascular coupling in humans: Physiology, methodological advances and clinical implications,” J. Cereb. Blood Flow Metab. 36(4), 647–664 (2016). 10.1177/0271678X15617954 [DOI] [PMC free article] [PubMed] [Google Scholar]
- 18.Eggebrecht A. T., Ferradal S. L., Robichaux-Viehoever A., et al. , “Mapping distributed brain function and networks with diffuse optical tomography,” Nat. Photonics 8(6), 448–454 (2014). 10.1038/nphoton.2014.107 [DOI] [PMC free article] [PubMed] [Google Scholar]
- 19.Belin P., Zatorre R. J., Lafaille P., et al. , “Voice-selective areas in human auditory cortex,” Nature 403(6767), 309–312 (2000). 10.1038/35002078 [DOI] [PubMed] [Google Scholar]
- 20.Chiarelli A. M., Maclin E. L., Low K. A., et al. , “Combining energy and Laplacian regularization to accurately retrieve the depth of brain activity of diffuse optical tomographic data,” J. Biomed. Opt. 21(3), 036008 (2016). 10.1117/1.JBO.21.3.036008 [DOI] [PMC free article] [PubMed] [Google Scholar]
- 21.Fan W., Dehghani H., Eggebrecht A. T., “Modulation frequency improves imaging hemoglobin fluctuation in frequency domain high-density diffuse optical tomography,” Clin. Transl. Neurophotonics 11945, 1194506 (2022). 10.1117/12.2610185 [DOI] [Google Scholar]
- 22.Fan W., Dehghani H., Eggebrecht A. T., “Investigation of effect of modulation frequency on high-density diffuse optical tomography image quality,” Neurophotonics 8(04), 045002 (2021). 10.1117/1.NPh.8.4.045002 [DOI] [PMC free article] [PubMed] [Google Scholar]
- 23.Doulgerakis M., Eggebrecht A. T., Dehghani H., “High-density functional diffuse optical tomography based on frequency-domain measurements improves image quality and spatial resolution,” Neurophotonics 6(03), 035007 (2019). 10.1117/1.NPh.6.3.035007 [DOI] [PMC free article] [PubMed] [Google Scholar]
- 24.Fonov V., Evans A. C., Botteron K., et al. , and the B. D. C. Group, “Unbiased average age-appropriate atlases for pediatric studies,” NeuroImage 54(1), 313–327 (2011). 10.1016/j.neuroimage.2010.07.033 [DOI] [PMC free article] [PubMed] [Google Scholar]
- 25.Fang Q., Boas D. A., “Tetrahedral mesh generation from volumetric binary and grayscale images,” 2009 IEEE Int. Symp. Biomed. Imaging: Nano Macro, 1142–1145 (2009). [Google Scholar]
- 26.Garn S. M., Selby S., Young R., “Scalp thickness and the fat-loss theory of balding,” Arch. Dermatol. 70(5), 601–608 (1954). 10.1001/archderm.1954.01540230051006 [DOI] [PubMed] [Google Scholar]
- 27.Na S., Wang L. V., “Photoacoustic computed tomography for functional human brain imaging [Invited],” Biomed. Opt. Express 12(7), 4056 (2021). 10.1364/BOE.423707 [DOI] [PMC free article] [PubMed] [Google Scholar]
- 28.Vorwerk J., Oostenveld R., Piastra M. C., et al. , “The FieldTrip-SimBio pipeline for EEG forward solutions,” Biomed. Eng. OnLine 17(1), 37 (2018). 10.1186/s12938-018-0463-y [DOI] [PMC free article] [PubMed] [Google Scholar]
- 29.Consortium S., “SimBio: A generic environment for bio-numerical simulation,”NEC Europe Ltd., UK: (2000). [Google Scholar]
- 30.Oostenveld R., Praamstra P., “The five percent electrode system for high-resolution EEG and ERP measurements,” Clin. Neurophysiol. 112(4), 713–719 (2001). 10.1016/S1388-2457(00)00527-7 [DOI] [PubMed] [Google Scholar]
- 31.Nunez P. L., Harth E., “Electric fields of the brain: the neurophysics of EEG,” Phys. Today 35(6), 59 (1982). 10.1063/1.2915137 [DOI] [Google Scholar]
- 32.Schmitz C. H., Klemer D. P., Hardin R., et al. , “Design and implementation of dynamic near-infrared optical tomographic imaging instrumentation for simultaneous dual-breast measurements,” Appl. Opt. 44(11), 2140 (2005). 10.1364/AO.44.002140 [DOI] [PubMed] [Google Scholar]
- 33.Piper S. K., Krueger A., Koch S. P., et al. , “A wearable multi-channel fNIRS system for brain imaging in freely moving subjects,” NeuroImage 85, 64–71 (2014). 10.1016/j.neuroimage.2013.06.062 [DOI] [PMC free article] [PubMed] [Google Scholar]
- 34.Ruesch A., Acharya D., Bulger E., et al. , “Evaluating feasibility of functional near-infrared spectroscopy in dolphins,” J. Biomed. Opt. 28(07), 075001 (2023). 10.1117/1.JBO.28.7.075001 [DOI] [PMC free article] [PubMed] [Google Scholar]
- 35.Strangman G. E., Zhang Q., Li Z., “Scalp and skull influence on near infrared photon propagation in the Colin27 brain template,” NeuroImage 85, 136–149 (2014). 10.1016/j.neuroimage.2013.04.090 [DOI] [PubMed] [Google Scholar]
- 36.Phillips C., Mattout J., Rugg M. D., et al. , “An empirical Bayesian solution to the source reconstruction problem in EEG,” NeuroImage 24(4), 997–1011 (2005). 10.1016/j.neuroimage.2004.10.030 [DOI] [PubMed] [Google Scholar]
- 37.Santosa H., Zhai X., Fishburn F., et al. , “The NIRS Brain AnalyzIR Toolbox,” Algorithms 11(5), 73 (2018). 10.3390/a11050073 [DOI] [PMC free article] [PubMed] [Google Scholar]
- 38.Abdelnour F., Genovese C., Huppert T., “Hierarchical Bayesian regularization of reconstructions for diffuse optical tomography using multiple priors,” Biomed. Opt. Express 1(4), 1084–1103 (2010). 10.1364/BOE.1.001084 [DOI] [PMC free article] [PubMed] [Google Scholar]
- 39.Dehghani H., White B. R., Zeff B. W., et al. , “Depth sensitivity and image reconstruction analysis of dense imaging arrays for mapping brain function with diffuse optical tomography,” Appl. Opt. 48(10), D137 (2009). 10.1364/AO.48.00D137 [DOI] [PMC free article] [PubMed] [Google Scholar]
- 40.Jatoi M. A., Kamel N., Malik A. S., et al. , “EEG based brain source localization comparison of sLORETA and eLORETA,” Australas. Phys. Eng. Sci. Med. 37(4), 713–721 (2014). 10.1007/s13246-014-0308-3 [DOI] [PubMed] [Google Scholar]
- 41.Pascual-Marqui R. D., Michel C. M., Lehmann D., “Low resolution electromagnetic tomography: a new method for localizing electrical activity in the brain,” Int. J. Psychophysiol. 18(1), 49–65 (1994). 10.1016/0167-8760(84)90014-X [DOI] [PubMed] [Google Scholar]
- 42.Gorodnitsky I. F., George J. S., Rao B. D., “Neuromagnetic source imaging with FOCUSS: a recursive weighted minimum norm algorithm,” Electroencephalogr. Clin. Neurophysiol. 95(4), 231–251 (1995). 10.1016/0013-4694(95)00107-A [DOI] [PubMed] [Google Scholar]
- 43.Mosher J. C., Leahy R. M., “Recursive MUSIC: a framework for EEG and MEG source localization,” IEEE Trans. Biomed. Eng. 45(11), 1342–1354 (1998). 10.1109/10.725331 [DOI] [PubMed] [Google Scholar]
- 44.Eames M. E., Dehghani H., “Wavelength dependence of sensitivity in spectral diffuse optical imaging: effect of normalization on image reconstruction,” Opt. Express 16(22), 17780 (2008). 10.1364/OE.16.017780 [DOI] [PubMed] [Google Scholar]
- 45.Fazliazar E., Sudakou A., Sawosz P., et al. , “Depth-selective method for time-domain diffuse reflectance measurements: validation study of the dual subtraction technique,” Biomed. Opt. Express 14(12), 6233–6249 (2023). 10.1364/BOE.497671 [DOI] [PMC free article] [PubMed] [Google Scholar]
- 46.Milej D., Abdalmalak A., McLachlan P., et al. , “Subtraction-based approach for enhancing the depth sensitivity of time-resolved NIRS,” Biomed. Opt. Express 7(11), 4514 (2016). 10.1364/BOE.7.004514 [DOI] [PMC free article] [PubMed] [Google Scholar]
- 47.Eckstein K. N., Wildgruber D., Ethofer T., et al. , “Correlates of individual voice and face preferential responses during resting state,” Sci. Rep. 12(1), 7117 (2022). 10.1038/s41598-022-11367-6 [DOI] [PMC free article] [PubMed] [Google Scholar]
- 48.Zaehle T., Wüstenberg T., Meyer M., et al. , “Evidence for rapid auditory perception as the foundation of speech processing: a sparse temporal sampling fMRI study,” Eur. J. Neurosci. 20(9), 2447–2456 (2004). 10.1111/j.1460-9568.2004.03687.x [DOI] [PubMed] [Google Scholar]
- 49.Noyce A. L., Lefco R. W., Brissenden J. A., et al. , “Extended frontal networks for visual and auditory working memory,” bioRxiv, (2021). 10.1101/cercor/bhab249 [DOI] [PMC free article] [PubMed]
- 50.Alkawadri R., “Brain-computer interface (BCI) applications in mapping of epileptic brain networks based on intracranial-EEG: an update,” Front. Neurosci. 13, 191 (2019). 10.3389/fnins.2019.00191 [DOI] [PMC free article] [PubMed] [Google Scholar]
- 51.Bénar C.-G., Grova C., Kobayashi E., et al. , “EEG-fMRI of epileptic spikes: Concordance with EEG source localization and intracranial EEG,” NeuroImage 30(4), 1161–1170 (2006). 10.1016/j.neuroimage.2005.11.008 [DOI] [PubMed] [Google Scholar]
- 52.Cincotti F., Mattia D., Aloise F., et al. , “High-resolution EEG techniques for brain-computer interface applications,” J. Neurosci. Methods 167(1), 31–42 (2008). 10.1016/j.jneumeth.2007.06.031 [DOI] [PubMed] [Google Scholar]
Associated Data
This section collects any data citations, data availability statements, or supplementary materials included in this article.
Data Availability Statement
Data underlying the results presented in this paper may be obtained from the authors upon reasonable request.


