

Abstract
Perfluoro-2-methoxyacetic acid (PFMOAA) is a short-chain perfluoroalkyl ether carboxylic acid that has been detected at high concentrations (~10 ug/L) in drinking water in eastern NC, USA and in human serum and breastmilk in China. Despite documented human exposure there are almost no toxicity data available to inform risk assessment of PFMOAA. Here we exposed pregnant Sprague-Dawley rats to a range of PFMOAA doses (10-450 mg/kg/d) via oral gavage from gestation day (GD) 8 – postnatal day (PND) 2 and compared results to those we previously reported for perfluorooctanoic acid (PFOA) and hexafluoropropylene oxide-dimer acid (HFPO-DA or GenX chemicals). Newborn pups displayed reduced birthweight (≥30 mg/kg), depleted liver glycogen concentrations (all doses), hypoglycemia (≥125 mg/kg), and numerous significantly altered genes in the liver associated with fatty acid and glucose metabolism similar to gene changes produced by HFPO-DA. Pup survival was significantly reduced at ≥125 mg/kg and at necropsy on PND2 both maternal and neonatal animals displayed increased liver weights, increased serum aspartate aminotransferase (AST), and reduced serum thyroid hormones at all doses (≥10 mg/kg). Pups also displayed highly elevated serum cholesterol at all doses. PFMOAA concentrations in serum and liver increased with maternal oral dose in both maternal and F1 animals and were similar to those we reported for PFOA but considerably higher than HFPO-DA. We calculated 10% effect levels (ED10 or EC10) and relative potency factors (RPF; PFOA=index chemical) among the three compounds based on maternal oral dose and maternal serum concentration (μM). Reduced pup liver glycogen, increased liver weights and reduced thyroid hormone levels (maternal and pup) were the most sensitive endpoints modeled. PFMOAA was ~3-7-fold less potent than PFOA for most endpoints based on maternal serum RPFs, but slightly more potent for increased maternal and pup liver weights. PFMOAA is a maternal and developmental toxicant in the rat producing a constellation of adverse effects similar to PFOA and HFPO-DA.
Keywords: PFAS, developmental toxicity, liver, birthweight, thyroid disruption, hepatic toxicity
Graphical Abstract

1. INTRODUCTION
The mammalian toxicity database for compounds categorized as per- and polyfluoroalkyl substances (PFAS) is dominated by long-chain perfluoroalkyl acids (≥7 and ≥6 perfluorinated carbons for carboxylates and sulfonates1, respectively) such as perfluorooctanoic acid (PFOA) and perfluorooctanesulfonic acid (PFOS) 2, 3. Recent efforts in targeted and non-targeted analytical chemistry analyses have identified numerous structurally diverse PFAS in drinking water and/or human serum including short-chain compounds and those with ether-linkages inserted in the carbon chain 4-6. Ether-linked PFAS include the per- and polyfluoroalkyl ether carboxylic acids (PFECA), such as hexafluoropropylene oxide-dimer acid (HFPO-DA or GenX), and the per- and polyfluoroalkyl ether sulfonic acids (PFESA), such as Nafion byproduct 2 (NBP2) 7, 8. The majority of recently detected PFECA and PFESA compounds have insufficient in vivo mammalian toxicity databases to inform human health risk assessment. Thus far experimental data on a limited number of PFECA and PFESA compounds have demonstrated they produce similar in vitro receptor activities 9 and in vivo toxicities as legacy straight-chain compounds, particularly when compared with other PFAS with similar functional groups 10-14.
Perfluoro-2-methoxyacetic acid (PFMOAA) is a very short-chain PFECA (2 perfluorinated C + 1 ether O) similar to the straight-chain compounds perfluorobutanoic acid (PFBA, 3 perfluorinated C) and perfluoropropionic acid (PFPrA, 2 perfluorinated C) except PFMOAA has a single ether bond between the two fluorinated carbons (chemical structures in Figure S1). Both PFBA and PFPrA were recently evaluated by USEPA and determined to pose potential human health hazards from exposure with reference doses derived from increased liver weight and liver pathology (both compounds) and reduced thyroid hormones (PFBA, no thyroid hormone data for PFPrA) in rats from repeat dose oral exposure studies 15, 16. The PFPrA database was limited to a single high quality animal study that did not include developmental exposure, while PFBA was also noted to produce adverse developmental effects in mice 17. Because of the ether bond, the structure of PFMOAA does not contain two adjacent fluorinated carbons and does not meet the working definition of a PFAS used by USEPA’s Office of Pollution Prevention and Toxics as reported in the USEPA National PFAS Testing Strategy 18 (“a structure that contains the unit R-CF2-CF(R’)(R”), where R, R’, and R” do not equal “H” and the carbon-carbon bond is saturated”). In contrast, PFMOAA is considered a PFAS under current OECD 19 (i.e., any chemical with at least a -CF3 or a -CF2-) and USEPA Office of Water 20 (three structural definitions including “R-CF2OCF2-R’, where both CF2 moieties are saturated carbons, and none of the R groups can be hydrogen”) definitions. Further, current OECD terminology includes the ether oxygen atom when counting the perfluorinated chain length of PFECA and PFESA compounds.19
Analytical chemical investigations in the Cape Fear River region of eastern North Carolina USA identified highly elevated drinking water concentrations of PFMOAA at ~ 10 parts per billion (10,000 ng/L) 4. Pelch, et al. 21 reported PFMOAA was detected in ~9% of drinking water samples (4 detects above reporting limits out of 44 samples) between 2.1 - 15 ng/L from a multi-state survey in the USA. Recent studies across multiple cities in China have reported widespread detection of PFMOAA in drinking water, seafood, and human serum and breast milk 22-25. Despite documented human exposure to PFMOAA and similarity to other PFAS with health hazards, to our knowledge, there is only a single published study evaluating the hazard of PFMOAA exposure in a mammalian model 26, thus estimating potential human health risk from prior and on-going exposure is severely limited.
The goal of the present study was to characterize the potential maternal and developmental toxicity of PFMOAA to inform risk assessment due to documented human exposure, lack of existing toxicity data for this PFAS, and structural similarity to other hazardous short-chain PFAS including PFBA and PFPrA. We conducted an in vivo developmental toxicity experiment with maternal oral exposure during pregnancy and early lactation and compared relative potencies across endpoints using data from similar studies we previously conducted individually with PFOA and HFPO-DA 10, 27. We hypothesized that PFMOAA would produce effects that were relatively consistent with other PFAS carboxylates but with lower potencies across effects when compared to the long-chain PFOA (7 perfluorinated C) and short-chain HFPO-DA (6 perfluorinated C).
2. METHODS
Full method details are reported in the Supporting Information file and are similar to those previously published.27
2.1. Chemicals and dosing solutions
PFMOAA (Sodium 2,2-difluoro-2-(trifluoromethoxy)acetate; CAS: 21837-98-9; Product #: FC23-02; Lot: 20180529; Purity ≥98%) was purchased from Fluoryx Labs (Carson City, NV, USA). Dosing vehicle was high performance liquid chromatography-grade water purchased from Honeywell Research Chemicals (Muskegon, MI, USA). Oral doses reported in mg/kg/d represent nominal exposures to PFMOAA sodium salt and were not corrected for counterion content, which accounts for 11.4% of the molecular weight of PFMOAA sodium salt. Dosing solutions were prepared fresh every 5-6 days and dosing was administered once daily via oral gavage at 2.5 mL/kg-body weight between 07:00 – 09:00 EST.
2.2. Animals
Time-mated Sprague-Dawley rats (Crl:CD(SD)), ~11-12 weeks old, were purchased from Charles River Laboratories (Raleigh, NC, USA) and shipped to USEPA (Research Triangle Park, NC, USA) on gestational day (GD) 2 (GD0 = bred date; GD1 = plug positive date). Dams and their offspring were housed individually in clear polycarbonate cages (20 x 25 x 47 cm) with heat-treated, laboratory-grade pine shavings (Northeast Products, Warrensburg, NY) and fed NIH07 Rat Chow and municipal tap water (Durham, NC; treated with particle filtration (50μm), granular activated charcoal filtration, and rechlorinated) ad libitum. Animals were housed in a facility accredited by the Association for Assessment and Accreditation of Laboratory Animal Care and maintained at 20-22°C, 45-55% humidity, and a 12:12 h photoperiod (06:00 – 18:00 EST). This study was conducted in accordance with a protocol approved by the USEPA Center for Public Health and Environmental Assessment Institutional Animal Care and Use Committee.
2.3. Study design
The study consisted of one block of 30 rat dams (Figure S2). Dams were weighed daily and dosed via oral gavage with either 0 (water vehicle), 10, 30, 62.5, 125, or 450 mg/kg (n=5 dams per dose) from GD8 – PND2 (PND0 = day of parturition). The dose range was intended to allow for dose response curve modeling of multiple endpoints and was based on observations from a short term (5 day) pilot study of PFMOAA (doses 0.01 – 500 mg/kg/d; data not reported here) and based on the oral doses used in similar studies we have published for the PFAS carboxylates HFPO-DA10 and PFOA27. At birth two randomly selected pups per litter were euthanized via decapitation and pooled trunk blood was collected. Liver tissue was removed from one pup for RNA extraction and gene expression (described below section 2.4) and a second piece of liver was weighed and flash frozen in liquid nitrogen for glycogen assay (described below section 2.7). The thoracic and abdominal cavity of the second pup was exposed and the whole pup was fixed in 10% formalin. Subsequently, livers from formalin fixed pups were removed and shipped to Experimental Pathology Laboratories, Inc. (Durham, NC) where they were embedded in parrafin and sectioned (4-6 μm). Sections from each pup were stained with hematoxylin and eosin (H&E) and Oil Red O and evaluated for histopathological lesions by a Diplomate of the American College of Veterinary Pathology.
On PND2 all dams and pups were euthanized via rapid decapitation. Trunk blood was collected from all dams and pups (pooled by litter) for PFMOAA quantitation, total serum T3, T4, and clinical chemistry analyses. Liver weight was recorded for all dams and for one male and one female pup randomly selected per litter, where available. A portion of maternal liver was collected, weighed, and stored at 4°C for analytical chemical quantitation of PFMOAA.
2.4. Liver gene expression in PND0 pups
Subsamples of newborn (PND0) pup liver (~30-50 mg) were collected into polypropylene microcentrifuge tubes for mRNA extraction and purification as previously described.10, 11, 27 cDNA synthesized from mRNA was assessed using reverse transcriptase real-time polymerase chain reaction (RT-qPCR). PND0 pup livers were evaluated using the Qiagen RT2 Profiler PCR Array for Rat Fatty Acid Metabolism (Cat no. 330231 PARN-007ZA) because it contains many gene primers in common with the PPAR Targets arrays we previously used with HFPO-DA10, along with multiple acyl-CoA thioesterase genes, which we found to be strongly affected by NBP2 in fetal livers11. PCR reactions were run using RT2 SYBR Green qPCR Master Mix (Qiagen) on a CFX96 Touch Real-Time Detection System (Bio-Rad). RT-qPCR gene expression data were analyzed using the comparative cycle threshold (CT) method (housekeeping gene = Rplp1).
2.5. Clinical chemistry
Clinical chemistry parameters were analyzed in maternal (PND2) and pup (PND0 and PND2) sera using a Rx daytona+ (Randox Laboratories, Kearneysville, WV) according to manufacturer specifications.
2.6. Free and total thyroid hormones
PND2 maternal and pup sera were analyzed for total thyroid hormone concentrations (triiodothyronine (T3), reverse triiodothyronine (rT3), and thyroxine (T4)) and PND2 maternal sera were separately analyzed for free T3 and free T4 as previously described.27 Samples were analyzed using an AB Sciex 6500+ QTRAP Linear Ion Trap mass spectrometer. The LOQ for total T3, rT3, and T4 was 5 pg/mL each. The LOQ for free T3, rT3, and T4 was 0.5 pg/mL each.
2.7. Pup liver glycogen
Newborn (PND0) pup liver subsamples were flash frozen in liquid nitrogen and stored at −80 °C. Glycogen was quantified using Glycogen Assay Kit II (Colorimetric; Prod no. LS-K151-100) by LifeSpan BioSciences, Inc. (Seattle, WA, USA) as per manufacturer protocol.
2.8. Analytical chemical determination of PFAS concentrations
Analytical quantitation of PFMOAA was conducted for PND2 maternal serum and liver, and PND2 pup serum using similar methodology as previously reported 4, 12. Sample extracts were separated using a Thermo Vanquish Horizon ultra-high performance liquid chromatograph (UHPLC) (Model: VH-C10-A; Thermo Fisher Scientific, Waltham, MA) fitted with a Restek Raptor Polar X column (2.1 mm x 100 mm; 2.7 μm; 90 Å). Detection was performed using a Thermo Fischer TSQ Quantis tandem quadrupole mass spectrometer (TSQ-Q-10619; Thermo Fisher Scientific, Waltham, MA) in negative ionization mode. A stable isotope of PFBA (13C4) (Wellington Laboratories; Guelph, Ontario, Canada) was used as internal standard because no stable isotopes of PFMOAA were available. Limits of quantitation (LOQ) for PFMOAA were 2.5 ng/mL (serum) and 40 ng/g (liver).
2.9. Data analyses
All data analyses were conducted using GraphPad Prism (version 9; GraphPad, Inc.; La Jolla, CA, USA) and SAS (version 9.4; SAS Institute; Cary, NC, USA). All values are reported as mean ± standard error of the mean (SEM) unless otherwise stated. All endpoints were analyzed by analysis of variance (ANOVA) using PROC GLM in SAS, followed by pairwise comparison of individual dose levels to vehicle controls using LSMEANS. Statistical significance was determined at α=0.05, except for gene expression analysis which used α=0.01 to protect against false detection due to multiple comparisons. For all pup data, litter means were used as the statistical unit to account for the nested effects of individuals within litters. For offspring endpoints measured in males and females PROC MIXED was used to evaluate the main effects of dose and sex and the dose*sex interaction with individual pup data nested within litter and litter included as a random variable. Histopathological changes were analyzed with the Cochran-Armitage Trend Test using PROC FREQ in SAS.
Several endpoints were also analyzed by analysis of covariance (ANCOVA) in addition to analysis on absolute measurements. Dam bodyweight on PND2 was analyzed using initial (GD8) bodyweight as a covariate with dose and cumulative maternal gestational weight gain was analyzed with litter size as a covariate with dose. Pup birthweight was analyzed with total litter size and gestational age (birthtime) as covariates with dose. Interpretation of the direct effects of treatment on organ weights can be difficult when treatment reduces body weight 28, 29. Here, organ weights (maternal and offspring) were analyzed on an absolute weight basis, with terminal body weight as a covariate with dose in ANCOVA (i.e., adjusted liver weight), and relative organ weights (mg organ per g bodyweight).
Dose response analyses were conducted on data normalized to vehicle controls and fit with four parameter logistic regressions (“Sigmoidal, 4PL, X is log(concentration)” in Prism). Decreasing effects were modeled as % of control with the top constrained to 100%, bottom constrained to 0%, and the remaining two parameters unconstrained (i.e., slope and ED50). Increasing effects were modeled as % increase from control with the bottom constrained to 0% and the top constrained to a high value (e.g., 500%) because the top cannot be estimated and so that Prism would not attempt to “assign” an arbitrary top value. For decreasing effects where there appeared to be a lower plateau greater than 0 or the bottom was left unconstrained. Pup absolute liver weight was fit with a bell curve (“Bell-shaped, X is log(concentration)”).
To provide context for the PFMOAA effects observed we statistically compared dose response curves between PFMOAA and previously published dose response data for two other PFAS carboxylates, HFPO-DA 10 and PFOA 27. Dose response curves were graphed as functions of maternal oral dose (mg/kg/d) based on the nominal doses of the salts reported in the referenced studies. We also graphed dose response curves as functions of the maternal serum concentrations after correcting for the counterion content (11.4% for PFMOAA•Na, 5.2% for HFPO-DA•NH4, 4.2% for PFOA•NH4) and in micromolar (μM) units to account for the molecular weight differences in these compounds (non-protonated molecular weights: PFMOAA 179.03 g/mol, HFPO-DA 329.05 g/mol, PFOA 413.06 g/mol). Effective dose 10% levels (ED10 or EC10) were estimated and used to calculate relative potency factors (RPFs; PFOA=index chemical) for PFMOAA and HFPO-DA based on oral dose (mg/kg/d) and maternal serum (μM) concentrations.
3. RESULTS
3.1. Maternal endpoints
Maternal rats were orally exposed to 0, 10, 30, 62.5, 125, or 450 mg/kg/d PFMOAA from GD8-PND2. PFMOAA did not produce overt maternal toxicity at any dose with no significant effects on maternal bodyweight or weight gain during gestation (GD8-22) or at necropsy on PND2 (Table 1, S1). Maternal absolute liver weight and adjusted liver weight were greater than control at all doses and significantly increased at ≥30 mg/kg, while relative liver weight was significantly increased at all doses (~7 – 45% increase for all three liver weight metrics at 10 – 450 mg/kg) (Figure 1B; Table 1, S1).
Table 1.
Maternal and neonatal endpoints (mean ± standard error) from GD8-PND2 maternal oral exposure to PFMOAA
| Control | 10 mg/kg | 30 mg/kg | 62.5 mg/kg | 125 mg/kg | 450 mg/kg | |
|---|---|---|---|---|---|---|
| Maternal endpoints | n=5 | n=5 | n=5 | n=5 | n=5 | n = :5 |
| GD8 bodyweight (g) | 257.7 ± 14.2 | 259.4 ± 15.1 | 252.0 ± 6.8 | 253.4 ± 9.7 | 259.6 ± 20.6 | 255.7 ± 12.1 |
| GD22 bodyweight (g) | 398.0 ± 14.9 | 391.3 ± 18.4 | 389.7 ± 18.9 | 394.7 ± 14.0 | 390.6 ± 24.6 | 380.0 ± 15.1 |
| GD8-GD22 weight gain (g) | 140.2 ± 5.2 | 131.9 ± 6.4 | 137.7 ± 12.3 | 141.4 ± 5.8 | 131.0 ± 4.3 | 124.3 ± 7.6 |
| PND2 bodyweight (g) | 303.1 ± 14.5 | 303.4 ± 11.6 | 298.5 ± 11.2 | 296.1 ± 10.4 | 292.6 ± 17.9 | 298.3 ± 10.5 |
| GD8-PND2 weight gain (g) | 45.4 ± 1.9 | 43.9 ± 6.1 | 46.5 ± 6.1 | 42.8 ± 4.6 | 33.0 ± 3.4 | 42.6 ± 3.6 |
| Uterine implants | 13.0 ± 0.3 | 12.6 ± 1.2 | 11.8 ± 1.5 | 12.8 ± 0.9 | 12.2 ± 1.2 | 11.0 ± 0.7 |
| Liver weight (g) | 11.6 ± 0.6 | 12.5 ± 0.6 | 13.5 ± 0.8 * | 14.3 ± 0.4 ** | 14.8 ± 1.1 ** | 16.6 ± 0.5 ** |
| Adjusted liver weight (g)a | 11.4 ± 0.3 | 12.2 ± 0.3 | 13.5 ± 0.3 ** | 14.4 ± 0.3 ** | 15.1 ± 0.3 ** | 16.6 ± 0.3 ** |
| Serum total T3 (ng/mL) | 0.36 ± 0.02 | 0.31 ± 0.02 | 0.24 ± 0.02 ** | 0.23 ± 0.02 ** | 0.21 ± 0.02 ** | 0.21 ± 0.02 ** |
| Serum total T4 (ng/mL) | 17.2 ± 1.4 | 13.3 ± 0.8 ** | 10.1 ± 0.4 ** | 6.5 ± 0.8 ** | 4.7 ± 0.3 ** | 3.5 ± 0.3 ** |
| Neonatal endpoints | ||||||
| Delivery timeb | 16.8 ± 1 | 16.5 ± 1.3 | 16.3 ± 0.8 | 15.2 ± 1 | 20.6 ± 5 | 19.4 ± 2.6 |
| Litter size (# pups) | 12.6 ± 0.5 | 11.2 ± 1.1 | 11.2 ± 1.5 | 12.8 ± 0.9 | 12.2 ± 1.2 | 9.8 ± 1 |
| Birthweight (g) | 6.09 ± 0.12 | 6.19 ± 0.2 | 5.94 ± 0.17 | 5.65 ± 0.13 | 5.7 ± 0.22 | 5.19 ± 0.1** |
| Adjusted birthweight (g)c | 6.2 ± 0.09 | 6.16 ± 0.09 | 5.92 ± 0.09 * | 5.82 ± 0.09 ** | 5.69 ± 0.1 ** | 4.97 ± 0.09 ** |
| PND2 bodyweight (g) | 7.82 ± 0.34 | 7.88 ± 0.35 | 7.5 ± 0.28 | 6.5 ± 0.33 ** | 6.19 ± 0.12 ** | 4.76 ± . d ** |
| Survival (% implants) | 95.8 ± 2.6 | 97.1 ± 2.9 | 86 ± 5.8 | 81.8 ± 8.9 | 70.5 ± 11.6 * | 12 ± 12 ** |
| Survival (% live born) | 92.4 ± 4.7 | 84.4 ± 5.7 | 81.9 ± 8.5 | 81.8 ± 8.9 | 70.5 ± 11.6 | 7.5 ± 7.5 ** |
| Liver weight (mg) | 325 ± 29 | 370 ± 24 | 408 ± 23 * | 402 ± 8 * | 378 ± 5 | 342 ± .d |
| Adjusted liver weight (mg)a | 282 ± 16 | 337 ± 15 ** | 400 ± 15 ** | 432 ± 15 ** | 413 ± 15 ** | 435 ± . d ** |
| Serum total T3 (ng/mL) | 0.175 ± 0.006 | 0.135 ± 0.004 ** | 0.075 ± 0.009 ** | 0.092 ± 0.01 ** | 0.057 ± . e ** | . ± . |
| Serum total T4 (ng/mL) | 12 ± 2.2 | 8.2 ± 0.8 | 5.7 ± 1 ** | 4.7 ± 0.3 ** | 2.3 ± . e ** | . ± . |
Organ weight adjusted for body weight using ANCOVA
Delivery time = hrs after 12:00AM PND0
Birthweight adjusted for delivery time and littersize using ANCOVA
Due to pup mortality n=1
Due to limited serum availability n=1; GD=gestation day; PND=postnatal day
p<0.05
p<0.01
Figure 1.

Dose response curves for adverse effects on PND2 observed in maternal and neonatal rats from maternal oral exposure to PFMOAA from GD8-PND2. Panels include pup survival (as percent live born) and bodyweight on PND2 (A), pup and maternal liver weights (B), pup and maternal serum total T4 (C) and total T3 (D). Pup liver weight is graphed as both ANCOVA bodyweight-adjusted and absolute liver weights to demonstrate the non-monotonic change in absolute liver weight as compared to adjusted liver weight. Red symbols (squares and triangles) and lines represent pup endpoints and blue symbols (circles) and lines represent maternal endpoints. All dose responses fit with four parameter logistic regression curves using GraphPad Prism. Asterisks represent statistically significant dose level effects compared to concurrent controls (* p<0.05, ** p<0.01, *** p<0.001, **** p<0.0001). Data points are mean ± standard error.
Maternal serum thyroid hormones were affected with total T4 significantly reduced at all doses (22.5 – 79% reduction at 10 – 450 mg/kg), while total T3 was reduced 13 – 42% at 10 – 450 mg/kg and significant at ≥30 mg/kg (34.3% reduction) (Figure 1C,D; Tables 1, S1). Further, free T4 was reduced at ≥30 mg/kg and significant at ≥125 mg/kg (10 – 61% reduction), while free T3 was increased at the middle doses (10-125 mg/kg) and significant at 30 and 62.5 mg/kg (596% and 408% of control, respectively) (Table S1).
Numerous maternal serum clinical chemistry parameters were affected by exposure to PFMOAA (Table S1). Serum aspartate aminotransferase (AST) and albumin:globulin were increased at all doses and significant at ≥30 mg/kg. Serum glutamate dehydrogenase (GLDH) was increased and globulin was decreased at all doses, with both significant at ≥62.5 mg/kg. Total protein was reduced at all doses and significant at ≥125 mg/kg. Alanine aminotransferase (ALT), blood urea nitrogen (BUN), and triglycerides were increased at all doses and significant at 450 mg/kg.
3.2. Neonatal endpoints
Pup birthweight was significantly lower than control in the top dose group but adjusting for delivery time and total litter size with ANCOVA resulted in significantly reduced birthweight at ≥30 mg/kg (4.5 – 19.8% reduction at 30 – 450 mg/kg; Tables 1, S2). Newborn pup liver glycogen concentration was significantly reduced at all doses levels (44 - 75% reduction at 10 - 450 mg/kg; Figure 2A, Table S2) and newborn pups were hypoglycemic with serum glucose concentrations lower than control at ≥30 mg/kg and significant at ≥125 mg/kg (18 – 44% reduction at 30 – 450 mg/kg) (Figure 2B; Table S2). Further, newborn pup serum displayed dose related increases in total cholesterol, blood urea nitrogen (BUN), and BUN:creatinine at all doses and significant at ≥30 mg/kg (Table S2). Newborn serum total bilirubin was greater than control at all doses and significant at ≥125 mg/kg, while total protein and globulin were significantly reduced at ≥125 mg/kg and albumin reduced at the top dose.
Figure 2.
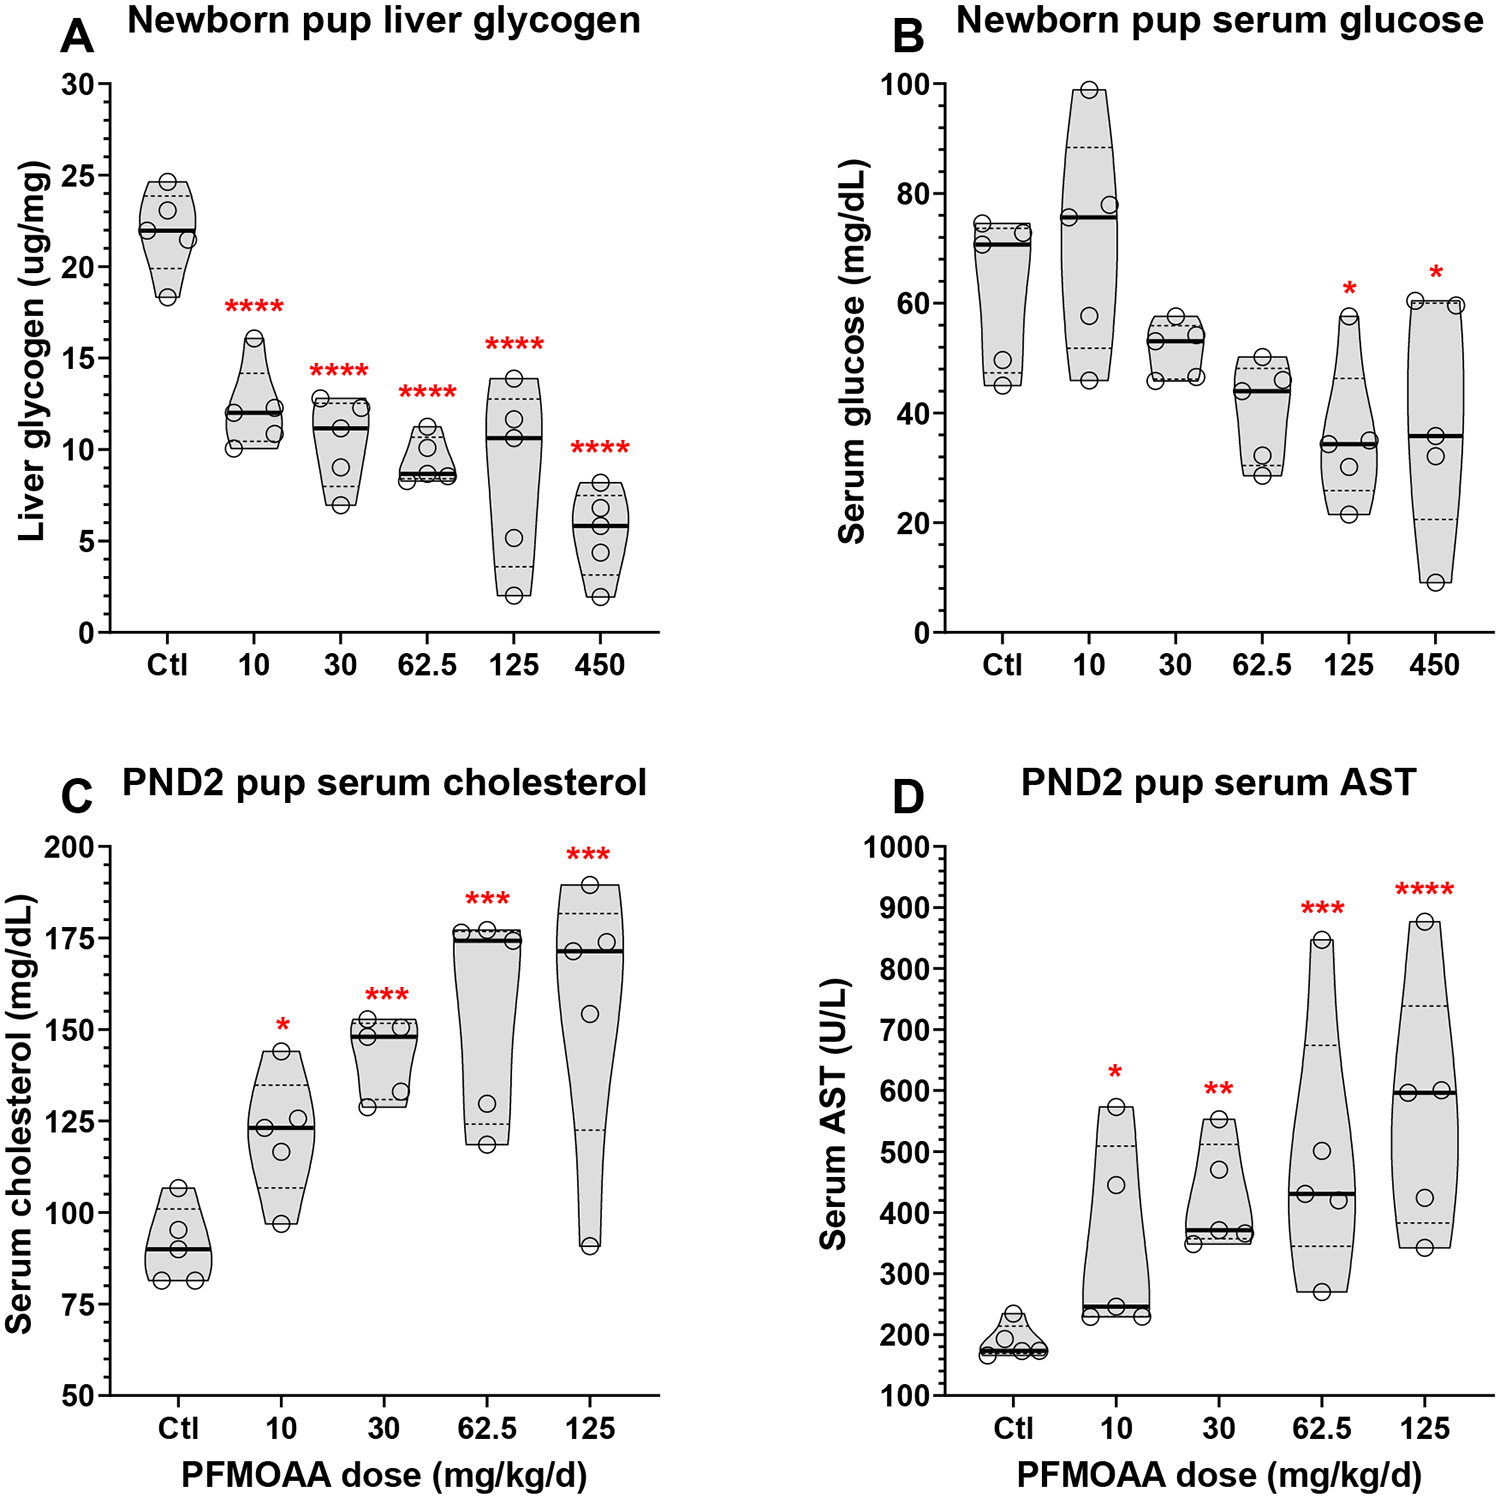
Violin plots of dose responsive changes in pup endpoints at birth (liver glycogen (A) and serum glucose (B)) and at necropsy on PND2 (serum cholesterol (C) and AST (D)) from maternal oral exposure to PFMOAA from GD8-PND2. No data for 450 mg/kg/d dose level presented for PND2 endpoints due to extensive pup mortality. Asterisks represent statistically significant dose level effects compared to concurrent controls (* p<0.05, ** p<0.01, *** p<0.001, **** p<0.0001). Bold horizontal line represents median, dashed horizontal lines represent quartiles.
Similar to liver glycogen concentration, histopathology of H&E stained newborn pup livers indicated depletion of hepatocyte vacuolation, presumed to be associated with the reduced glycogen content (Cochran-Armitage trend test p=0.0064; Table S3). Oil Red O staining of newborn pup livers displayed a non-monotonic increase in hepatocyte lipid content in the middle doses, similar to PND2 pup liver weight below (Table S3).
Mean pup bodyweight was lower than control at ≥30 mg/kg and significant at ≥62.5 mg/kg on PND1 and PND2 (4.1 – 39% reduction in PND2 weight at 30 – 450 mg/kg; Tables 1, S2; Figure 1A). There was a significant effect of sex (p=0.0062) on PND2 pup bodyweight with males heavier than females, but no significant interaction (p=0.42). Pup bodyweight gain from PND0-2 was lower than control in all doses and significant at ≥62.5 mg/kg (2.3 - 72% reduction at 10 – 125 mg/kg; Table S2) with pups in the lone surviving litter at 450 mg/kg losing ~0.6 g. Pup survival based on uterine implants was lower than control at all doses and significant at 450 mg/kg (8.7 – 92% reduction at 10 – 450 mg/kg), while survival based on number of live born pups was lower than control at ≥30 mg/kg and significant at ≥125 mg/kg with 4/5 litters displaying complete pup loss by PND2 at 450 mg/kg (Figure 1A; Tables 1, S2).
Surviving pups on PND2 displayed a significant non-monotonic increase in absolute liver weights at 30 and 62.5 mg/kg (26% and 24% increase, respectively) and nearly significant at 125 mg/kg (16% increase, p=0.051), while top dose liver weight (342 mg, only n=1 surviving litter) was similar to control liver weight (325 mg) (Figure 1B). Adjusting liver weight for pup body weight using ANCOVA or by calculating relative liver weight resulted in significant increases at all doses (19.5 – 54.3% increase in adjusted liver weight; Figure 1B; Tables 1, S2). For adjusted liver weight there were no significant effects of sex (p=0.7) or interaction of dose and sex (p=0.54).
PND2 pups displayed total T4 concentrations that were lower than control at all doses (reduced 32 – 89%; significant at ≥30 mg/kg) while serum total T3 was significantly reduced at all doses (22.5 - 79% reduction at 10 - 125 mg/kg; Figure 1C,D; Tables 1, S2). Total reverseT3 was reduced at all doses (reduced 15 – 40%) and significant at 125 mg/kg (Tables S2). Pup serum clinical chemistry on PND2 was more adversely affected than PND0 serum parameters. Serum total cholesterol, AST, and GLDH were significantly increased at all dose levels (Figure 2C,D; Table S2). Serum AST:ALT, albumin, and total protein were elevated at all doses and significant at ≥30 mg/kg. (Table S2). Serum BUN:creatinine, BUN, globulin, and total bilirubin were elevated at all doses and significant at ≥62.5 mg/kg. Serum glucose was significantly reduced at 125 mg/kg.
3.3. Liver gene expression
Liver mRNA gene expression in newborn pups was evaluated using a fatty acid metabolism pathway-based RT-qPCR array and expression levels of 44/84 genes were significantly altered by maternal PFMOAA exposure (ANOVA p<0.01) (Figure 3A,C; Table S4). Of the 44 affected genes, 35 were upregulated and 9 were downregulated.
Figure 3.

Heatmaps of mRNA gene expression in newborn pup livers exposed to PFMOAA or HFPO-DA from GD8 through delivery (PND0). PFMOAA exposed pups were evaluated using a Fatty Acid Metabolism RT-qPCR array while HFPO-DA used a PPAR Targets Array. Upper panels (A,B) display genes that were shared on both arrays and lower panels (C,D) display significantly altered genes that were only on one of the two arrays. Values in cells represent fold change compared to vehicle controls. Gene names with asterisks indicate gene had ANOVA p<0.01. Dose level significance reported in Table S4. HFPO-DA data previously reported in Conley et al. (2021).
Upregulated genes with the greatest fold changes included Fabp1, Ehhadh, Cpt1b, Acot2, Acot3, Acox1, and Acsm5 which were significantly increased at all dose levels with fold change >10-fold in nearly all doses. In contrast, downregulated genes with the greatest fold changes included Acsbg1, Acadsb, Acox2, Fabp2, and Slc25a5 which were significantly reduced at either ≥10 mg/kg or ≥30 mg/kg with fold change <−2-fold in nearly all doses. A total of 33 genes were significantly affected at 10 mg/kg (Table S4). Given the dosing interval (maternal exposure from GD8 to birth for these samples) it is not possible to determine gene changes that were directly responding to PFMOAA in the pup liver versus indirect effects of PFMOAA on maternal metabolism. Regardless, genes associated with myriad aspects of fatty acid metabolism were strongly affected in newborn pup livers.
For comparison, we previously published mRNA gene expression in newborn pup livers after HFPO-DA exposure from GD8 through delivery 10. In that study we used a PPAR Targets RT-qPCR array while in the current study we used a Fatty Acid Metabolism RT-qPCR array; however, there were primers for several genes present on both arrays, allowing for some comparison between studies. Direct comparison of common gene targets from both arrays demonstrates a similar molecular signature in pup livers following maternal exposure to PFMOAA (this study) and HFPO-DA exposure 10(Figure 3A,B). For both PFAS the most highly upregulated genes were Fabp1, Ehhadh, Cpt1b, and Acox1 while both PFAS downregulated Fabp2. Notable differences were upregulation of Fabp4, Acadl and Acsl5 by PFMOAA but downregulation by HFPO-DA
3.4. Maternal and neonatal internal dosimetry
Serum and liver internal doses in maternal and neonatal rats increased with increasing maternal oral dose (Figure 4A,B, S3; Table S5). Maternal serum on PND2 was ~5-fold higher than neonatal serum levels (Figure S3). An unexpected and striking contrast was observed when comparing maternal serum and liver levels between PFMOAA, PFOA, and HFPO-DA from similar GD8-PND2 exposure studies (Figure 4A,B). Across the full oral dose ranges tested, maternal serum levels on PND2 were similar between PFMOAA and PFOA, while HFPO-DA serum levels were ~20-fold lower and considerably more variable (Figure 4A). Mean maternal liver levels on PND2 were the greatest for PFOA at ~2.4-fold greater than PFMOAA, while HFPO-DA was the lowest at 5.5-fold lower than PFMOAA (Figure 4B). Further, we calculated liver:serum ratios and HFPO-DA was the highest with ~50% greater concentration in the liver than serum, while PFOA had relatively equal ratio (0.96), but PFMOAA had lower levels in the liver compared to serum (mean ratio=0.3; Figure 4C). Given the rapid estimated clearance for each of these three compounds in the female rat, it appears that oral dose absorption may be an important factor with PFMOAA and PFOA reaching similar serum concentrations at a given oral dose, while HFPO-DA was more than an order of magnitude lower.
Figure 4.

Comparison of maternal serum (A) and liver (B) PFAS concentrations between PFMOAA, PFOA, and HFPO-DA from similar experiments with maternal oral exposure from GD8-PND2. Data for PFOA and HFPO-DA adapted from previous publications (Conley et al. 2021, 2022). Serum and liver levels graphed as a function of maternal oral dose and fit with linear regression following log-log transformation, data points represent mean ± 95% confidence interval. Bar graph represents mean (± standard error) ratios of liver:serum concentrations for each PFAS (C).
3.5. Comparison of PFMOAA, PFOA, and HFPO-DA potency
PFMOAA potencies for the range of maternal and neonatal effects measured here were compared to data we previously published from similar studies with PFOA and HFPO-DA. All three of these PFAS have carboxylate functional groups and produced highly consistent effects in maternal and neonatal animals from GD8-PND2 exposure. Given the stark difference in HFPO-DA internal dose described above, as well as the considerably lower molecular weight of PFMOAA, we analyzed dose response curves and calculated RPFs (PFOA=index chemical) as both a function of maternal oral dose on a mass basis (mg/kg/d) and maternal serum concentration on PND2 on a molar basis (μM and corrected for the small counterion contribution) (Figure 5, S4; Table S6). We used GraphPad Prism to statistically compare slopes for each endpoint across all three PFAS and for all endpoints where the slopes were not significantly different (p>0.05) a common slope was fit to all chemical datasets and 10% effect levels (ED10, EC10) were estimated. For maternal liver weight and PND2 pup bodyweight the dose response slopes were significantly different based on maternal oral dose and maternal serum concentration. Despite slope differences we still calculated RPFs for these endpoints to demonstrate the potency differences among compounds. The slope parameters for these endpoints varied ~3-fold and the PFOA slopes were consistently the steepest.
Figure 5.

Relative potency factors (RPF; PFOA=index chemical) across maternal and neonatal endpoints based on maternal oral dose (mg/kg/d; A) or maternal serum concentration on PND2 (μM; B). RPFs were calculated based on the 10% effective doses (ED10) or 10% effective serum concentrations (EC10) using equation RPF=(index chemical ED10 or EC10/test chemical ED10 or EC10). Data reported in Table S6. Data points represent mean RPF, and whiskers are asymptotic profile likelihood 95% confidence intervals calculated in GraphPad Prism.
The most sensitive endpoint (i.e., lowest ED10 and EC10) following PFMOAA exposure was reduced pup liver glycogen concentration, followed by reduced serum thyroid hormone concentrations (total T3 and T4) and increased liver weights in both maternal and neonatal animals (Table S6). These endpoints were the most sensitive regardless of the exposure metric (oral maternal dose versus maternal serum concentration), but the rank order of endpoints differed slightly between oral dose basis and serum concentration basis. On an oral dose basis PFMOAA had only slightly lower RPFs compared to PFOA for 6 of 10 endpoints and the 95% confidence intervals for these effects overlapped with PFOA RPFs. In contrast, PFMOAA was notably more potent for increased maternal and neonatal liver weights (RPFs of 8.4 and 5.0, respectively) and less potent for reduced birthweight (RPF=0.21) and maternal total T4 (RPF=0.38). On a serum molar concentration basis, due to the ~2-fold lower molecular weight of PFMOAA than PFOA, the PFMOAA RPFs were significantly lower (non-overlapping 95% CIs) for all endpoints except increased liver weights, which were similar to PFOA RPFs. Thus, accounting for serum concentration and molecular weight effectively reduced the relative potency of PFMOAA compared to PFOA across these endpoints. Further, across all endpoints modeled, PFMOAA RPFs based on maternal serum concentration ranged 15.1-fold (RPF range, 0.14 – 2.1) and were considerably less variable than RPFs based on maternal oral dose which ranged 39.8-fold (RPF range, 0.21 – 8.44).
The dataset for HFPO-DA was more limited with no available data for PND2 maternal and neonatal serum thyroid hormone concentrations. For the available HFPO-DA endpoints, increased maternal and pup liver weights were the most sensitive. For both endpoints HFPO-DA was more potent than PFMOAA and PFOA, with lower ED10s and EC10s; however, because of the lower maternal serum levels compared to the other two compounds the HFPO-DA RPFs increased dramatically (i.e., ~15-fold) between oral and serum values (e.g., pup liver weight, oral RPF=5.3 vs serum RPF=82.9). In contrast to PFMOAA, the relative potency of HFPO-DA increased from an oral dose basis to maternal serum concentration basis. Futher, the overall range of HFPO-DA RPFs increased from oral dose 30.8-fold (RPF range 0.57-17.5) to RPFs based on maternal serum concentration 41.1-fold (RPF range 5.6 - 231.6).
4. DISCUSSION
The goal of the present study was to investigate the maternal and developmental toxicity of PFMOAA administered during pregnancy in the rat. The data presented here demonstrate that PFMOAA is a maternal and developmental toxicant in the rat. PFMOAA exposure induced numerous health effects, several of which were statistically significant at all dose levels. These effects were consistent with our prior studies examining straight-chain and ether-linked PFAS carboxylates, including PFOA 27 and HFPO-DA 10, 12. Consistent effects across these three PFAS included reduced pup bodyweight, increased maternal and pup liver weights, reduced pup liver glycogen, increased pup mortality, reduced maternal and pup thyroid hormones, highly altered liver gene expression, pup liver histopathological lesions, and multiple altered clinical chemistry parameters. PFMOAA-induced effects generally occurred at similar oral doses as PFOA and HFPO-DA but the relative potencies across effects varied considerably as a function of maternal serum concentrations, particularly for HFPO-DA.
Human exposure to PFMOAA has been reported in the Cape Fear River region of eastern NC, USA and across multiple cities in China. PFMOAA was first detected in Cape Fear River surface water 30 and finished drinking water 31 downstream of a PFAS manufacturing facility at concentrations estimated up 15-fold greater than HFPO-DA, which was detected at 400-500 ng/L. Sun et al. 31 also demonstrated that neither conventional, advanced, nor powdered activated carbon treatments effectively reduced PFMOAA concentrations in drinking water. A subsequent study by McCord et al. 4 quantified PFMOAA as high as ~10,000 ng/L in Wilmington, NC tap water. PFMOAA levels in the tap water in Wilmington, NC decreased ~100-fold over later sampling events as a result of regulatory intervention by local and state officials in NC 32. A human monitoring study was later conducted in the Wilmington, NC area, however due to high background response in the analytical method PFMOAA was not measured in collected serum samples 33. Human biomonitoring studies in Shandong Province, China reported >90% serum detection of PFMOAA in adults with a maximum concentration of 158 ng/mL (95th percentile: 62.4 ng/mL) and a significant negative association with serum glucose levels 23. Yao et al. 22 also recently reported detection of PFMOAA in >95% of human breast milk samples collected across 21 different cities in China at concentrations up to 1,086 ng/L (95th percentile: 107 ng/L). Environmental monitoring studies of estuaries in China have reported 100% detection of PFMOAA in potential human food sources including mollusks, crustaceans, and fish at concentrations as high as 17,100 ng/g (dw; conch) 24, 25. For comparison, the lowest mean serum concentration in neonatal rats corresponding with numerous significant effects (dose: 10 mg/kg/d; serum: 6,700 ng/mL) was ~42-fold higher than the maximum serum concentration reported from the Yao et al. 23 study in China. It is important to reiterate that statistically significant adverse effects occurred at all doses tested here (i.e., no NOAEL) and thus the margin of exposure stated above is greater than one that would be associated with a lack of effects in a rodent study. It is also important to note that the comparison of PFMOAA in rat serum versus human serum constitutes only a single PFAS measure and the studies referenced here, as well as many others, have reported frequent detections of multiple PFAS in human and environmental matrices. Given the widespread detection described above it would be valuable to characterize the direct and potential indirect (e.g., transformation from longer chain PFECAs) environmental sources of PFMOAA.
To our knowledge, there are only two other published studies reporting data from in vivo toxicity studies of PFMOAA. Woodlief et al. 26 conducted 30-day oral experiments in adult C57BL/6 mice exposed to 0.0025, 0.025, and 2.5 mg/kg/d PFMOAA. The authors reported no significant effects on body, liver, or lymphoid organ weights, or in peroxisomal enzyme activity or immune cell function measured by natural killer cell activity or T cell-dependent antibody response. This indicates the dose range was likely too low and/or exposure period was too short to induce any effects. Phelps et al. 34 reported no significant effects on gross zebrafish development or in the neutrophil respiratory burst (innate immune process) in larval zebrafish or a human neutrophil-like cell line in ~96 hr PFMOAA exposures up to 80uM (~16,000 ng/mL). In contrast to the zebrafish exposures, here we observed many effects in Sprague-Dawley rat pups at 10 mg/kg/d, corresponding to pup serum concentrations of ~6,700 ng/mL. It is possible the zebrafish is a developmentally less sensitive model organism than the rat for some chemicals. A different developmental toxicity study in zebrafish reported no effects of HFPO-DA at exposures up to ~5,100 ng/g (whole fish homogenate) 35, while our prior study reported multiple adverse effects in rat pups at HFPO-DA liver levels of ~220 ng/g 10. Developing and testing alternative assays is valuable for chemical screening, but for some effects such as mammalian development the alternative species approaches may not provide sensitive toxicity data for estimating potential human health effects.
In the present study of PFMOAA the most sensitive adverse endpoints based on 10% effect levels (ED10 or EC10) were reductions in maternal and pup serum thyroid hormones (total T3 and T4) and increases in pup and maternal liver weights. For these endpoints the potency of PFMOAA ranged ~7-fold with maternal serum EC10 values between ~38 – 260 μM. In contrast, the maternal serum RPFs (PFOA=index chemical) for these same effects ranged ~15-fold (RPF range: 0.14 – 2.1) due to potency differences for increased pup liver weight between PFOA and PFMOAA. PFMOAA was ~4-7-fold less potent than PFOA at reducing thyroid hormones (serum RPF range: 0.14-0.26), but similar or slightly more potent for liver weight increases (serum RPFs of 1.3 and 2.1 for maternal and pup liver weight increase, respectively). Further, we reported in vitro peroxisome proliferator activated receptor (PPAR) alpha EC20 values for a range of PFAS 9 and the PFMOAA in vitro RPF (0.17) was approximately similar to the lowest RPFs based on maternal serum, but 12-fold different than the RPF for increased pup liver weight. Our recent PFAS mixture studies demonstrated that RPFs for a given endpoint can be highly predictive of mixture effects, but RPFs across endpoints and test systems can be widely variable for PFAS depending on the index chemical, dose metric, target tissue, and endpoint assessed 27, 36.
Chemical disposition is important to the interpretation of PFAS toxicity data and the PFMOAA data reported here is no exception. Data from limited human and animal studies indicate that PFMOAA has rapid clearance in both humans and rodents. In humans, Yao et al. 22 estimated infant renal clearance based on urine concentration of PFMOAA (median: 3.9 mL/kg-d) and predicted the clearance to be similar to PFBS (median: 3.2 mL/kg-d) and considerably faster than long-chain PFAS like PFOA (median: 0.049 mL/kg-d). Bangma, et al. 37 developed a rapid assessment bioaccumulation screening protocol in mice for identifying and prioritizing PFAS based on bioaccumulation potential and found that PFMOAA appeared to be rapidly excreted with high proportions detected in urine and feces. Further, in the mouse immunotoxicity studies by Woodlief et al. 26 no PFMOAA was detectable in serum at any dose level one day after the final oral dose. In female rats PFOA is also rapidly cleared with an estimated half-life of 2.75 hrs 38; however, in humans the PFOA half-life is ~2-3 years 39, 40. Here, the data also indicate there is potentially a substantial difference in oral dose absorption between PFMOAA and PFOA, which produced similar serum concentrations at comparable oral doses, and HFPO-DA, which was more than an order of magnitude lower in serum (see Figure 4). Characterizing human and test animal toxicokinetics is important for extrapolating test animal dose response data to humans and estimating risk; however, it is also important not to conflate rapid clearance with the absence of hazard or potential health risk.41 All of the PFAS carboxylates discussed here have rapid clearance in the female rat and all produced significant effects at the lowest dose tested (10 mg/kg) in our 17-day repeat dose developmental toxicity studies.
It has generally been portrayed that the short-chain PFAS (<7 and <6 perfluorinated carbons for carboxylates and sulfonates, respectively) have reduced toxicity profiles compared to the long-chain PFAS42, partially due to reduced bioaccumulation potential43. PFMOAA is a very short-chain PFAS (i.e., perfluorinated chain length = 3); however, here we observed essentially identical maternal and developmental toxic effects to those we reported for PFOA27 and HFPO-DA10, 12. The main difference was in the relative potencies across the three compounds. Maternal serum concentration-based potencies for PFMOAA were ~3-7-fold weaker than PFOA for most endpoints but PFMOAA was slightly more potent than PFOA for effects on liver weight. In addition, PFMOAA significantly increased relative maternal liver weights at lower dose levels (18% increase at 30 mg/kg) than those reported for PFPrA (7% increase at 80 mg/kg) in adult female rats in a 28-day study 15, 44. Recent hazard evaluations by USEPA and others of short-chain PFAS, such as PFPrA and PFBA, indicate that the toxic effects are generally similar to long-chain PFAS, particularly those with similar functional groups, but bioaccumulation potential is reduced. Thus, risk is likely dependent on the magnitude of exposure levels and subject to joint toxicity from exposure to multiple similar-acting PFAS. Given that multiple state, federal, and international health-based agencies have taken action to limit HFPO-DA and PFOA exposure, and human health toxicity values for PFBA and PFPrA have been derived by USEPA, further toxicological study and assessment of potential human health risks of PFMOAA and other short-chain PFAS exposure is warranted.
Supplementary Material
SYNOPSIS.
Limited toxicity data exist for emerging short-chain and ether-linked PFAS. This study reports maternal and developmental toxicity data for PFMOAA, an emerging short-chain perfluoroalkyl ether PFAS.
ACKNOWLEDGEMENTS
The authors would like to thank Drs. Bevin Blake (EPA), Katie O’Shaughnessy (EPA), and Susan Euling (EPA) for reviewing earlier drafts of the manuscript. This work was supported by the U.S. Environmental Protection Agency Office of Research and Development under the Chemical Safety for Sustainability Research Action Plan.
ABBREVIATIONS
- PFMOAA
perfluoro-2-methoxyacetic acid
- PFECA
perfluoroalkylether carboxylic acid
- PFESA
perfluoroalkylether sulfonic acid
- PFBA
Perfluorobutanoic acid
- PFPrA
perfluoropropionic acid
- PFOA
perfluorooctanoic acid
- HFPO-DA
hexafluoropropylene oxide-dimer acid
- GD
gestational data
- PND
postnatal day
Footnotes
SUPPORTING INFORMATION
Structures of PFAS referenced in manuscript; Schematic diagram of study design; Linear regression of pup and maternal PFMOAA serum concentrations; Dose response curves for shared endpoints for PFMOAA, PFOA, and HFPO-DA as functions of maternal oral doses and serum concentrations; Summary data of all PFMOAA maternal endpoints; Summary data of all PFMOAA neonatal endpoints; Pup liver histopathology evaluation; Summary data of all PFMOAA pup liver mRNA gene expression; Summary data of all PFMOAA analytical chemistry; Summary data of all PFMOAA, PFOA, and HFPO-DA oral ED10 and serum EC10 and RPFs.
DISCLAIMER
The manuscript has been subjected to review by the U.S. Environmental Protection Agency Center for Public Health and Environmental Assessment and approved for publication. Approval does not signify that the contents necessarily reflect the views or policy of the Agency, nor does mention of trade names or commercial products constitute endorsement or recommendation for use.
REFERENCES
- 1.ITRC, PFAS Technical and Regulatory Guidance Document and Fact Sheets. Interstate Technology & Regulatory Council, PFAS Team 2020, 2.2 Chemistry, Terminology, and Acronyms, (https://pfas-1.itrcweb.org/; Date last accessed 12/9/2023). [Google Scholar]
- 2.Pelch KE; Reade A; Kwiatkowski CF; Merced-Nieves FM; Cavalier H; Schultz K; Wolffe T; Varshavsky J, The PFAS-Tox Database: A systematic evidence map of health studies on 29 per- and polyfluoroalkyl substances. Environ Int 2022, 167, 107408. [DOI] [PubMed] [Google Scholar]
- 3.Carlson LM; Angrish M; Shirke AV; Radke EG; Schulz B; Kraft A; Judson R; Patlewicz G; Blain R; Lin C; Vetter N; Lemeris C; Hartman P; Hubbard H; Arzuaga X; Davis A; Dishaw LV; Druwe IL; Hollinger H; Jones R; Kaiser JP; Lizarraga L; Noyes PD; Taylor M; Shapiro AJ; Williams AJ; Thayer KA, Systematic Evidence Map for Over One Hundred and Fifty Per- and Polyfluoroalkyl Substances (PFAS). Environ Health Perspect 2022, 130, (5), 56001. [DOI] [PMC free article] [PubMed] [Google Scholar]
- 4.McCord J; Newton S; Strynar M, Validation of quantitative measurements and semi-quantitative estimates of emerging perfluoroethercarboxylic acids (PFECAs) and hexfluoroprolyene oxide acids (HFPOAs). J Chromatogr A 2018, 1551, 52–58. [DOI] [PMC free article] [PubMed] [Google Scholar]
- 5.McCord J; Strynar M, Identification of Per- and Polyfluoroalkyl Substances in the Cape Fear River by High Resolution Mass Spectrometry and Nontargeted Screening. Environ Sci Technol 2019, 53, (9), 4717–4727. [DOI] [PMC free article] [PubMed] [Google Scholar]
- 6.Washington JW; Rosal CG; McCord JP; Strynar MJ; Lindstrom AB; Bergman EL; Goodrow SM; K. TH; Pilant AN; Washington BJ; Davis MJ; Stuart BG; Jenkins TM, Nontargeted mass-spectral detection of chloroperfluoropolyether carboxylates in New Jersey soils. Science 2020, 368, 1103–1107. [DOI] [PMC free article] [PubMed] [Google Scholar]
- 7.Evich MG; Davis MJB; McCord JP; Acrey B; Awkerman JA; Knappe DRU; Lindstrom AB; Speth TF; Tebes-Stevens C; Strynar MJ; Wang Z; Weber EJ; Henderson WM; Washington JW, Per- and polyfluoroalkyl substances in the environment. Science 2022, 375, (6580), eabg9065. [DOI] [PMC free article] [PubMed] [Google Scholar]
- 8.Wang Z; DeWitt JC; Higgins CP; Cousins IT, A Never-Ending Story of Per- and Polyfluoroalkyl Substances (PFASs)? Environ Sci Technol 2017, 51, (5), 2508–2518. [DOI] [PubMed] [Google Scholar]
- 9.Evans N; Conley JM; Cardon M; Hartig P; Medlock-Kakaley E; Gray LE Jr., In vitro activity of a panel of per- and polyfluoroalkyl substances (PFAS), fatty acids, and pharmaceuticals in peroxisome proliferator-activated receptor (PPAR) alpha, PPAR gamma, and estrogen receptor assays. Toxicol Appl Pharmacol 2022, 449, 116136. [DOI] [PMC free article] [PubMed] [Google Scholar]
- 10.Conley JM; Lambright CS; Evans N; McCord J; Strynar MJ; Hill D; Medlock-Kakaley E; Wilson VS; Gray LE Jr., Hexafluoropropylene oxide-dimer acid (HFPO-DA or GenX) alters maternal and fetal glucose and lipid metabolism and produces neonatal mortality, low birthweight, and hepatomegaly in the Sprague-Dawley rat. Environ Int 2021, 146, 106204. [DOI] [PMC free article] [PubMed] [Google Scholar]
- 11.Conley JM; Lambright CS; Evans N; Medlock-Kakaley E; Hill D; McCord J; Strynar MJ; Wehmas LC; Hester S; MacMillan DK; Gray LE Jr., Developmental toxicity of Nafion byproduct 2 (NBP2) in the Sprague-Dawley rat with comparisons to hexafluoropropylene oxide-dimer acid (HFPO-DA or GenX) and perfluorooctane sulfonate (PFOS). Environ Int 2022, 160, 107056. [DOI] [PMC free article] [PubMed] [Google Scholar]
- 12.Conley JM; Lambright CS; Evans N; Strynar MJ; McCord J; McIntyre BS; Travlos GS; Cardon MC; Medlock-Kakaley E; Hartig PC; Wilson VS; Gray LE Jr., Adverse Maternal, Fetal, and Postnatal Effects of Hexafluoropropylene Oxide Dimer Acid (GenX) from Oral Gestational Exposure in Sprague-Dawley Rats. Environ Health Perspect 2019, 127, (3), 37008. [DOI] [PMC free article] [PubMed] [Google Scholar]
- 13.Blake BE; Cope HA; Hall SM; Keys RD; Mahler BW; McCord J; Scott B; Stapleton HM; Strynar MJ; Elmore SA; Fenton SE, Evaluation of Maternal, Embryo, and Placental Effects in CD-1 Mice following Gestational Exposure to Perfluorooctanoic Acid (PFOA) or Hexafluoropropylene Oxide Dimer Acid (HFPO-DA or GenX). Environ Health Perspect 2020, 128, (2), 27006. [DOI] [PMC free article] [PubMed] [Google Scholar]
- 14.Blake BE; Miller CN; Nguyen H; Chappell VA; Phan TP; Phadke DP; Balik-Meisner MR; Mav D; Shah RR; Fenton SE, Transcriptional pathways linked to fetal and maternal hepatic dysfunction caused by gestational exposure to perfluorooctanoic acid (PFOA) or hexafluoropropylene oxide-dimer acid (HFPO-DA or GenX) in CD-1 mice. Ecotoxicol Environ Saf 2022, 248, 114314. [DOI] [PMC free article] [PubMed] [Google Scholar]
- 15.USEPA, ORD Human Health Toxicity Value for Perfluoropropionic Acid (CASRN 422-64-0 ∣ DTXSID8059970). EPA/600/R-22/042F 2023.
- 16.USEPA, IRIS Toxicological Review of Perfluorobutanoic Acid (PFBA, CASRN 375-22-4) and Related Salts. EPA/635/R-22/277Fc 2022. [PubMed]
- 17.Das KP; Grey BE; Zehr RD; Wood CR; Butenhoff JL; Chang SC; Ehresman DJ; Tan YM; Lau C, Effects of perfluorobutyrate exposure during pregnancy in the mouse. Toxicol Sci 2008, 105, (1), 173–81. [DOI] [PubMed] [Google Scholar]
- 18.USEPA, National PFAS Testing Strategy: Identification of Candidate Per- and Poly-fluoroalkyl Substances (PFAS) for Testing. https://www.epa.gov/system/files/documents/2021-10/pfas-natl-test-strategy.pdf 2021, Date last accessed 12/9/2023.
- 19.OECD, Reconciling Terminology of the Universe of Per- and Polyfluoroalkyl Substances: Recommendations and Practical Guidance. Series on Risk Management No. 61 2022, ENV/CBC/MONO(2021)25. [Google Scholar]
- 20.USEPA, 40 CFR 141: Drinking Water Contaminant Candidate List 5-Final. Federal Register 2022, 2022–23963, EPA-HQ-OW-2018-0594, FRL-7251-02-OW. [Google Scholar]
- 21.Pelch KE; McKnight T; Reade A, 70 analyte PFAS test method highlights need for expanded testing of PFAS in drinking water. Sci Total Environ 2023, 876, 162978. [DOI] [PubMed] [Google Scholar]
- 22.Yao J; Dong Z; Jiang L; Pan Y; Zhao M; Bai X; Dai J, Emerging and Legacy Perfluoroalkyl Substances in Breastfed Chinese Infants: Renal Clearance, Body Burden, and Implications. Environ Health Perspect 2023, 131, (3), 37003. [DOI] [PMC free article] [PubMed] [Google Scholar]
- 23.Yao J; Pan Y; Sheng N; Su Z; Guo Y; Wang J; Dai J, Novel Perfluoroalkyl Ether Carboxylic Acids (PFECAs) and Sulfonic Acids (PFESAs): Occurrence and Association with Serum Biochemical Parameters in Residents Living Near a Fluorochemical Plant in China. Environ Sci Technol 2020, 54, (21), 13389–13398. [DOI] [PubMed] [Google Scholar]
- 24.Li Y; Yao J; Pan Y; Dai J; Tang J, Trophic behaviors of PFOA and its alternatives perfluoroalkyl ether carboxylic acids (PFECAs) in a coastal food web. J Hazard Mater 2023, 452, 131353. [DOI] [PubMed] [Google Scholar]
- 25.Li Y; Yao J; Zhang J; Pan Y; Dai J; Ji C; Tang J, First Report on the Bioaccumulation and Trophic Transfer of Perfluoroalkyl Ether Carboxylic Acids in Estuarine Food Web. Environ Sci Technol 2022, 56, (10), 6046–6055. [DOI] [PubMed] [Google Scholar]
- 26.Woodlief T; Vance S; Hu Q; DeWitt J, Immunotoxicity of Per- and Polyfluoroalkyl Substances: Insights into Short-Chain PFAS Exposure. Toxics 2021, 9, (5). [DOI] [PMC free article] [PubMed] [Google Scholar]
- 27.Conley JM; Lambright CS; Evans N; Medlock-Kakaley E; Dixon A; Hill D; McCord J; Strynar MJ; Ford J; Gray LE Jr., Cumulative maternal and neonatal effects of combined exposure to a mixture of perfluorooctanoic acid (PFOA) and perfluorooctane sulfonic acid (PFOS) during pregnancy in the Sprague-Dawley rat. Environ Int 2022, 170, 107631. [DOI] [PMC free article] [PubMed] [Google Scholar]
- 28.Haseman JK; Bailer AJ; Kodell RL; Morris R; K., P., Statistical issues in the analysis of low-dose endocrine disruptor data. Toxicol Sci 2001, 61, 201–210. [DOI] [PubMed] [Google Scholar]
- 29.Lazic SE; Semenova E; Williams DP, Determining organ weight toxicity with Bayesian causal models: Improving on the analysis of relative organ weights. Sci Rep 2020, 10, (1), 6625. [DOI] [PMC free article] [PubMed] [Google Scholar]
- 30.Strynar M; Dagnino S; McMahen R; Liang S; Lindstrom A; Andersen E; McMillan L; Thurman M; Ferrer I; Ball C, Identification of Novel Perfluoroalkyl Ether Carboxylic Acids (PFECAs) and Sulfonic Acids (PFESAs) in Natural Waters Using Accurate Mass Time-of-Flight Mass Spectrometry (TOFMS). Environ Sci Technol 2015, 49, (19), 11622–30. [DOI] [PubMed] [Google Scholar]
- 31.Sun M; Arevalo E; Strynar M; Lindstrom A; Richardson M; Kearns B; Pickett A; Smith C; Knappe DRU, Legacy and Emerging Perfluoroalkyl Substances Are Important Drinking Water Contaminants in the Cape Fear River Watershed of North Carolina. Environmental Science & Technology Letters 2016, 3, (12), 415–419. [Google Scholar]
- 32.Hopkins ZR; Sun M; DeWitt JC; Knappe DRU, Recently detected drinking water contaminants: GenX and other per- and polyfluoroalkyl ether acids. J Am Water Works Assoc 2018, 110, (7), 13–28. [Google Scholar]
- 33.Kotlarz N; McCord J; Collier D; Lea CS; Strynar M; Lindstrom AB; Wilkie AA; Islam JY; Matney K; Tarte P; Polera ME; Burdette K; DeWitt J; May K; Smart RC; Knappe DRU; Hoppin JA, Measurement of Novel, Drinking Water-Associated PFAS in Blood from Adults and Children in Wilmington, North Carolina. Environmental Health Perspectives 2020, 128, (7). [DOI] [PMC free article] [PubMed] [Google Scholar]
- 34.Phelps DW; Palekar AI; Conley HE; Ferrero G; Driggers JH; Linder KE; Kullman SW; Reif DM; Sheats MK; DeWitt JC; Yoder JA, Legacy and emerging per- and polyfluoroalkyl substances suppress the neutrophil respiratory burst. J Immunotoxicol 2023, 20, (1), 2176953. [DOI] [PMC free article] [PubMed] [Google Scholar]
- 35.Gaballah S; Swank A; Sobus JR; Howey XM; Schmid J; Catron T; McCord J; Hines E; Strynar M; Tal T, Evaluation of Developmental Toxicity, Developmental Neurotoxicity, and Tissue Dose in Zebrafish Exposed to GenX and Other PFAS. Environ Health Perspect 2020, 128, (4), 47005. [DOI] [PMC free article] [PubMed] [Google Scholar]
- 36.Conley JM; Lambright CS; Evans N; Farraj AK; Smoot J; Grindstaff RD; Hill D; McCord J; Medlock-Kakaley E; Dixon A; Hines E; Gray LE Jr., Dose additive maternal and offspring effects of oral maternal exposure to a mixture of three PFAS (HFPO-DA, NBP2, PFOS) during pregnancy in the Sprague-Dawley rat. Sci Total Environ 2023, 892, 164609. [DOI] [PMC free article] [PubMed] [Google Scholar]
- 37.Bangma J; Guillette TC; Strynar M; Lindstrom A; McCord J; Hill D; Lau C; Chernoff N; Lang JR, A rapid assessment bioaccumulation screening (RABS) study design for emerging per-and polyfluoroalkyl substances in mice exposed to industrially impacted surface water. Chemosphere 2022, 308, (Pt 1), 136159. [DOI] [PMC free article] [PubMed] [Google Scholar]
- 38.Dzierlenga AL; Robinson VG; Waidyanatha S; DeVito MJ; Eifrid MA; Gibbs ST; Granville CA; Blystone CR, Toxicokinetics of perfluorohexanoic acid (PFHxA), perfluorooctanoic acid (PFOA) and perfluorodecanoic acid (PFDA) in male and female Hsd:Sprague dawley SD rats following intravenous or gavage administration. Xenobiotica 2020, 50, (6), 722–732. [DOI] [PubMed] [Google Scholar]
- 39.Olsen GW; Burris JM; Ehresman DJ; Froehlich JW; Seacat AM; Butenhoff JL; Zobel LR, Half-life of serum elimination of perfluorooctanesulfonate,perfluorohexanesulfonate, and perfluorooctanoate in retired fluorochemical production workers. Environ Health Perspect 2007, 115, (9), 1298–305. [DOI] [PMC free article] [PubMed] [Google Scholar]
- 40.Li Y; Fletcher T; Mucs D; Scott K; Lindh CH; Tallving P; Jakobsson K, Half-lives of PFOS, PFHxS and PFOA after end of exposure to contaminated drinking water. Occup Environ Med 2017, doi: 10.1136/oemed-2017-104651. [DOI] [PMC free article] [PubMed] [Google Scholar]
- 41.Gomis MI; Vestergren R; Borg D; Cousins IT, Comparing the toxic potency in vivo of long-chain perfluoroalkyl acids and fluorinated alternatives. Environ Int 2018, 113, 1–9. [DOI] [PubMed] [Google Scholar]
- 42.Bowman JS, Fluorotechnology is critical to modern life: the FluoroCouncil counterpoint to the Madrid Statement. Environ Health Perspect 2015, 123, (5), A112–3. [DOI] [PMC free article] [PubMed] [Google Scholar]
- 43.Wang Z; Cousins IT; Scheringer M; Hungerbühler K, Fluorinated alternatives to long-chain perfluoroalkyl carboxylic acids (PFCAs), perfluoroalkane sulfonic acids (PFSAs) and their potential precursors. Environment International 2013, 60, 242–248. [DOI] [PubMed] [Google Scholar]
- 44.CERI, Twenty-eight-day repeated-dose oral toxicity study of T-7701 in rats (3M-MPCA-00215660; B11-0691). Japan: Sumitomo 3M Limited. USEPA HERO; Database ID 8728368 2002. [Google Scholar]
Associated Data
This section collects any data citations, data availability statements, or supplementary materials included in this article.