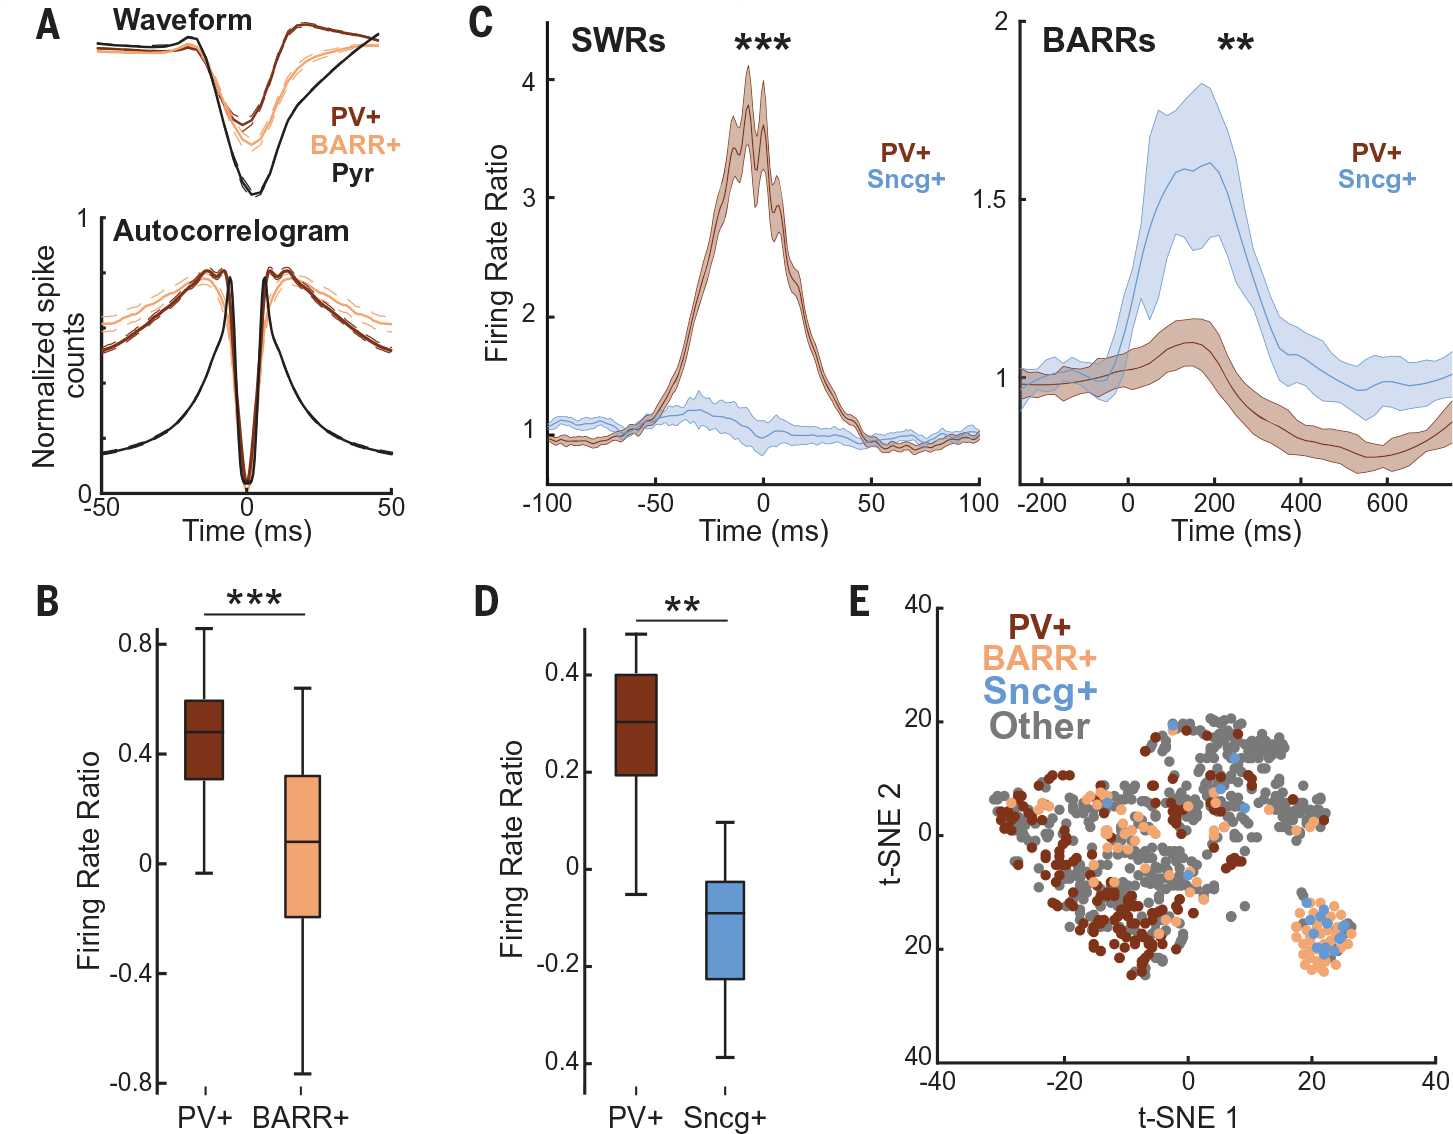
Fig. 3. Sncg+ cells are entrained by BARRs.

(A) (Top) Average waveforms of PV+, BARR+ interneurons, and pyramidal cells (for comparison) (n = 157, 72, and 998 for PV+, BARR+, and pyramidal cells, respectively; n = 10 mice; P < 0.001 for PV+ versus BARR+ waveform width comparison). (Bottom) Averaged normalized autocorrelograms of PV+, BARR+ interneurons, and pyramidal cells (P < 0.001 for PV+ versus BARR+ burstiness comparison). (B) Firing rate difference during periods of running and immobility for PV+ and BARR+ interneurons (P < 0.001). (C) Firing modulation of Sncg+ cells and putative PV+ cells (n = 20/33, respectively, from n = 10 sessions in n = 3 mice) during SWRs (left) and BARRs (right). (D) Firing rate difference during periods of running and immobility for PV+ and Sncg+ interneurons. (E) t-SNE of waveform and firing properties of different interneuron subtypes (from n = 13 mice: PV+, n = 172; BARR+, n = 94; Sncg+, n = 20; other interneurons, n = 510). *P < 0.05; **P < 0.01; ***P < 0.001; Wilcoxon rank sum test unless otherwise noted.
