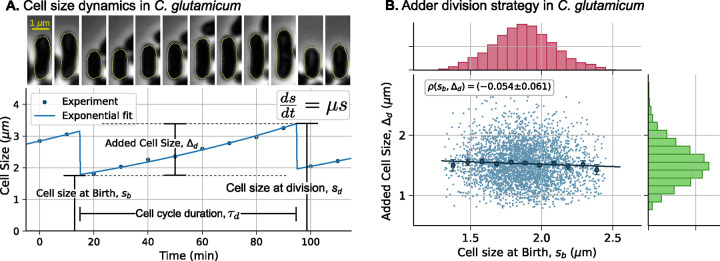
Figure 1: Cell size homeostasis in C. glutamicum occurs via the adder mechanism.
(A) Top: Timelapse of a C. glutamicum cell undergoing division, with one of the newborns randomly chosen for cell size tracking. Bottom: The cell size (quantified by cell length) over time (dots) fits relatively well with exponential growth in cell size (solid line). Key cell cycle variables are illustrated on the plot: the growth law , cell size at birth , cell size at division , added cell size from birth to division (), and cell cycle duration (). (B) Data reveals adder-based cell size control, where is uncorrelated to across C. glutamicum cell cycles. The marginal plots show histograms of cell size at birth (red) and added cell size (green). Data are taken from [34], and we refer readers to this source for experimental details and image segmentation for cell size measurements. The circles on the plot correspond to the mean added size for binned newborn sizes (11 bins), with error bars representing the 95% confidence interval of the mean for each bin. The line represents the linear fit and is the correlation coefficient between and , with the 95% confidence interval obtained using bootstrapping.

