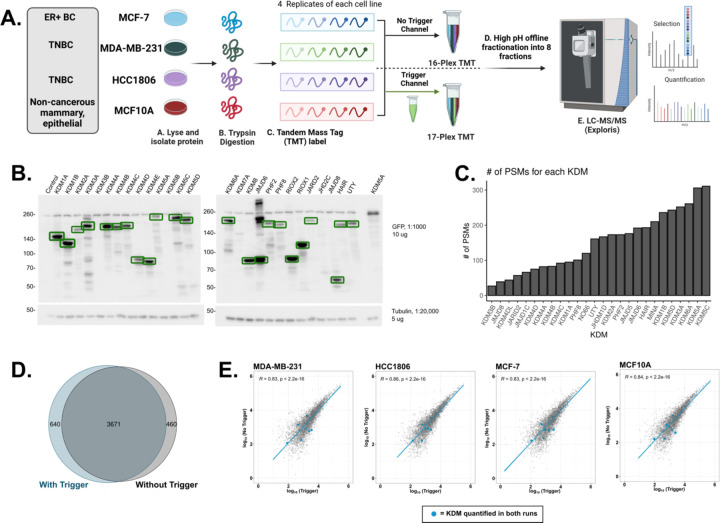
Figure 1: Comparison of the breast cancer proteomes with and without a lysine demethylase trigger channel.
A. Breast cancer cell lines (MCF-7, MDA-MB-231, HCC1806, or MCF10A; n = 4) were collected, lysed, and trypsin/Lys-C digested. Samples were then multiplexed using tandem mass tag (TMT) labels (16-plex). The trigger channel also received its own TMT label, which was then added in a 1:50 ratio to part of the 16-plex, resulting in one 16-plex and one 17-plex. Multiplexes were subjected to high pH offline fractionation and run on the LC-MS/MS. Proteome Discoverer (2.5) was used for database searching. B. Western Blot of the exogenous expression of all GFP-tagged KDMs. Green boxes indicate bands at the predicted molecular weight. C. Bar graph depicting the number of PSMs detected for each KDM detected in the IP-MS experiment. D. Venn Diagram of the quantified protein groups identified with and without the trigger channel. E. Pearson correlation of the log10 average protein abundances observed with (x-axis) and without (y-axis) the trigger channel. Plots are shown by cell line and KDMs quantified in both experiments are shown as blue points.

