

Abstract
As a fundamental biological process, DNA replication ensures the accurate copying of genetic information. However, the impact of this process on cellular plasticity in multicellular organisms remains elusive. Here, we find that reducing the level or activity of a replication component, DNA Polymerase α (Polα), facilitates cell reprogramming in diverse stem cell systems across species. In Drosophila male and female germline stem cell lineages, reducing Polα levels using heterozygotes significantly enhances fertility of both sexes, promoting reproductivity during aging without compromising their longevity. Consistently, in C. elegans the pola heterozygous hermaphrodites exhibit increased fertility without a reduction in lifespan, suggesting that this phenomenon is conserved. Moreover, in male germline and female intestinal stem cell lineages of Drosophila, polα heterozygotes exhibit increased resistance to tissue damage caused by genetic ablation or pathogen infection, leading to enhanced regeneration and improved survival during post-injury recovery, respectively. Additionally, fine tuning of an inhibitor to modulate Polα activity significantly enhances the efficiency of reprogramming human embryonic fibroblasts into induced pluripotent cells. Together, these findings unveil novel roles of a DNA replication component in regulating cellular reprogramming potential, and thus hold promise for promoting tissue health, facilitating post-injury rehabilitation, and enhancing healthspan.
Keywords: Reprogramming, dedifferentiation, DNA polymerase, germline stem cells, intestinal stem cells, induced pluripotent stem cells, Drosophila, human fibroblasts
Introduction
The information encoded in DNA sequences constitutes the fundamental genetic material of life. DNA replication ensures the faithful copying of genetic information for reliable transmission to daughter cells during mitosis. In eukaryotic cells, DNA replication is tightly coupled with nucleosome assembly, which helps maintain or modify epigenetic information (1–5). Consequently, this process presents an opportunity for cells to prime for or initiate alterations in their identities (6–8). However, it remains unclear whether manipulating this process could affect cell fate determination during homeostasis or regeneration in multicellular organisms.
In living organisms, maintaining fitness requires the activity of adult stem cells to counteract cell loss during homeostasis and in response to injury. It has been hypothesized that somatic maintenance and reproduction have opposing effects on organismal lifespan (9, 10), although this relationship may be context-dependent, varying by sex, species, environment, and other factors (11–14). Tissue damage caused by pathogen infection or environmental changes rely on proper adult stem cell function to facilitate healing and growth. However, aging or injury often leads to the loss or impairment of stem cell activity (15–24), underscoring the need for effective strategies to enhance or reactivate adult stem cells for tissue maintenance or repair. Additionally, induced pluripotent stem cells (iPSCs) (25, 26) offer an unprecedented avenue for regenerative medicine to treat various human diseases (27, 28). Researchers have been manipulating core transcription factors, signaling pathway components, microRNAs, and epigenetic modifications, among other approaches, to enhance iPSC reprogramming efficiency (29–37). The potential impact of fundamental biological processes, such as DNA replication, on reprogramming has started to be explored (38–40) but further studies are needed to fully understand their roles and mechanisms in multicellular organisms.
Here, we demonstrate that deliberately reducing Primase levels or DNA Polα activity enhances regenerative capabilities across various stem cell systems. In multiple stem cell models, progenitor cells in heterozygotes for genes encoding DNA Primase subunits exhibit enhanced reprogramming potential, leading to improved regenerative abilities during aging and tissue repair. These primed progenitor cells can functionally replace bona fide stem cells under both physiological and pathological conditions, suggesting a novel pathway for in vivo cell reprogramming within stem cell lineages. Furthermore, our ex vivo data using a well-established iPSC protocol show that an inhibitor modulating DNA Polymerase α (PolA1) facilitates the transition from differentiated cells to a pluripotent state more effectively.
Results
Male flies with reduced Polα levels have sustainable fertility during aging
Drosophila germline stem cell (GSC) lineages serve as a model system for studying stem cell maintenance, differentiation, and reprogramming (41). In both males and females, GSCs sustain the germline through asymmetric divisions, which produce a gonialblast (GB) in males (Fig. 1A, S1B) or a cystoblast (CB) in females (Fig. 2A). GBs and CBs subsequently undergo four additional mitotic divisions before transitioning into meiosis and differentiating into sperm or eggs.
Figure 1: Male flies with compromised Polα have sustainable fertility during aging.

(A) A cartoon depicting the apical tip of the Drosophila testis showing different cell types and their characteristic cellular features. (B–C) Representative images of the apical tips of 35-day old (D35) male testes, showing GSCs with oriented (cyan double-arrowed line pointing to the two separated centrosomes) and misoriented (yellow double-arrowed line) centrosomes in the control (Ctrl, B) and polα50+/− (polα+/−, C) flies. (D) Quantification of the number of GSCs in D1–3 and D35 Ctrl or polα50+/− testes [Ctrl D1–3 = 9.68 ± 0.27 (n = 19); polα50+/− D1–3 = 9.78 ± 0.39 (n = 18); Ctrl D35 = 16.00 ±1.0 (n = 12); polα50+/− D35 = 12.79 ±0.64 (n = 14)]. *P< 0.05, by Mann-Whitney test. (E) Quantification of the percentage of GSCs with misoriented centrosomes in D1–3 and D35 Ctrl or polα50+/− testes [Ctrl D1–3 = 7.19% (n = 153); polα50+/− D1–3 = 6.59% (n = 167); Ctrl D35 = 39.58% (n = 192); polα50+/− D35= 15.64% (n = 179)]. ****P < 10−4, Chi-square test. (F) Quantification of the Stat92E immunostaining signals for both the Ctrl and polα50+/− GSCs in D35 testes. Ctrl GSC Stat92E= 5,746.94 ± 627.66 (n = 33) and polα50+/− GSC Stat92E= 11,872.31 ± 1,118.42 (n = 39), ****P < 10−4 by Mann-Whitney test. (G-H) Representative images of the apical tips of D35 male testes, showing hub location, which is displaced from the testis tip in the Ctrl (G) but retained at the testis tip in the polα50+/− testes (H). Yellow dotted lines outline testes. (I) Quantification of the percentage of testes with displaced hub in D35 Ctrl testes (100%, n=14) or in the polα50+/− testes (40%, n=22). **P < 0.01, Chi-square test. (J) Quantification of fertility at different time points during aging (D0 to D63) for either the Ctrl (green line) or polα50+/− (magenta line) males (see Materials and Methods). Ctrl [D0 = 181.75 ± 6.65 (n = 16); D7 = 176.67 ± 4.46 (n = 18); D14 = 166.45 ± 5.74 (n = 20); D21 = 128.87 ± 15.67 (n = 18); D28 = 122.3 ± 12.38 (n = 20); D35 = 95.42 ± 11.01 (n = 22); D42 = 81.96 ± 9.37 (n = 29); D49 = 46.15 ± 9.15 (n = 13); D56 = 28.09 ± 8.71 (n = 11); D63 = 18.54 ± 8.02 (n = 13)]; and polα50+/− [D0 = 198.14 ± 4.90 (n = 22); D7 = 188.00 ± 4.83 (n = 21); D14 = 196.11 ± 17.35 (n = 22); D21 = 171.96 ± 8.02 (n = 26); D28 =198.05 ± 4.34 (n = 54); D35 =174.13 ± 3.21 (n = 22); D42 = 184.48 ± 6.16 (n = 45); D49 =139.87 ± 9.45 (n = 25); D56 = 46.15 ± 9.15 (n = 19); D63 = 46.15 ± 9.15 (n = 14)]. Two-way ANOVA (fixed-effects), for time factor: ****P< 10−4; for genotype factor: ****P< 10−4, for interaction: ****P< 10−4. (K) The lifespan of control and polα50+/− flies. P > 0.99 by Long-rank (Mantel-Cox) test. (L) A model depicting the dedifferentiation and redifferentiation processes during aging. All values = Average ±SEM. Scale bar: 10μm (B-C), 50μm (G-H), hub: asterisk in (B-C) or arrow in (G-H).
Figure 2: Female flies with reduced Polα levels have sustainable fertility during aging.

(A) Illustration of Drosophila germarium, which can be divided into four regions: 1, 2a, 2b and 3. Each germarium contains 2–4 GSCs (red), locating at the most apical end of the germarium (Region 1). Each GSC divides into a new stem cell and a differentiating Cytoblast (orange). The Cytoblast undergoes 4 rounds of mitosis and form an egg chamber with follicle cells in Region 3, then leave the germarium for further oogenesis. (B) Quantification of female fertility at different time points during aging (D3 to D49) for either the Ctrl (green line) or polα50+/− (magenta line) females (see Materials and Methods). Two-way ANOVA (fixed-effects), for time factor: ****P< 10−1; for genotype factor: ****P< 10−4, for interaction: ****P< 10−4. (C-D) Representative images of the germariums of 3-day old (C) and 40-day old (D) female, showing that GSC number is maintained in polα50+/− females during aging, with higher pMAD signals than the control. GSCs are indicated by cyan dotted circle. Scale bar: 10μm. (E) Quantification of the pMAD immunostaining signals for both the Ctrl and polα50+/− GSCs during aging (see Materials and Methods). Ctrl [D3= 4.822 ± 0.1764 (n = 201); D14= 3.949 ± 0.1847 (n = 185); D28= 3.155 ± 0.1949 (n = 167); D40= 1.405 ± 0.08970 (n = 193)] and polα50+/− [D3= 8.785 ± 0.3895 (n = 118); D14= 4.850 ± 0.1747 (n = 251); D28= 4.845 ± 0.1653 (n = 237); D40= 3.684 ± 0.1423 (n = 377)]. Two-way ANOVA (fixed-effects), for time factor: ****P< 10−4; for genotype factor: ****P< 10−4, for interaction: ****P< 10−4. (F) Quantification GSC number for both the Ctrl and polα50+/− females during aging. Ctrl [D3= 2.294 ± 0.06658 (n = 85); D14= 1.907 ± 0.06057 (n = 97); D28= 1.634 ± 0.05755 (n = 101); D40= 1.504 ± 0.04736 (n = 127)] and polα50+/− [D3= 2.558 ± 0.08354 (n = 43); D14= 2.375 ± 06139 (n = 104); D28= 2.346 ± 0.06800 (n = 104); D40= 2.163 ± 0.05197 (n = 172)]. Two-way ANOVA (fixed-effects), for time factor: ****P< 10−4; for genotype factor: ****P< 10−4 , for interaction: **P< 0.01. All values = Average ±SEM.
Previous studies have shown that aging or injury often leads to the loss of GSCs or their activity (15–24, 42). In the male germline, progenitor spermatogonial cells (SGs) can “dedifferentiate” to re-enter the stem cell niche (17–19, 21, 43). This process could occur both under physiological conditions like aging (18, 44) or following genetic ablation of GSCs (17, 19, 43, 45). Typically, the centrosomes of GSCs are oriented perpendicularly to the GSC-niche interface to facilitate mitotic spindle formation (46–48). In contrast, dedifferentiated GSC-like cells often carry misoriented centrosomes. This misorientation could activate a “centrosome orientation checkpoint,” which blocks successful mitosis and arrests GSCs in the G2 phase until corrected (18, 49, 50). As GSCs gradually turnover with age, the niche is increasingly occupied by dedifferentiated SGs, potentially leading to dysfunctional germline and reduced fertility in aged males (18).
In a previous study, GSCs exhibit reduced levels of several DNA replication machinery components compared to SGs, including DNA Polymerase α (Polα) (51). This suggests that DNA replication machinery may critically regulate germline function in a stage-specific manner, potentially influencing key processes such as differentiation and dedifferentiation. In our study, we investigated whether reducing Polα in SGs could enhance their ability to restore GSC activities upon dedifferentiation. Since DNA replication is essential for cell cycle progression and survival, we aimed to modulate replication machinery components without inducing lethality or cell cycle arrest. To this end, we used a null allele of the polα50 gene, which encodes DNA Primase Subunit 1 (Prim1) involved primarily in lagging strand synthesis. The heterozygous pola50+/− flies are viable and exhibit no readily apparent phenotypes. We then evaluated whether pola50+/− SGs can more effectively replace GSCs compared to controls by examining cellular features and redifferentiation capabilities of the dedifferentiated GSC-like cells, with a focus on the effects of aging.
In this experimental design, both control and polα50+/− male flies were examined in parallel from newly eclosed (D0) to 63 days old (D63, Fig. S1A). The control flies were obtained by crossing two wild-type strains (Materials and Methods) to avoid any potential advantages from outcrossing, which was also used to generate the polα50+/− heterozygotes. We first assessed GSC cellular features and testicular morphology in males from different age groups. Consistent with previous reports (18, 52, 53), the number of GSCs in D1–3 control and polα50+/− males was comparable (Fig. 1D). By D35, the GSC number showed a slight difference, with control testes having an average of three more GSCs than polα50+/− males (Fig. 1B–D). However, the percentages of GSCs with misoriented centrosomes changed more dramatically: at D1–3, the two genotypes showed no difference, but by D35, this percentage in control males was approximately 2.5 times higher than in polα50+/− males (Fig. 1B–C, 1E). Additionally, the critical “stemness” transcription factor Stat92E (54–57) was significantly elevated in polα50+/− GSCs compared to control GSCs in D35 testes (Fig. 1B–C, 1F). Morphologically, testes from D35 control males often had abnormal niche anatomy, such as a displaced hub structure (Fig. 1A, 1G, 1I, S1C–E) and a thin overall testicular structure with elongating and mature sperm in the terminal differentiating regions (Fig. 1G, S1F). In contrast, testes from D35 polα50+/− males displayed a normal hub structure at the testis apical tip (Fig. 1A, 1H–I) and a normal testicular structure with properly organized terminal differentiating regions (Fig. 1H, S1G). The displaced hub in older control flies may result from age-dependent decreases in adhesion molecule expression (16). This anatomical shift of the hub structure from the apical tip to the center of the testis may contribute to the increased number of GSCs, which were counted as the germ cells surrounding the hub (Fig. 1A, 1D, 1G, 1I).
To further assess the redifferentiation capabilities of dedifferentiated GSCs during aging, we conducted a time-course fertility assay using males from different age groups. Intriguingly, polα50+/− males maintained persistent fertility from D0 to D63, with a noticeable reduction only beginning at D42 (Fig. 1J). Even after D49, polα50+/− males still retained relatively high fertility until D63, whereas the control males were almost sterile by this time. In stark contrast, control males exhibited a continuous decline in fertility from D14 to D63 (Fig. 1J). These results demonstrate a pronounced divergence in male fertility between polα50+/− and control males across different stages of aging (Fig. 1L, S1H).
Female flies with reduced Polα levels have sustainable fertility during aging
Drosophila oogenesis relies on the activity of female GSCs [Fig. 2A, (58); reviewed in (59, 60)]. In the female GSC niche, Bone Morphogenetic Protein (BMP) signaling from the niche regulates GSC identity and activity by phosphorylating Mothers against decapentaplegic (pMad), which in turn activates Daughters against decapentaplegic (Dad) expression for GSC maintenance and function (61–70). We next investigated whether the enhanced pola50+/− male germline activity can also be detected in the female germline. As previously shown, aging induces multiple changes in the female germline, including decreased GSC number, reduced BMP signaling (65, 71), and deteriorated female fertility over time (72).
We first tested the fertility of pola50+/− female flies over a 49-day period. We found that pola50+/− females consistently displayed higher fertility compared to control females from D3 to D49 (Fig. 2B). Although pola50+/− females showed reduced fertility at D49, their fertility was still significantly higher than that of D49 control females and even exceeded that of D21 control females. In contrast, control females were almost completely sterile by D35 (Fig. 2B). These results demonstrate that pola50+/− flies have sustained fertility in both males and females.
To explore the underlying mechanisms contributing to the enhanced female fertility, we first investigated BMP signaling activity in female GSCs. Immunostaining experiments revealed consistently higher levels of pMad in pola50+/− GSCs compared to control GSCs over a 40-day period (Fig. 2C–E). Sustained pMad levels led to consistently higher GSC numbers in pola50+/− ovaries than in control ovaries, with significant differences in GSC numbers evident throughout the 40-day period (Fig. 2F). Taken together, these findings indicate that GSCs in pola50+/− female flies exhibit substantially higher GSC maintenance, elevated levels of “stemness” factors, and increased germline activity during aging.
Remarkably, in a longevity assay [adapted from (73), Materials and Methods], both pola50+/− and control flies exhibited comparable lifespans (Fig. 1K). Notably, there were no significant differences in lifespan between control and pola50+/− flies, regardless of whether males, females (individual sex data not shown), or both sexes combined were considered (Fig. 1K). These findings confirm that the sustained fertility observed in pola50+/− males and females does not come at the expense of a shortened lifespan, indicating genuine reproductive longevity and extended fertility lifespan.
C. elegans with reduced Polα levels have higher fertility
In C. elegans, the pola-1 gene encodes the homolog of the POLA1 catalytic subunit of the DNA Polα–Primase complex. During adulthood, germline POLA-1 plays a critical role in GSC maintenance and germ cell proliferation (74). Here, we investigated whether pola-1 heterozygosity could enhance hermaphrodite fertility. We used a null allele of the pola-1 gene, pola-1(gk5576) (75). The pola-1+/− heterozygous strain is viable and shows no discernible phenotypic abnormalities.
We first compared the fertility of pola-1+/− heterozygotes to wild-type hermaphrodites. Interestingly, a significantly larger brood size in pola-1+/− worms was observed compared to wild-type controls (Fig. 3B). To further explore whether pola-1+/− heterozygotes exhibit higher GSC maintenance during aging, we used a GFP reporter (76) that specifically labels the GSC and progenitor cells in the gonad (Fig. 3A). Live-imaging of this reporter in pola-1+/− heterozygotes and wild-type worms revealed that reducing POLA-1 levels confer advantages to a higher GSC number compared to wild-type later into adulthood (D5 in Fig. 3C–D). These results suggest that, as observed in Drosophila, reduction of POLA-1 levels via heterozygosity significantly enhances fertility and GSC maintenance in C. elegans.
Figure 3: C. elegans with reduced POLA1 levels have higher fertility.

(A) Illustration of the C. elegans hermaphrodite gonad (110, 111). Germline nuclei are arranged in a spatiotemporal pattern progressing from the distal most GSCs [green: GFP under the control of the pie-1 promoter and the zif-1 3’UTR (76); red: mCherry labeling all germline nuclei]. The transition zone (TZ) contains meiotic leptotene/zygotene stages. Oocytes become fully cellularized by late diakinesis, pass through the spermatheca filled with sperm and undergo early embryonic development in utero. (B) Brood sizes for pola-1(gk5576)/+ (n=30) and wild-type (n=30). Each data point represents the number of living larvae from individual worms with the corresponding genotype. *P< 0.05 by unpaired t test. (C) Representative images of wild-type and pola-1(gk5576)/+ taken at Day 1, Day 3, or Day 5 of adulthood. The strain GC1413 rrf-1[pk1417; naSi2 (Pmex5::H2B::mCherry::nos-2 3’UTR); teIs113 (Ppie-1::GFP::H2B::zif-1 3’UTR)] was used. The dashed lines outline the gonads. (D) Quantification measured by rows of cells from the distal end. All values = Average ±SEM. P = 0.06 [Day 1, pola-1(gk5576)/+ (n= 12), wild-type (n=11)]; P = 0.09 [Day 3, pola-1(gk5576)/+ (n= 13), wild-type (n=16)]; **P< 0.01 [Day 5, pola-1(gk5576)/+ (n= 12), wild-type (n=7)]; by unpaired t test. (E) Survival analysis of wild-type, pola-1(gk5576)/+, and daf-2(e1370). No significant difference between wild-type and pola-1(gk5576)/+, by Long-rank (Mantel-Cox) test. Scale bar, 50 μm.
Next, we assessed whether the observed increase in fertility of pola-1+/− heterozygotes affects their lifespan. Here, we included three strains: wild-type (N2), pola-1+/− heterozygotes, and the well-characterized long-lived daf-2(e1370) mutant (77). We found no significant difference in the lifespan between pola-1+/− heterozygous and the wild-type strains (Fig. 3E). In contrast, the daf-2 mutants nearly doubled their lifespan relative to wild-type worms, consistent with the previous report (77). Together, these results indicate that reduced POLA-1 levels enhance C. elegans fertility without compromising lifespan, suggesting that this phenomenon is conserved between flies and worms.
Male flies with reduced Polα levels have enhanced regeneration capabilities in testes
In addition to declining stem cell activity during aging, stem cells often demonstrate regenerative capabilities in response to tissue damage. For example, genetic ablation of bona fide GSCs can trigger dedifferentiation of the progenitor SGs in the Drosophila male germline (43, 45, 53). This acute approach can complement studies of gradual changes that accumulate over time during aging.
To achieve this goal, we studied how GSCs recover after genetic ablation. We ectopically expressed the grim gene (78, 79) in early-stage germ cells using a temporally controllable system (nos-Gal4ΔVP16; tubulin-Gal80ts; UAS-grim), followed by a recovery period to allow dedifferentiation (Fig. 4A–B). Grim inhibits apoptotic antagonists and promotes apoptosis (80–82). This genetic ablation approach effectively caused GSC death in both control (Fig. 4C–D) and polα50+/− testes (Fig. 4E), as evidenced by the substantially decreased GSCs following grim overexpression (Fig. 4H). The increased retention of GSCs in polα50+/− testes compared to controls may result from higher resistance to Grim overexpression or faster dedifferentiation. Nevertheless, during recovery, dedifferentiation led to significantly increased GSC-like cells in both control (Fig. 4F, 4H) and polα50+/− (Fig. 4G–H) testes. However, dedifferentiated GSCs often exhibited misoriented centrosomes (Fig. 4F–G, 4I), consistent with previous reports (18, 52, 53). Intriguingly, we found that dedifferentiated GSCs in polα50+/− testes had significantly fewer instances of misoriented centrosomes compared to control testes (Fig. 4J). Notably, despite the nearly doubling of GSC numbers after recovery in polα50+/− testes (Fig. 4H), the percentage of GSCs with misoriented centrosomes remained unchanged (Fig. 4J), indicating that nearly all dedifferentiated polα50+/− GSCs tended to have properly oriented centrosomes. These results demonstrate that dedifferentiated GSCs in polα50+/− testes possess more bona fide GSC-like cellular features, such as properly oriented centrosomes, in addition to molecular features, such as Stat92E expression (Fig. 1F), compared to dedifferentiated GSCs from control testes.
Figure 4: Dedifferentiated spermatogonial cells with reduced Polα levels tend to have properly oriented centrosomes and re-differentiate for increased male fertility.

(A) A cartoon depicting the genetic ablation by overexpression of Grim (Grim-OE) that results in depletion of early-stage germ cells followed by recovery. (B) The temperature shift scheme to activate Grim expression (at 31°C, Grim-OE) followed by inhibiting Grim expression (at 18°C, Grim-Inh) using the Gal4; Gal80ts system in adult flies. (C) A control (Ctrl) testis tip showing early-staged germ cells. (D) A representative image of the control (Ctrl, UAS-grim) testis tip showing a complete ablation of early-staged germ cells upon Grim-OE for four days at 31°C. (E) A representative image of the polα50+/−; UAS-grim testis tip showing significantly reduced GSCs number upon Grim-OE for four days at 31°C. (F-G) Upon recovery for four days at 18°C, a representative image of the Ctrl UAS-grim (F) and a representative image of the polα50+/−; UAS-grim (G) testes tips showing GSCs with oriented centrosomes (cyan double-arrowed line pointing to the two centrosomes) and GSCs with misoriented centrosomes (yellow double-arrowed line pointing to the two centrosomes), respectively. In (C-G): White dotted outlines indicate the testis tip, cyan dotted lines demarcate the GSC/GB region, from cyan to yellow dotted lines denote the 2–4 cell SGs, beyond yellow dotted line is the 8–16 cell SG region. (H) Quantification of the number of GSCs per testis in the Ctrl [Ctrl = 9.56 ± 0.27 (n=16)] and Grim-OE testes after genetic ablation [Abl (Ctrl)= 0 ± 0 (n=22)] and upon recovery [Recv (Ctrl)= 8.7 ± 0.36 (n=20)]; in the polα50+/−; UAS-grim after genetic ablation [Abl (polα+/−)= 5.08 ± 0.36 (n=26)] and upon recovery [Recv (polα+/−)= 9.14 ± 0.32 (n=28)]; ****P < 10−4, Mann Whitney test. (I) A cartoon depicting the quantification of oriented versus misoriented centrosomes in GSCs. (J) Quantification of the percentage of GSCs with misoriented centrosome in the Ctrl without genetic ablation (Ctrl= 7.19%, n = 153), in the Ctrl UAS-grim after genetic ablation [Abl (Ctrl)= 0%, n= 22] and upon recovery [Recv (Ctrl)= 33.91%, n=174]; in the polα50+/−; UAS-grim after genetic ablation [Abl (polα+/−)= 15.16%, n=132] and upon recovery [Recv (polα+/−)= 14.45%, n=256]. ****P < 10−4, Chi-square test. (K) Quantification of fertility at different time points during genetic ablation (D0 to D4 at 31°C) followed by recovery (D4 to D8 at 18°C) and aging (D8 to D49 at 25°C) for either the Ctrl (green line) or polα50+/− (magenta line) males with Grim overexpression (see B and Materials and Methods). Grim [D7 = 4.34 ± 2.61 (n = 41); D14 = 89.88 ± 8.80 (n = 43); D21 = 102.43 ± 8.58 (n = 51); D28 = 84.09 ± 24.90 (n = 11); D35 = 86.81 ± 12.35 (n = 32); D42 = 62.5 ± 16.68 (n = 14); D49 = 40.64 ± 12.85 (n = 11)]; and Grim; polα50+/− [D7 = 36.08 ± 18.19 (n = 12); D14 = 74.92 ± 8.71 (n = 25); D21 = 80.55 ± 10.21 (n = 20); D28 = 94.11 ± 9.11 (n = 35); D35 = 124.68 ± 17.24 (n = 22); D42 = 141.68 ± 13.02 (n = 25); D49 = 96.42 ± 9.59 (n = 24)]. Two-way ANOVA (fixed-effects), for time factor: ***P< 10−3; for genotype factor: ****P< 10−4, for interaction: ***P< 10−3. (L) A cartoon depicting recovery from genetic ablation, a model to investigate de-differentiation and re-differentiation. Scale bar: 25μm (C-D), 10μm (E-G), asterisk: hub.
To further assess the redifferentiation capabilities of dedifferentiated GSCs following genetic ablation, fertility tests were conducted using both control and polα50+/− males after recovery from grim overexpression (Fig. 4B). During the initial phase after recovery (D7 to D28), both genotypes exhibited comparable fertility (Fig. 4K). However, starting from D35, polα50+/− males showed significantly higher fertility than the controls, with this difference persisting up to D49 (Fig. 4K). These data demonstrate that in the male germline of polα50+/− flies, dedifferentiated GSCs can more effectively replace bona fide GSCs compared to controls (Fig. 4L), suggesting enhanced regenerative potential.
In summary, our results demonstrate that dedifferentiated pola50+/− GSCs can effectively replace bona fide GSCs under both physiological (Fig. 1) and pathological (Fig. 4) conditions. This suggests that fine-tuning the activity of specific DNA replication components, such as Primase, may be sufficient to restore GSC-like features in dedifferentiated cells during aging and tissue repair. Given the conserved role of DNA replication in cellular reprogramming, targeting specific DNA polymerases could represent a promising strategy in regenerative medicine.
Female flies with reduced Polα levels have enhanced regeneration capabilities in midgut
In addition to the germline maintained by GSCs, Drosophila intestinal stem cells (ISCs) in the midgut represent a model somatic stem cell system (Fig. 5A–B), characterized by a well-defined lineage, abundant and easily distinguishable ISCs, as well as responsiveness to environmental cues such as nutrition, infection, and aging (83–87). We asked whether the enhanced regeneration abilities observed in the male germline are preserved in this somatic stem cell lineage.
Figure 5: The polα50 heterozygotes have enhanced regeneration capabilities in midgut. (A) Drosop.
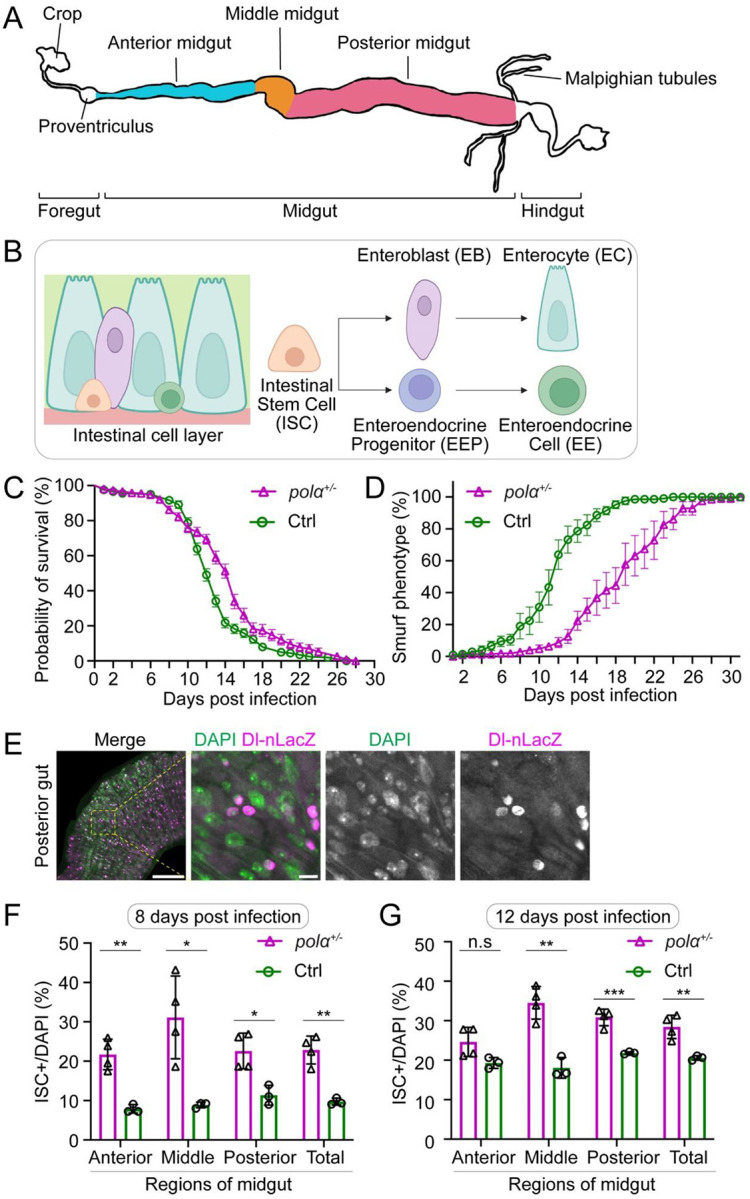
hila midgut anatomy: The midgut, located between the Proventriculus (Cardia) and Malpighian tubules, is divided into anterior, middle, and posterior sections based on morphology. (B) The fly midgut has a defined stem cell lineage performing diverse functions. Intestinal Stem Cells (ISCs), located at the basal membrane, are multipotent and self-renewing. ISCs differentiate into Enteroblasts (EBs) or Enteroendocrine Progenitor Cells (EEPs). EBs give rise to Enterocytes (ECs), responsible for secreting digestive enzymes and absorbing nutrients, while EEPs develop into Enteroendocrine Cells (EEs), which regulate hormonal balance through gut hormone secretion. (C) Probability of survival post-infection: Control (Ctrl, green line, n= 202) vs. pola50+/− heterozygotes (magenta line, n= 268). The median survival time: Ctrl= D12 vs. pola50+/−= D15. Kaplan-Meier test: Log-rank (Mantel-Cox) test, P< 10−4. (D) Smurf assay post-infection: Control (Ctrl, green line, n= 210) vs. pola50+/− heterozygotes (magenta line, n= 210). Two-way ANOVA (mixed-effects), for time factor: ****P< 10−4; for genotype factor: P< 10−3. (E) Immunostaining of midguts: Delta-nlacZ (magenta), DAPI (green). Scale bar: 100μm for the zoom-out and 10μm for the zoom-in images. (F-G) Percentage of ISCs across different midgut regions of Ctrl (n= 3) and pola50+/− heterozygotes (n= 4) on Day 8 (F) and Day 12 (G) post-infection: The percentage of ISCs are significantly higher (Unpaired t test) across different regions compared to the control on both time points, ns: not significant (P> 0.05), * P< 0.05, **P< 10−2, ***P< 10−3.
To determine whether pola50+/− heterozygotes confer advantages in response to tissue damage, we infected flies with a lethal strain of Chromobacterium subtsugae, a bacterium that is orally toxic to various insects, including Drosophila melanogaster, and used as an insecticide (88, 89). The C. subtsugae strain ΔvioS causes lethality of flies through producing secondary metabolites, which are normally inhibited by the VioS repressor and regulated by the quorum sensing system (89).
To validate the lethal effect of the ΔvioS strain, we implemented a regime of a brief starvation followed by feeding flies with either Luria-Bertani (LB) media (non-infected group) or ΔvioS-containing media (infected group). Both groups were then monitored for survival on fresh fly food over time (Fig. S2A). The non-infected control flies exhibited consistently high survival rates throughout a 28-day time course (Fig. S2C). In stark contrast, the infected control flies showed a sharp decline in survival starting from Day 8 (D8), with near-zero survival by day 20 post-infection (Fig. 5C). In a parallel assay using pola50+/− heterozygotes, the non-infected group showed almost no difference from control flies (Fig. S2C), while the infected group exhibited improved survival compared to controls, marked by a delayed decline in survival and a significantly extended post-infection lifespan in pola50+/− heterozygous flies (Fig. 5C).
To investigate the mechanism of oral pathogen-induced lethality, we introduced a blue dye into the food (referred to as ‘smurf food’) and fed it to the flies post-infection (90) (Fig. S2A). This assay allows visualization of intestinal damage. In healthy flies, the dye remains confined to the intestine (Fig. S2B). However, pathogen infection causes increased intestinal permeability, resulting in blue pigment leakage into the body cavity, which can be visualized and quantified as a “smurf phenotype” (Fig. S2B). Both non-infected control and pola50+/− flies showed very low percentages of flies with the smurf phenotype (Fig. S2D). Contrastingly, infected pola50+/− flies consistently showed a lower percentage of smurf phenotype than infected control flies during a 30-day period (Fig. 5D). These results demonstrate improved maintenance in the midgut of pola50+/− heterozygotes compared to controls in response to pathogen-induced tissue damage.
To further understand tissue repair at the cellular level, we examined the expression pattern of Delta, a key ISC stem cell fate determinant (91, 92). Using a Delta-nuclear lacZ (Dl-nLacZ) reporter to mark ISCs (93–95), we quantified the percentages of the nLacZ-positive cells at three distinct regions of the midgut (Fig. 5A) at two time points (D8 and D12 post-infection) in both pola50+/− and control flies. These timepoints were chosen to correspond with the onset of rapid decline (D8) and approximately 50% survival (D12) of post-infected control flies (Fig. 5C). We found that ISCs were consistently higher in pola50+/− than in control flies across different midgut regions, resulting in significantly increased ISCs in pola50+/− midguts compared to the control at both timepoints (Fig. 5E–G), suggesting higher self-renewal or maintenance abilities of pola50+/− ISCs compared to the control. In summary, pola50+/− flies show increased resistance to pathogen-induced tissue damage in the midgut, leading to improved survival during post-injury recovery.
Slightly reducing Polα activity enhances the efficacy of human iPSC induction
Thus far, we have demonstrated that compromising one allele of the Polα- or Primase-encoding genes in flies and worms can enhance the sustainability of adult stem cell systems or increase their resilience to tissue damage. Next, we aimed to explore whether pharmacologically modulating Polα activity could yield similar benefits, potentially establishing it as a viable therapeutic strategy for promoting stem cell regeneration.
Using human neonatal dermal fibroblasts, we conducted induced pluripotent stem cell (iPSC) reprogramming experiments with the CytoTune™-iPS 2.0 Sendai Reprogramming Kit (96), which overexpresses the transcription factors OCT3/4, SOX2, KLF4, and C-MYC (25). We employed a Polα inhibitor that impedes the DNA binding affinity and primer elongation activity of the DNA Polymerase α subunit 1 (PolA1) (97). Given that this inhibitor blocks DNA replication at relatively high concentrations (0.1 −1 μM in Fig. S3A–B), we first optimized its concentration to minimize any adverse effects on DNA replication itself, as indicated by comparable S-phase indices between treated and untreated fibroblasts (Fig. S3A–B). Subsequently, we used an optimized concentration of the PolA1 inhibitor during the iPSC induction process (10– 20nM).
Using the PolA1 inhibitor at the optimized concentration (Fig. 6A), we observed that reducing Polα activity during the early reprogramming stage enhances this process, as indicated by the earlier appearance, higher rate, and larger size of iPSC colonies in inhibitor-treated cells compared to untreated cells at the same timepoints during reprogramming. Cells treated with the PolA1 inhibitor showed higher ratios of SSEA-4-positive cells, an early pluripotency marker (98, 99), starting from D6 and extending to D13 (Fig. 6B–C). Intriguingly, the well-established ‘stemness’ marker NANOG was detectable as early as D2 in PolA1 inhibitor-treated cells and remained more abundant compared to the control from D2 to D13 (Fig. 6D–E, S3C). Meanwhile, the fibroblast differentiation marker Platelet-Derived Growth Factor Receptor alpha (PDGFRα) was less enriched in the PolA1 inhibitor-treated cells compared to the control from D2 to D13 (Fig. 6D–E, S3C). Furthermore, PolA1 inhibitor-treated cells exhibited brighter staining for TRA-1–60, a live cell dye for ‘stemness’ (100), compared to the control cells at D11 (Fig. S3D). Finally, DNA staining revealed a higher incidence and larger colony size in PolA1 inhibitor-treated cells compared to control cells at D18 (Fig. 6F). Together, these results indicate a better transition from differentiated to pluripotent state in the PolA1 inhibitor-treated cells.
Figure 6: PolA1 inhibition enhances the human iPSCs reprogramming efficiency.

(A) The workflow of CytoTune™-iPS 2.0 Sendai virus reprogramming used to generate human iPSCs with and without PolA1 inhibitor. (B) The SSEA-4 staining and (C) The percentage of SSEA-4+ cells at different time points during human iPSC reprogramming. Two-way ANOVA (fixedeffects), for time factor: ****P< 10−4; for inhibitor factor: **** P< 10−4; for interaction: **P< 0.01. (D) The NANOG and PDGFRα staining and (E) The percentage of NANOG+ cells and integrated intensity of PDGFRα staining signals per cell at different time points during human iPSC reprogramming. NANOG+ cells: two-way ANOVA (fixed-effects), for time factor: ****P< 10−4; for inhibitor factor: ****P< 10−4; for interaction: *P< 0.05. PDGFRα intensity: two-way ANOVA (fixed-effects), for time factor: ****P< 10−4; for inhibitor factor: ****P< 10−4; for interaction: P= 0.158 (not significant, ns). (F) The whole dish imaging of human iPSCs stained with DNA dye Hoechst 33342 with and without PolA1 inhibitor. More and larger iPSC colonies were detected in PolA1 inhibitor-treated cells at D18 after reprogramming induction. ***P <10−3, by Mann Whitney test. (G) snRNA-seq data of human iPSCs with or without PolA1 inhibitor during induction are visualized in UMAP, together with two publicly available scRNA-seq datasets of human iPSCs. Seurat was used to generate the plot after removing the batch effect with its “CCAIntegration” method.
To further investigate the properties of the reprogrammed iPSCs, immunostaining for well-known stem cell markers, including the transcription factors NANOG, OCT4, and SOX2, validated the pluripotent state of human iPSCs derived from both PolA1 inhibitor-treated and control cells at the end of the reprogramming processes (Fig. S3E). To assess the quality of the resulting iPSCs, we performed single-nucleus RNA sequencing (snRNA-seq) and compared reprogrammed iPSCs generated in the presence and absence of the PolA1 inhibitor with published data (101, 102). Our analysis showed that the obtained iPSCs exhibited strong pluripotency markers and a transcriptome profile largely overlapping with those of well-established human iPSCs (Fig. 6G, S3F). These findings confirmed that the iPSCs we generated maintain molecular features comparable to well-characterized iPSCs and that treatment with the PolA1 inhibitor did not compromise iPSC quality. In conclusion, our results suggest that a selective and slight inhibition of PolA1 can enhance the generation of human iPSCs, improving both the efficiency and dynamics of reprogramming.
Discussion
The loss of stem cells or their functionality is often exacerbated by aging or injury, prompting the need for regenerative strategies in vivo. In this study, we found that manipulating a key DNA replication component allows non-stem cells to effectively substitute bona fide stem cells, thereby maintaining stem cell activity. Importantly, these dedifferentiated cells can re-differentiate into functional progeny cells, ensuring sustained lineage functionality. A low dose of the Polα inhibitor, targeting the lagging strand PolA1, enhances cellular reprogramming, further underscoring its potential in promoting regenerative processes. Therefore, our findings hold promise for application in other adult stem cells and in inducing pluripotent cells from patient-derived cells.
Reducing Primase levels or Polα activity, either through heterozygosity or low concentrations of an inhibitor, could shift the epigenetic symmetry typically present in progenitor cells (51), potentially initiating epigenetic asymmetry as a ‘priming’ step to potentiate cell fate changes. However, these calibrated conditions may not be fully deterministic for altering cell fates. Certain molecular features, such as the transcriptome, may remain unchanged or show only minor alterations, allowing progenitor cells to undergo normal differentiation under non-challenging conditions, such as homeostasis in young adults. Conversely, under conditions that require natural or induced cell reprogramming, such as aging or tissue damage, these potentiated cells might adopt a partially reprogrammed state, enabling them to outperform control cells in both dedifferentiation and re-differentiation processes in vivo.
Recent studies have shown that manipulating epigenetic asymmetry can lead to defects in mouse embryonic stem cell differentiation (103, 104) and mouse development (105). These experiments use mutations in replication components with histone chaperoning activities, such as the mcm2–2A or pole3 mutants, which normally function as DNA helicase and leading-strand DNA polymerase, respectively. Our experimental design differs in several key aspects from these conditions. First, mcm2–2A or pole3 mutants induce a high degree of histone incorporation asymmetry across the genome (106–108), which can be detrimental to normal cell functions, including stem cell differentiation. In contrast, we used primase or polα heterozygotes to reduce the levels of the full-length protein or applied low concentrations of the PolA1 inhibitor to slightly reduce its activity. These conditions may be sufficient to shift the balance from epigenomic symmetry to asymmetry without causing global changes. Alternatively, they may change the speed of replication forks. Notably, it has been demonstrated that DNA replication speed can influence cell fate decisions in early mouse embryogenesis, with a slower replication process promoting cellular reprogramming toward totipotency (109). Second, the molecular mechanisms underlying embryonic stem cell differentiation in vitro could differ from those involved in dedifferentiation in vivo or iPSC reprogramming in vitro. Nevertheless, our findings underscore the need for further studies to better understand the regulation of these processes, which are essential for normal development and hold promise for regenerative medicine.
In summary, our results suggest an intriguing new approach to stimulate stem cell regeneration in response to injury or aging-induced stem cell depletion, thereby promoting reproductive longevity, healthy aging, and an increased healthspan.
Supplementary Material
Acknowledgments:
We thank Drs. John Kim, Keji Zhao, Caitlin Pozmanter, Jingchao Zhang and Chen lab members for helpful suggestions. We thank Drs. Yukiko Yamashita, Erika Matunis, Allan Spradling and Jane Hubbard for fly and worm strains used in this study. We thank Johns Hopkins Integrated Imaging Center for confocal imaging. Supported by NIH 5T32GM007231 (Y.B., B.D.), NIH R35 GM127075 and R01 HD102474, and the Howard Hughes Medical Institute (X.C.).
Footnotes
Competing Interest Statement: We have a provisional patent application through the Johns Hopkins Technology Ventures.
Data availability:
GEO accession number for the snRNA-seq data is GSE277293 (released on 09/15/2027 or earlier).
References
- 1.Du W. et al. , Mechanisms of chromatin-based epigenetic inheritance. Sci China Life Sci 65, 2162–2190 (2022). [DOI] [PMC free article] [PubMed] [Google Scholar]
- 2.Escobar T. M., Loyola A., Reinberg D., Parental nucleosome segregation and the inheritance of cellular identity. Nat Rev Genet 22, 379–392 (2021). [DOI] [PMC free article] [PubMed] [Google Scholar]
- 3.Serra-Cardona A., Zhang Z., Replication-Coupled Nucleosome Assembly in the Passage of Epigenetic Information and Cell Identity. Trends Biochem Sci 43, 136–148 (2018). [DOI] [PMC free article] [PubMed] [Google Scholar]
- 4.Stewart-Morgan K. R., Petryk N., Groth A., Chromatin replication and epigenetic cell memory. Nat Cell Biol 22, 361–371 (2020). [DOI] [PubMed] [Google Scholar]
- 5.Zhang W., Feng J., Li Q., The replisome guides nucleosome assembly during DNA replication. Cell Biosci 10, 37 (2020). [DOI] [PMC free article] [PubMed] [Google Scholar]
- 6.Urban J. A., Ranjan R., Chen X., Asymmetric Histone Inheritance: Establishment, Recognition, and Execution. Annu Rev Genet, (2022). [DOI] [PMC free article] [PubMed] [Google Scholar]
- 7.Grewal S. I. S., The molecular basis of heterochromatin assembly and epigenetic inheritance. Mol Cell 83, 1767–1785 (2023). [DOI] [PMC free article] [PubMed] [Google Scholar]
- 8.Vouzas A. E., Gilbert D. M., Replication timing and transcriptional control: beyond cause and effect - part IV. Curr Opin Genet Dev 79, 102031 (2023). [DOI] [PMC free article] [PubMed] [Google Scholar]
- 9.Kirkwood T. B., Evolution of ageing. Nature 270, 301–304 (1977). [DOI] [PubMed] [Google Scholar]
- 10.Speakman J. R., The physiological costs of reproduction in small mammals. Philos Trans R Soc Lond B Biol Sci 363, 375–398 (2008). [DOI] [PMC free article] [PubMed] [Google Scholar]
- 11.De Loof A., Longevity and aging in insects: Is reproduction costly; cheap; beneficial or irrelevant? A critical evaluation of the “trade-off” concept. J Insect Physiol 57, 1–11 (2011). [DOI] [PubMed] [Google Scholar]
- 12.Tatar M., Stalking the link between reproduction and aging: After decades of research, it still remains a mystery whether and how reproduction drives the process of aging: After decades of research, it still remains a mystery whether and how reproduction drives the process of aging. EMBO Rep 24, e57374 (2023). [DOI] [PMC free article] [PubMed] [Google Scholar]
- 13.Yuan R., Hascup E., Hascup K., Bartke A., Relationships among Development, Growth, Body Size, Reproduction, Aging, and Longevity - Trade-Offs and Pace-Of-Life. Biochemistry (Mosc) 88, 1692–1703 (2023). [DOI] [PMC free article] [PubMed] [Google Scholar]
- 14.Sen P., Shah P. P., Nativio R., Berger S. L., Epigenetic Mechanisms of Longevity and Aging. Cell 166, 822–839 (2016). [DOI] [PMC free article] [PubMed] [Google Scholar]
- 15.Barroca V. et al. , Mouse differentiating spermatogonia can generate germinal stem cells in vivo. Nat Cell Biol 11, 190–196 (2009). [DOI] [PubMed] [Google Scholar]
- 16.Boyle M., Wong C., Rocha M., Jones D. L., Decline in self-renewal factors contributes to aging of the stem cell niche in the Drosophila testis. Cell Stem Cell 1, 470–478 (2007). [DOI] [PubMed] [Google Scholar]
- 17.Brawley C., Matunis E., Regeneration of male germline stem cells by spermatogonial dedifferentiation in vivo. Science 304, 1331–1334 (2004). [DOI] [PubMed] [Google Scholar]
- 18.Cheng J. et al. , Centrosome misorientation reduces stem cell division during ageing. Nature 456, 599–604 (2008). [DOI] [PMC free article] [PubMed] [Google Scholar]
- 19.Kai T., Spradling A., Differentiating germ cells can revert into functional stem cells in Drosophila melanogaster ovaries. Nature 428, 564–569 (2004). [DOI] [PubMed] [Google Scholar]
- 20.Nakagawa T., Sharma M., Nabeshima Y., Braun R. E., Yoshida S., Functional hierarchy and reversibility within the murine spermatogenic stem cell compartment. Science 328, 62–67 (2010). [DOI] [PMC free article] [PubMed] [Google Scholar]
- 21.Sheng X. R., Brawley C. M., Matunis E. L., Dedifferentiating spermatogonia outcompete somatic stem cells for niche occupancy in the Drosophila testis. Cell Stem Cell 5, 191–203 (2009). [DOI] [PMC free article] [PubMed] [Google Scholar]
- 22.Wallenfang M. R., Nayak R., DiNardo S., Dynamics of the male germline stem cell population during aging of Drosophila melanogaster. Aging Cell 5, 297–304 (2006). [DOI] [PubMed] [Google Scholar]
- 23.Lehoczky J. A., Robert B., Tabin C. J., Mouse digit tip regeneration is mediated by fate-restricted progenitor cells. Proc Natl Acad Sci U S A 108, 20609–20614 (2011). [DOI] [PMC free article] [PubMed] [Google Scholar]
- 24.Rinkevich Y., Lindau P., Ueno H., Longaker M. T., Weissman I. L., Germ-layer and lineage-restricted stem/progenitors regenerate the mouse digit tip. Nature 476, 409–413 (2011). [DOI] [PMC free article] [PubMed] [Google Scholar]
- 25.Takahashi K., Yamanaka S., Induction of pluripotent stem cells from mouse embryonic and adult fibroblast cultures by defined factors. Cell 126, 663–676 (2006). [DOI] [PubMed] [Google Scholar]
- 26.Takahashi K. et al. , Induction of pluripotent stem cells from adult human fibroblasts by defined factors. Cell 131, 861–872 (2007). [DOI] [PubMed] [Google Scholar]
- 27.Hui K. K., Yamanaka S., iPS cell therapy 2.0: Preparing for next-generation regenerative medicine. Bioessays, e2400072 (2024). [DOI] [PubMed] [Google Scholar]
- 28.Yamanaka S., Pluripotent Stem Cell-Based Cell Therapy-Promise and Challenges. Cell Stem Cell 27, 523–531 (2020). [DOI] [PubMed] [Google Scholar]
- 29.Plath K., Lowry W. E., Progress in understanding reprogramming to the induced pluripotent state. Nat Rev Genet 12, 253–265 (2011). [DOI] [PMC free article] [PubMed] [Google Scholar]
- 30.Kim K. et al. , Epigenetic memory in induced pluripotent stem cells. Nature 467, 285–290 (2010). [DOI] [PMC free article] [PubMed] [Google Scholar]
- 31.Melton C., Blelloch R., MicroRNA Regulation of Embryonic Stem Cell Self-Renewal and Differentiation. Adv Exp Med Biol 695, 105–117 (2010). [DOI] [PubMed] [Google Scholar]
- 32.Shi Y., Inoue H., Wu J. C., Yamanaka S., Induced pluripotent stem cell technology: a decade of progress. Nat Rev Drug Discov 16, 115–130 (2017). [DOI] [PMC free article] [PubMed] [Google Scholar]
- 33.Smith Z. D., Meissner A., DNA methylation: roles in mammalian development. Nat Rev Genet 14, 204–220 (2013). [DOI] [PubMed] [Google Scholar]
- 34.van den Hurk M. et al. , Transcriptional and epigenetic mechanisms of cellular reprogramming to induced pluripotency. Epigenomics 8, 1131–1149 (2016). [DOI] [PMC free article] [PubMed] [Google Scholar]
- 35.Hochedlinger K., Jaenisch R., Induced Pluripotency and Epigenetic Reprogramming. Cold Spring Harb Perspect Biol 7, (2015). [DOI] [PMC free article] [PubMed] [Google Scholar]
- 36.Hochedlinger K., Plath K., Epigenetic reprogramming and induced pluripotency. Development 136, 509–523 (2009). [DOI] [PMC free article] [PubMed] [Google Scholar]
- 37.Watanabe A., Yamada Y., Yamanaka S., Epigenetic regulation in pluripotent stem cells: a key to breaking the epigenetic barrier. Philos Trans R Soc Lond B Biol Sci 368, 20120292 (2013). [DOI] [PMC free article] [PubMed] [Google Scholar]
- 38.Hiratani I., Gilbert D. M., Replication timing as an epigenetic mark. Epigenetics 4, 93–97 (2009). [DOI] [PMC free article] [PubMed] [Google Scholar]
- 39.Ahuja A. K. et al. , A short G1 phase imposes constitutive replication stress and fork remodelling in mouse embryonic stem cells. Nat Commun 7, 10660 (2016). [DOI] [PMC free article] [PubMed] [Google Scholar]
- 40.Gonzalez F. et al. , Homologous recombination DNA repair genes play a critical role in reprogramming to a pluripotent state. Cell Rep 3, 651–660 (2013). [DOI] [PMC free article] [PubMed] [Google Scholar]
- 41.Fuller M. T., Spradling A. C., Male and female Drosophila germline stem cells: two versions of immortality. Science 316, 402–404 (2007). [DOI] [PubMed] [Google Scholar]
- 42.Pan L. et al. , Stem cell aging is controlled both intrinsically and extrinsically in the Drosophila ovary. Cell Stem Cell 1, 458–469 (2007). [DOI] [PubMed] [Google Scholar]
- 43.Sheng X. R., Matunis E., Live imaging of the Drosophila spermatogonial stem cell niche reveals novel mechanisms regulating germline stem cell output. Development 138, 3367–3376 (2011). [DOI] [PMC free article] [PubMed] [Google Scholar]
- 44.Wong C., Jones D. L., Efficiency of spermatogonial dedifferentiation during aging. PLoS One 7, e33635 (2012). [DOI] [PMC free article] [PubMed] [Google Scholar]
- 45.Yadlapalli S., Yamashita Y. M., Chromosome-specific nonrandom sister chromatid segregation during stem-cell division. Nature 498, 251–254 (2013). [DOI] [PMC free article] [PubMed] [Google Scholar]
- 46.Yamashita Y. M., Jones D. L., Fuller M. T., Orientation of asymmetric stem cell division by the APC tumor suppressor and centrosome. Science 301, 1547–1550 (2003). [DOI] [PubMed] [Google Scholar]
- 47.Yamashita Y. M., Mahowald A. P., Perlin J. R., Fuller M. T., Asymmetric inheritance of mother versus daughter centrosome in stem cell division. Science 315, 518–521 (2007). [DOI] [PMC free article] [PubMed] [Google Scholar]
- 48.Yamashita Y. M., The centrosome and asymmetric cell division. Prion 3, 84–88 (2009). [DOI] [PMC free article] [PubMed] [Google Scholar]
- 49.Venkei Z. G., Yamashita Y. M., The centrosome orientation checkpoint is germline stem cell specific and operates prior to the spindle assembly checkpoint in Drosophila testis. Development 142, 62–69 (2015). [DOI] [PubMed] [Google Scholar]
- 50.Inaba M., Yuan H., Salzmann V., Fuller M. T., Yamashita Y. M., E-cadherin is required for centrosome and spindle orientation in Drosophila male germline stem cells. PLoS One 5, e12473 (2010). [DOI] [PMC free article] [PubMed] [Google Scholar]
- 51.Snedeker J. et al. , Reduced levels of lagging strand polymerases shape stem cell chromatin. biorxiv, (2024). [Google Scholar]
- 52.Eun S. H. et al. , Polycomb Group Gene E(z) Is Required for Spermatogonial Dedifferentiation in Drosophila Adult Testis. J Mol Biol 429, 2030–2041 (2017). [DOI] [PMC free article] [PubMed] [Google Scholar]
- 53.Lim C. et al. , An Aminopeptidase in the Drosophila Testicular Niche Acts in Germline Stem Cell Maintenance and Spermatogonial Dedifferentiation. Cell Rep 13, 315–325 (2015). [DOI] [PMC free article] [PubMed] [Google Scholar]
- 54.Kiger A. A., Jones D. L., Schulz C., Rogers M. B., Fuller M. T., Stem cell self-renewal specified by JAK-STAT activation in response to a support cell cue. Science 294, 2542–2545 (2001). [DOI] [PubMed] [Google Scholar]
- 55.Leatherman J. L., Dinardo S., Germline self-renewal requires cyst stem cells and stat regulates niche adhesion in Drosophila testes. Nat Cell Biol 12, 806–811 (2010). [DOI] [PMC free article] [PubMed] [Google Scholar]
- 56.Tarayrah L., Li Y., Gan Q., Chen X., Epigenetic regulator Lid maintains germline stem cells through regulating JAK-STAT signaling pathway activity. Biol Open 4, 1518–1527 (2015). [DOI] [PMC free article] [PubMed] [Google Scholar]
- 57.Tulina N., Matunis E., Control of stem cell self-renewal in Drosophila spermatogenesis by JAK-STAT signaling. Science 294, 2546–2549 (2001). [DOI] [PubMed] [Google Scholar]
- 58.Wieschaus E., Szabad J., The development and function of the female germ line in Drosophila melanogaster: a cell lineage study. Dev Biol 68, 29–46 (1979). [DOI] [PubMed] [Google Scholar]
- 59.Spradling A. C. et al. , The Drosophila germarium: stem cells, germ line cysts, and oocytes. Cold Spring Harb Symp Quant Biol 62, 25–34 (1997). [PubMed] [Google Scholar]
- 60.Lin H., The tao of stem cells in the germline. Annu Rev Genet 31, 455–491 (1997). [DOI] [PubMed] [Google Scholar]
- 61.Eliazer S., Buszczak M., Finding a niche: studies from the Drosophila ovary. Stem Cell Res Ther 2, 45 (2011). [DOI] [PMC free article] [PubMed] [Google Scholar]
- 62.Chen D., McKearin D., Dpp signaling silences bam transcription directly to establish asymmetric divisions of germline stem cells. Curr Biol 13, 1786–1791 (2003). [DOI] [PubMed] [Google Scholar]
- 63.McKearin D. M., Spradling A. C., bag-of-marbles: a Drosophila gene required to initiate both male and female gametogenesis. Genes Dev 4, 2242–2251 (1990). [DOI] [PubMed] [Google Scholar]
- 64.McKearin D., Ohlstein B., A role for the Drosophila bag-of-marbles protein in the differentiation of cystoblasts from germline stem cells. Development 121, 2937–2947 (1995). [DOI] [PubMed] [Google Scholar]
- 65.Xie T., Spradling A. C., decapentaplegic is essential for the maintenance and division of germline stem cells in the Drosophila ovary. Cell 94, 251–260 (1998). [DOI] [PubMed] [Google Scholar]
- 66.Chen D., McKearin D. M., A discrete transcriptional silencer in the bam gene determines asymmetric division of the Drosophila germline stem cell. Development 130, 1159–1170 (2003). [DOI] [PubMed] [Google Scholar]
- 67.Song X. et al. , Bmp signals from niche cells directly repress transcription of a differentiation-promoting gene, bag of marbles, in germline stem cells in the Drosophila ovary. Development 131, 1353–1364 (2004). [DOI] [PubMed] [Google Scholar]
- 68.Casanueva M. O., Ferguson E. L., Germline stem cell number in the Drosophila ovary is regulated by redundant mechanisms that control Dpp signaling. Development 131, 1881–1890 (2004). [DOI] [PubMed] [Google Scholar]
- 69.Kawase E., Wong M. D., Ding B. C., Xie T., Gbb/Bmp signaling is essential for maintaining germline stem cells and for repressing bam transcription in the Drosophila testis. Development 131, 1365–1375 (2004). [DOI] [PubMed] [Google Scholar]
- 70.Kirilly D., Wang S., Xie T., Self-maintained escort cells form a germline stem cell differentiation niche. Development 138, 5087–5097 (2011). [DOI] [PMC free article] [PubMed] [Google Scholar]
- 71.Xie T., Spradling A. C., A niche maintaining germ line stem cells in the Drosophila ovary. Science 290, 328–330 (2000). [DOI] [PubMed] [Google Scholar]
- 72.Zhao R., Xuan Y., Li X., Xi R., Age-related changes of germline stem cell activity, niche signaling activity and egg production in Drosophila. Aging Cell 7, 344–354 (2008). [DOI] [PubMed] [Google Scholar]
- 73.Piper M. D., Partridge L., Protocols to Study Aging in Drosophila. Methods Mol Biol 1478, 291–302 (2016). [DOI] [PMC free article] [PubMed] [Google Scholar]
- 74.Yoon D. S., Cha D. S., Alfhili M. A., Keiper B. D., Lee M. H., Subunits of the DNA polymerase alpha-primase complex promote Notch-mediated proliferation with discrete and shared functions in C. elegans germline. FEBS J 285, 2590–2604 (2018). [DOI] [PMC free article] [PubMed] [Google Scholar]
- 75.Au V. et al. , CRISPR/Cas9 Methodology for the Generation of Knockout Deletions in Caenorhabditis elegans. G3 (Bethesda) 9, 135–144 (2019). [DOI] [PMC free article] [PubMed] [Google Scholar]
- 76.Roy D., Kahler D. J., Yun C., Hubbard E. J. A., Functional Interactions Between rsks-1/S6K, glp-1/Notch, and Regulators of Caenorhabditis elegans Fertility and Germline Stem Cell Maintenance. G3 (Bethesda) 8, 3293–3309 (2018). [DOI] [PMC free article] [PubMed] [Google Scholar]
- 77.Kenyon C., Chang J., Gensch E., Rudner A., Tabtiang R., A C. elegans mutant that lives twice as long as wild type. Nature 366, 461–464 (1993). [DOI] [PubMed] [Google Scholar]
- 78.Hetie P., de Cuevas M., Matunis E., Conversion of quiescent niche cells to somatic stem cells causes ectopic niche formation in the Drosophila testis. Cell Rep 7, 715–721 (2014). [DOI] [PMC free article] [PubMed] [Google Scholar]
- 79.Lim J. G., Fuller M. T., Somatic cell lineage is required for differentiation and not maintenance of germline stem cells in Drosophila testes. Proc Natl Acad Sci U S A 109, 18477–18481 (2012). [DOI] [PMC free article] [PubMed] [Google Scholar]
- 80.Jaffri S. A., Yan Y., Schwirz J., Schetelig M. F., Functional characterization of the Drosophila suzukii pro-apoptotic genes reaper, head involution defective and grim. Apoptosis 25, 864–874 (2020). [DOI] [PubMed] [Google Scholar]
- 81.Claveria C. et al. , Drosophila grim induces apoptosis in mammalian cells. EMBO J 17, 7199–7208 (1998). [DOI] [PMC free article] [PubMed] [Google Scholar]
- 82.Chen P., Nordstrom W., Gish B., Abrams J. M., grim, a novel cell death gene in Drosophila. Genes Dev 10, 1773–1782 (1996). [DOI] [PubMed] [Google Scholar]
- 83.Shim J., Gururaja-Rao S., Banerjee U., Nutritional regulation of stem and progenitor cells in Drosophila. Development 140, 4647–4656 (2013). [DOI] [PMC free article] [PubMed] [Google Scholar]
- 84.Gervais L., Bardin A. J., Tissue homeostasis and aging: new insight from the fly intestine. Curr Opin Cell Biol 48, 97–105 (2017). [DOI] [PubMed] [Google Scholar]
- 85.Rodriguez-Fernandez I. A., Tauc H. M., Jasper H., Hallmarks of aging Drosophila intestinal stem cells. Mech Ageing Dev 190, 111285 (2020). [DOI] [PubMed] [Google Scholar]
- 86.Jasper H., Intestinal Stem Cell Aging: Origins and Interventions. Annu Rev Physiol 82, 203–226 (2020). [DOI] [PubMed] [Google Scholar]
- 87.Buchon N., Broderick N. A., Lemaitre B., Gut homeostasis in a microbial world: insights from Drosophila melanogaster. Nat Rev Microbiol 11, 615–626 (2013). [DOI] [PubMed] [Google Scholar]
- 88.Clark M. M., Broderick N. A., Whole-genome sequencing of Chromobacterium subtsugae strains exhibiting toxicity to Drosophila melanogaster. Microbiol Resour Announc 13, e0012724 (2024). [DOI] [PMC free article] [PubMed] [Google Scholar]
- 89.Lozano G. L. et al. , A Chemical Counterpunch: Chromobacterium violaceum ATCC 31532 Produces Violacein in Response to Translation-Inhibiting Antibiotics. mBio 11, (2020). [DOI] [PMC free article] [PubMed] [Google Scholar]
- 90.Martins R. R., McCracken A. W., Simons M. J. P., Henriques C. M., Rera M., How to Catch a Smurf? - Ageing and Beyond… In vivo Assessment of Intestinal Permeability in Multiple Model Organisms. Bio Protoc 8, (2018). [DOI] [PMC free article] [PubMed] [Google Scholar]
- 91.Micchelli C. A., Perrimon N., Evidence that stem cells reside in the adult Drosophila midgut epithelium. Nature 439, 475–479 (2006). [DOI] [PubMed] [Google Scholar]
- 92.Ohlstein B., Spradling A., The adult Drosophila posterior midgut is maintained by pluripotent stem cells. Nature 439, 470–474 (2006). [DOI] [PubMed] [Google Scholar]
- 93.Jiang H. et al. , Cytokine/Jak/Stat signaling mediates regeneration and homeostasis in the Drosophila midgut. Cell 137, 1343–1355 (2009). [DOI] [PMC free article] [PubMed] [Google Scholar]
- 94.Beebe K., Lee W. C., Micchelli C. A., JAK/STAT signaling coordinates stem cell proliferation and multilineage differentiation in the Drosophila intestinal stem cell lineage. Dev Biol 338, 28–37 (2010). [DOI] [PubMed] [Google Scholar]
- 95.Zeng X., Chauhan C., Hou S. X., Characterization of midgut stem cell- and enteroblast-specific Gal4 lines in drosophila. Genesis 48, 607–611 (2010). [DOI] [PMC free article] [PubMed] [Google Scholar]
- 96.Bhutani K. et al. , Whole-genome mutational burden analysis of three pluripotency induction methods. Nat Commun 7, 10536 (2016). [DOI] [PMC free article] [PubMed] [Google Scholar]
- 97.Cincinelli R. et al. , Novel adamantyl retinoid-related molecules with POLA1 inhibitory activity. Bioorg Chem 104, 104253 (2020). [DOI] [PubMed] [Google Scholar]
- 98.Bharathan S. P. et al. , Systematic evaluation of markers used for the identification of human induced pluripotent stem cells. Biol Open 6, 100–108 (2017). [DOI] [PMC free article] [PubMed] [Google Scholar]
- 99.Thomson J. A. et al. , Embryonic stem cell lines derived from human blastocysts. Science 282, 1145–1147 (1998). [DOI] [PubMed] [Google Scholar]
- 100.Lee J. H. et al. , Lineage-Specific Differentiation Is Influenced by State of Human Pluripotency. Cell Rep 19, 20–35 (2017). [DOI] [PubMed] [Google Scholar]
- 101.Daniszewski M. et al. , Single-Cell Profiling Identifies Key Pathways Expressed by iPSCs Cultured in Different Commercial Media. iScience 7, 30–39 (2018). [DOI] [PMC free article] [PubMed] [Google Scholar]
- 102.Kamatani T. et al. , Human iPS cell-derived cartilaginous tissue spatially and functionally replaces nucleus pulposus. Biomaterials 284, 121491 (2022). [DOI] [PubMed] [Google Scholar]
- 103.Xu X., Hua X., Brown K., Ren X., Zhang Z., Mcm2 promotes stem cell differentiation via its ability to bind H3-H4. Elife 11, (2022). [DOI] [PMC free article] [PubMed] [Google Scholar]
- 104.Wenger A. et al. , Symmetric inheritance of parental histones governs epigenome maintenance and embryonic stem cell identity. Nat Genet 55, 1567–1578 (2023). [DOI] [PMC free article] [PubMed] [Google Scholar]
- 105.Wen Q. et al. , Symmetric inheritance of parental histones contributes to safeguarding the fate of mouse embryonic stem cells during differentiation. Nat Genet 55, 1555–1566 (2023). [DOI] [PMC free article] [PubMed] [Google Scholar]
- 106.Gan H. et al. , The Mcm2-Ctf4-Polalpha Axis Facilitates Parental Histone H3-H4 Transfer to Lagging Strands. Mol Cell 72, 140–151 e143 (2018). [DOI] [PMC free article] [PubMed] [Google Scholar]
- 107.Petryk N. et al. , MCM2 promotes symmetric inheritance of modified histones during DNA replication. Science 361, 1389–1392 (2018). [DOI] [PubMed] [Google Scholar]
- 108.Yu C. et al. , A mechanism for preventing asymmetric histone segregation onto replicating DNA strands. Science 361, 1386–1389 (2018). [DOI] [PMC free article] [PubMed] [Google Scholar]
- 109.Nakatani T. et al. , DNA replication fork speed underlies cell fate changes and promotes reprogramming. Nat Genet 54, 318–327 (2022). [DOI] [PMC free article] [PubMed] [Google Scholar]
- 110.Hubbard E. J., Greenstein D., The Caenorhabditis elegans gonad: a test tube for cell and developmental biology. Dev Dyn 218, 2–22 (2000). [DOI] [PubMed] [Google Scholar]
- 111.Pazdernik N., Schedl T., Introduction to germ cell development in Caenorhabditis elegans. Adv Exp Med Biol 757, 1–16 (2013). [DOI] [PMC free article] [PubMed] [Google Scholar]
- 112.Van Doren M., Williamson A. L., Lehmann R., Regulation of zygotic gene expression in Drosophila primordial germ cells. Curr Biol 8, 243–246 (1998). [DOI] [PubMed] [Google Scholar]
- 113.Inaba M., Buszczak M., Yamashita Y. M., Nanotubes mediate niche-stem-cell signalling in the Drosophila testis. Nature 523, 329–332 (2015). [DOI] [PMC free article] [PubMed] [Google Scholar]
- 114.Brenner S., The genetics of Caenorhabditis elegans. Genetics 77, 71–94 (1974). [DOI] [PMC free article] [PubMed] [Google Scholar]
- 115.Tran V., Lim C., Xie J., Chen X., Asymmetric division of Drosophila male germline stem cell shows asymmetric histone distribution. Science 338, 679–682 (2012). [DOI] [PMC free article] [PubMed] [Google Scholar]
- 116.Kahney E. W. et al. , Characterization of histone inheritance patterns in the Drosophila female germline. EMBO Rep, e51530 (2021). [DOI] [PMC free article] [PubMed] [Google Scholar]
- 117.Zion E. H. et al. , Old and newly synthesized histones are asymmetrically distributed in Drosophila intestinal stem cell divisions. EMBO Rep 24, e56404 (2023). [DOI] [PMC free article] [PubMed] [Google Scholar]
- 118.Hao Y. et al. , Dictionary learning for integrative, multimodal and scalable single-cell analysis. Nat Biotechnol 42, 293–304 (2024). [DOI] [PMC free article] [PubMed] [Google Scholar]
- 119.Germain P. L., Lun A., Garcia Meixide C., Macnair W., Robinson M. D., Doublet identification in single-cell sequencing data using scDblFinder. F1000Res 10, 979 (2021). [DOI] [PMC free article] [PubMed] [Google Scholar]
- 120.Suter D. M., Tirefort D., Julien S., Krause K. H., A Sox1 to Pax6 switch drives neuroectoderm to radial glia progression during differentiation of mouse embryonic stem cells. Stem Cells 27, 49–58 (2009). [DOI] [PubMed] [Google Scholar]
Associated Data
This section collects any data citations, data availability statements, or supplementary materials included in this article.
Supplementary Materials
Data Availability Statement
GEO accession number for the snRNA-seq data is GSE277293 (released on 09/15/2027 or earlier).