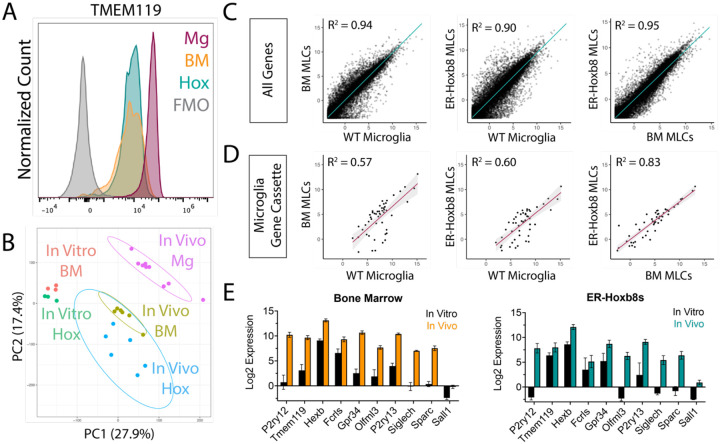
Figure 3: ER-Hoxb8 macrophages become microglia-like cells (MLCs) after engraftment in the Csf1r−/− brain.
(A) Histogram of TMEM119 surface staining by flow cytometry (pre-gated on live, singlet, leukocyte, CD45+/CD11B+) for brain-engrafted cells 14 days post-intracerebral transplantation; Mg = WT Microglia, BM = BMD MLCs, Hox = ER-Hoxb8 MLCs (B) PCA plot comparing in vitro macrophages from Figure 1 with in vivo macrophages; Mg = WT Microglia, BM = BMD MLCs, Hox = ER-Hoxb8 MLCs (C) Whole transcriptome comparison between WT microglia, BMD, and ER-Hoxb8 macrophages in vivo, depicting best fit line and the coefficient of determination (D) Comparison of microglia signature genes (Cronk, et al. JEM (2018)) depicting best fit line and coefficient of determination (E) In vitro and in vivo Log2 CPM gene expression of ten canonical microglia/myeloid genes for bone marrow (left) and ER-Hoxb8s (right)

