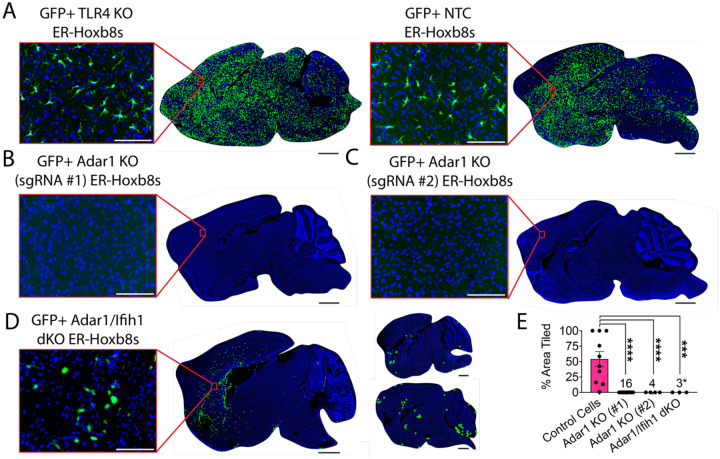
Figure 5: Adar1 mutation prevents ER-Hoxb8 engraftment in the Csf1r−/− mouse, partially rescued by Ifih1 deletion.
(A) Representative rendering of donor cell engraftment (scale bar = 1000um) with inset microscopy of GFP+ donor cell engraftment (green = endogenous GFP, blue = DAPI; scale bar = 100um) for control cells (TLR4 KO and NTC) harvested 7–15 days post-injection (dpi), (B) Adar1 KO (sgRNA #1) cells (harvest details in (E)), (C) Adar1 KO (sgRNA #2) cells harvested 9–12dpi, and (D) Adar1/Ifih1 double KO (dKO) cells harvested 10–15dpi (rendered dots in two right brains enlarged 5x for visualization) (E) Percent of total brain area tiled with cells between groups (numbers denote “n” per group); Adar1 KO (#1) cells include pooled data (brains injected with 300k cells/hemisphere, harvested at 10–15 days post-injection (dpi; n = 3); brains injected with 300k cells/hemisphere, harvested at 4–8dpi (n=8); brains injected with 50k cells/hemisphere, harvested at 13dpi (n = 4); and brains injected with 100k cells/hemisphere pre-treated with 0.5uM Baricitinib, mice treated daily with 1mg/kg Baricitinib, harvested at 5dpi (n = 1)); asterisk indicates samples where engraftment is present but does not meet criteria for tiled brain area, as exemplified in (D); p-values calculated via one-way ANOVA with multiple comparisons

