Abstract
The primary pre-neoplastic lesion of the lower esophagus in the vicinity of the gastroesophageal junction (GEJ) is any Barrett’s esophageal lesions (BE), and esophageal neoplasia has increased in the US population with predispositions (Caucasian males, truncal obesity, age, and GERD). The responses to BE are endoscopic and screening cytologic programs with endoscopic ablation of various forms. The former have not been proven to be cost-effective and there are mixed results for eradication. A fresh approach is sorely needed. We prospectively followed 2229 mostly male veterans at high risk for colorectal cancer in a 27-year longitudinal long-term study, collecting data on colorectal neoplasia development and other preneoplastic lesions, including BE and spontaneous regression (SR). Another cross-sectional BE study at a similar time period investigated antigenic changes at the GEJ in both BE glandular and squamous mucosa immunohistochemistry and the role of inflammation. Ten of the prospective cohort (21.7%) experienced SR out of a total of forty-six BE patients. Significant differences between SR and stable BE were younger age (p < 0.007); lower platelet levels (p < 0.02); rectal p87 elevation in SR (p < 0.049); a reduced innate immune system (InImS) FEREFF ratio (ferritin: p87 colonic washings) (p < 0.04). Ancillary testing showed a broad range of neoplasia biomarkers. InImS markers may be susceptible to intervention using commonplace and safe medical interventions and encourage SR.
Keywords: Barrett’s metaplasia, p87, spontaneous regression, innate immune system
1. Introduction
The incidence of adenocarcinoma of the lower esophagus has increased 57-fold from 1972 to 2010, outpacing that of squamous cell carcinoma and out of proportion with the relative growth of the US population in that time period [1]. BE is the only histologic precursor for adenocarcinoma of the lower esophagus and a clear genetic predisposition is currently unclear, but in Europe, up to 7% of cases show familial clustering [2]. In view of the alarming statistics, well-intentioned screening programs have been put in place, but efficacy has been questioned [3]. In analyzing an important paper incorporating US and UK screening strategies [4], the data did not fulfill screening guidelines in 39% (UK) and 55% (US), and in those that did, 61% (UK) and 87% (US) did not have symptoms of GERD (gastroesophageal reflux disease), and overall, questions regarding the evidence of the effectiveness of endoscopic screening modalities have been raised [5]. While other minimally invasive screening approaches show promise [4], we suggest that other non-invasive fundamental strategies may prove effective, such as the possibility of inducing regression of BE despite early skepticism [6].
Spontaneous (non-invasive) regression of BE has been described, and we will explain it below.
2. Patients, Materials, and Methods
2.1. Patients
We initially looked at a small group of patients to characterize the staining distribution of various antibodies and the intensity of labeling using the ABC method (Vector Labs., Newark, CA, USA). Thereafter, using a database of prospectively followed patients at increased risk of colorectal cancer, we endoscopically identified BE and control patients. These patients collected stool samples on which we performed ELISA for p87, used as a denominator for opportunistically obtained blood ferritin levels, yielding the FERAD ratio. We have shown that this biomarker provides an accurate gauge of the innate immune system in viral inflammation [7] and gastric cancer [8]. Embedded were also additional patients who had washings and biopsy obtained at endoscopy and had signed an additional informed consent form. In addition to the former, we used patient FERAD and p38ɣ antibodies (Cell Signaling Technology, Beverly, MA, USA) and the NCM460 stem cell line to assess inflammation and delineate factors leading to disease progression and spontaneous regression of BE. The inclusion criteria were the ability to provide written consent and provide a stool specimen. The exclusion criteria were the presence of previous invasive treatment of BE, or surgery/radiation in the vicinity of the lower esophagus, or the inability to provide consent or a stool sample.
2.1.1. ELISA, Histochemistry, and Western Blotting
Briefly, we performed p87 ELISA on the biopsy on membrane-enriched fractions after Dounce homogenization, followed by sonification on ice and high-speed centrifugations for 5 min and then 10 min for the supernatant. A Bradford or Lowry method protein assay was performed on the resultant supernatant and 5 ug of protein was placed in each well of a 96-well microtiter plate (Nunc, Copenhagen, Denmark), and incubated overnight at 4 degrees centigrade. Plates were blocked for one hour with 5% bovine serum albumin (Sigma, St. Louis, MO, USA), washed 3 times with phosphate buffered saline with Tween-20, and incubated with the primary Adnab-9 monoclonal antibody (Dako Inc., Carpinteria, CA, USA), at a concentration of 1:500 on half the plate and UPC10 1:500, an irrelevant antibody (Sigma, St. Louis, MO, USA) with the same isotype as the primary antibody, for one hour at 37 degrees, as a negative control. Positive control was adenoma extract, as derived above. Secondary anti-mouse antibody linked to alkaline phosphatase was incubated and washed as above along with PNPP (p-nitrophenol phosphate) substrate (Sigma, St. Louis, MO, USA) to generate color at 20 mins, and Optical Density was measured at 405 nm (Titertek Multiscan, Flowlabs, McClean, VA, USA). The control readings are subtracted from the test sample, yielding the final result (OD-background).
The immunohistochemistry kit (Vector Labs), was also used according to the manufacturer’s directions with Adnab-9 as the primary monoclonal. No microwave exposure was used to enhance antigen visualization. The kit was used to stain EGD-biopsy tissue from approximately 70 patients enrolled and confirmed to have BE or GERD by our staff pathologists, and patients with BE at the GEJ were labeled with a medley of monoclonal antibodies (see Table 1). The stains were graded from 0 to 5+, as reported previously [8].
Table 1.
List of monoclonal antibodies used for immunohistochemistry of chronic GERD.
| Monoclonal Antibody | Biomarker | Source |
|---|---|---|
| Anti-p53 | Early de novo; late ACS * | Dako Inc. |
| Vascular Endothelial Growth Factor | Angiogenesis | PharMingen (San Diego, CA, USA) |
| Adnab-9 | ACS | Dako Inc. |
| COX-2 | ACS | Cayman (Ann Arbor, MI, USA) |
| Anti-Tn | IBD’ de novo | Dako Inc. |
| Cdx-2 | IM marker ^ | Biocare (Pacheco, CA, USA) |
| mAbDas-1 | Barrett’s Esophagus | KM Das |
*—ACS = adenoma carcinoma sequence; IBD’ = inflammatory bowel disease; ^—IM = Intestinal Metaplasia Marker. Cat# 555036 (BD Pharmingen(tm) Purified Mouse Anti-Human VEGF) is manufactured in Tatabanya, Hungary (BD Plant 2323).
Western blotting on 9.6% SDS-polyacrylamide gels (Sigma) was loaded at 10 ug/lane on SDS-gels and electrophoresed according to the manufacturer’s directions and transferred to PVDF (polyvinylidene difluoride) membranes (Kirkegaard & Perry, Gaithersburg, MD, USA) antigen-visualized using the above sequence of antibodies using the ABC kit (Vector Laboratories) and relative mobility used to compute molecular weight. The NCM460 cell line was gifted by INCELL Corporation and is a group that is specialized in proprietary medium. The cells were grown at the period of exponential growth (70–80% confluence) and were serum-starved for 48 h. The medium was then aspirated and replaced with acidic medium (pH 4) for 5, 10, 15, 30, and 60 min. Following treatments, the cells were harvested and twice washed with PBS. The cells were then extracted with RIPA buffer containing phosphatase and protease inhibitors. A total of 25 µg of each sample was loaded onto a 10% SDS gel, electrophoresed, and then transferred onto nitrocellulose membranes and blotted with different antibodies (ppERK, pp38ɣ, and pp38 αβ).
Since there is an association between BE and H. pylori [9] and diabetes mellitus [10], we also looked for an increase or decrease, respectively, to support these notions, particularly when prospective H. pylori infection might mitigate the severity of BE, leading to regression, while diabetes may have the opposite effect.
2.1.2. Immunohistochemistry
One group of 34+ patients had cold forceps biopsies of the GEJ whilst undergoing esophagogastro-duodenoscopy (EGD) for various clinical indications as per the request of the primary care provider. All of these studies were performed under the supervision of an attending gastroenterologist and a standard report describing the clinical findings was entered into the patient database reference folder which was later accessed. We graded discernible staining, and thereafter, a pathologist determined the presence of BE on H&E section review using standardized criteria compared to native antigen anti-CDX2 antibody background immunostaining. For reproducibility, multiple sets of slides were labeled and the mean was presented as a percentage.
The monoclonal antibodies that were used are reflective of the repertoire used at the time of inception and those in current use to assess antigenic association with neoplasia and inflammation; the classical hallmarks and outcomes are tabulated above.
2.1.3. Permissions and Approvals
The study was approved by the IRB (institutional review board) and Human Investigation Committee of Wayne State University. The approval numbers are #070700MP4F and #H 09-62-94, and the approval dates are 13 September 2006 and 17 August 2000, respectively. All patients gave informed consent.
2.1.4. Statistical Analysis
The statistical analysis was performed used an online statistics package (Vassar Stats http://vassarstats.net/ and last access was 22 May 2024). The normality of values was tested using the online Kolmogorov–Smirnov calculator (https://www.socscistatistics.com/tests/kolmogorov/, accessed on 5 December 2023).
3. Results
3.1. Tabulated Results
3.1.1. Schematic Summaries and Actual Photomicrographs of Monoclonal Antibody Staining
We used the following Table 2 and Table 3 markers to get an idea of how antigens are expressed in BE and squamous epithelium in both BE and non-BE; the latter would approximate the staining that would be expected to occur in regressed epithelium.
Table 2.
The significant clinical differences between the regressed and stable BE are contrasted.
| Parameter (Number) Regressed Barrett’s Mucosa (10) |
Stable Barrett’s Mucosa (36) | Probability |
|---|---|---|
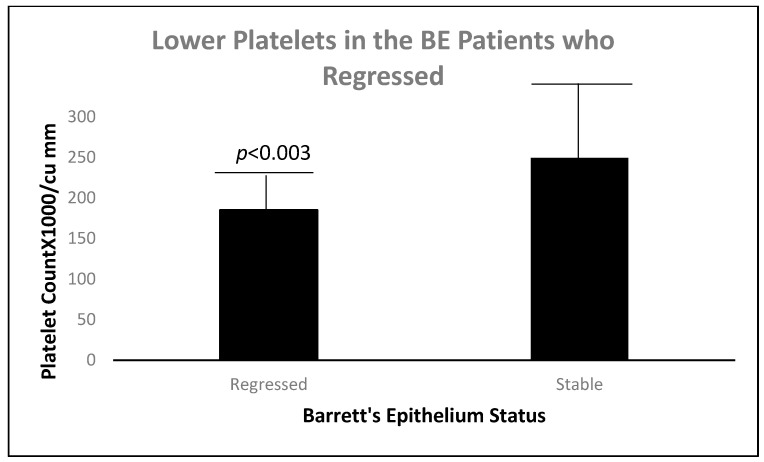
| PlateletsX1000/cc ± sd 185.2 ± 27.4 |
249.4 ± 70.5 | <0.003 |
| Length BE initial (cm) 0.67 ± 0.43 |
1.45 ± 1.50 | <0.016 |
| Initial Inflammation x 0.071 ± 0.267 |
0.534 ± 0.534 | <0.012 |
cc—cubic mm; x—mean; cm—centimeters; sd—standard deviation.
Table 3.
Demographic data of patients.
| Patient Parameters (n) |
Regressed Barrett’s Mucosa (10) | Stable Barrett’s Mucosa (36) |
Probability |
|---|---|---|---|
| Age (years ± sd) | 52.9 ± 5.5 | 62.7 ± 0.22 | <0.005 |
| Sex (%Male:Female) | 10:0 (100%) | 33:3 (91.7%) | 1 |
| Ethnicity (%Black:White) | 2:8 (20%) | 10:24 (24.9%) | 0.7 |
| Body Mass Index | 15.0 ± 2.9 | 29.1 ± 5.5 | <0.01 |
sd: standard deviation.
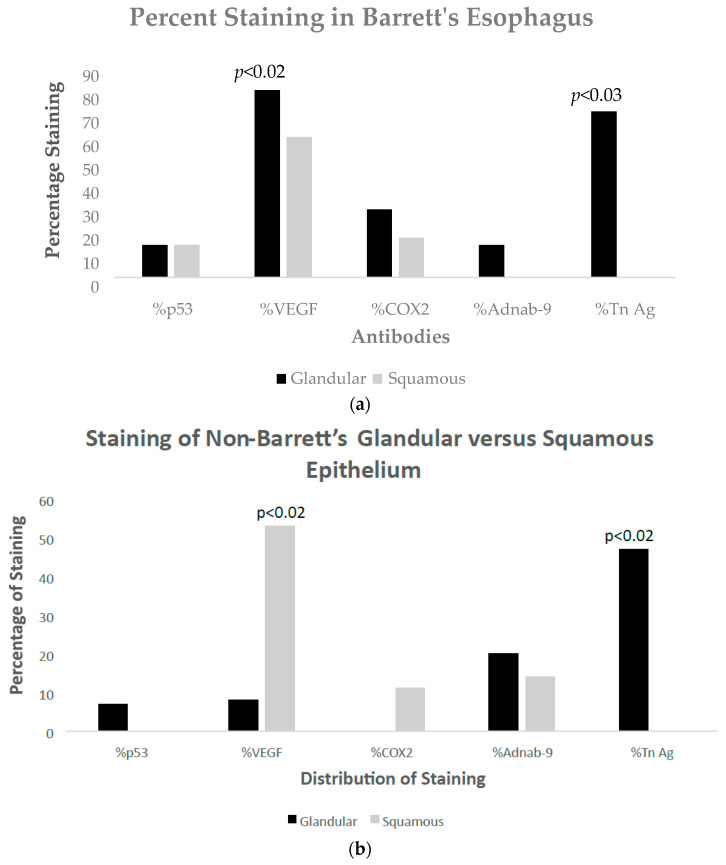
The results of the staining distribution in glandular and squamous epithelium can be seen in Barrett’s Figure 1a and in non-Barrett’s Figure 1b. VEGF is significantly maximal in non-BE squamous epithelium and is probably a GERD effect, as can be seen in Figure 2f below and the resultant comments and references cited [11]; see Section 4. Forty-three specimens from 29 patients were stained with p53.
Figure 1.
(a) Bar diagram of percentages of staining with various antibodies in glandular versus squamous epithelium in Barrett’s esophagus. (b) Bar diagram of percentages of staining with various antibodies in glandular versus squamous epithelium in non-Barrett’s esophagus.
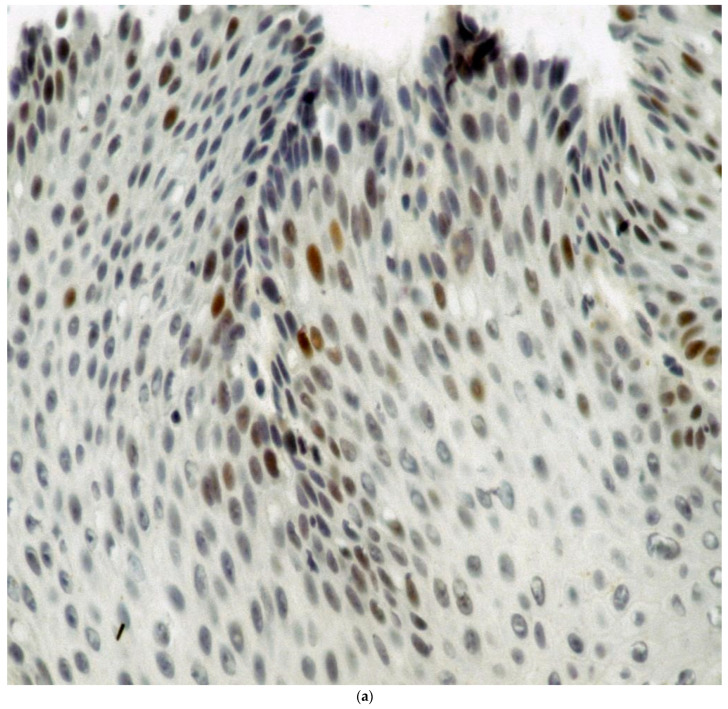
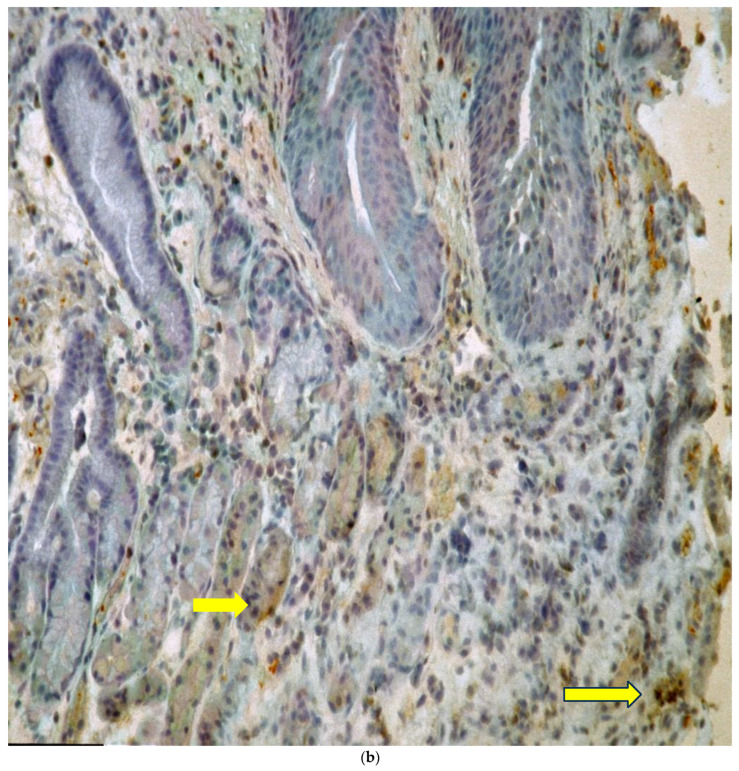
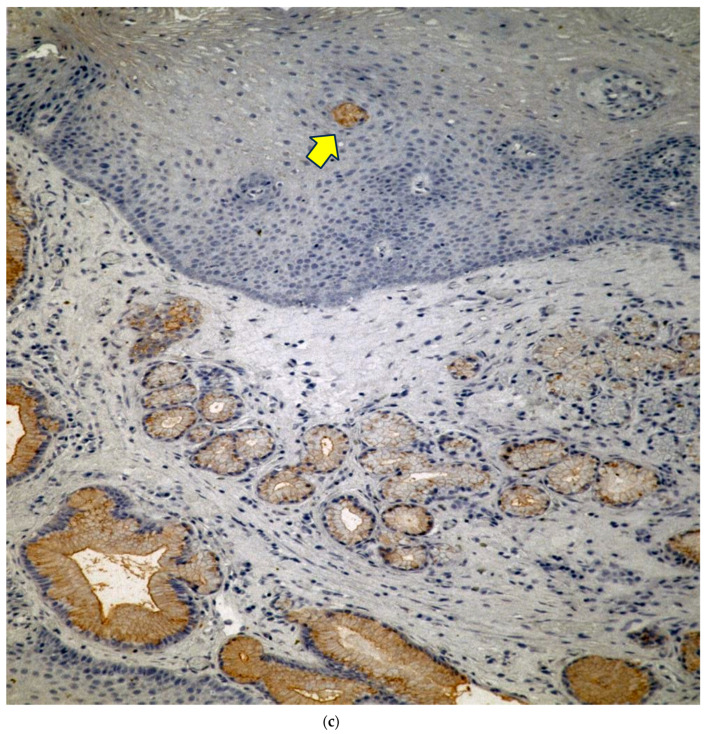
Figure 2.
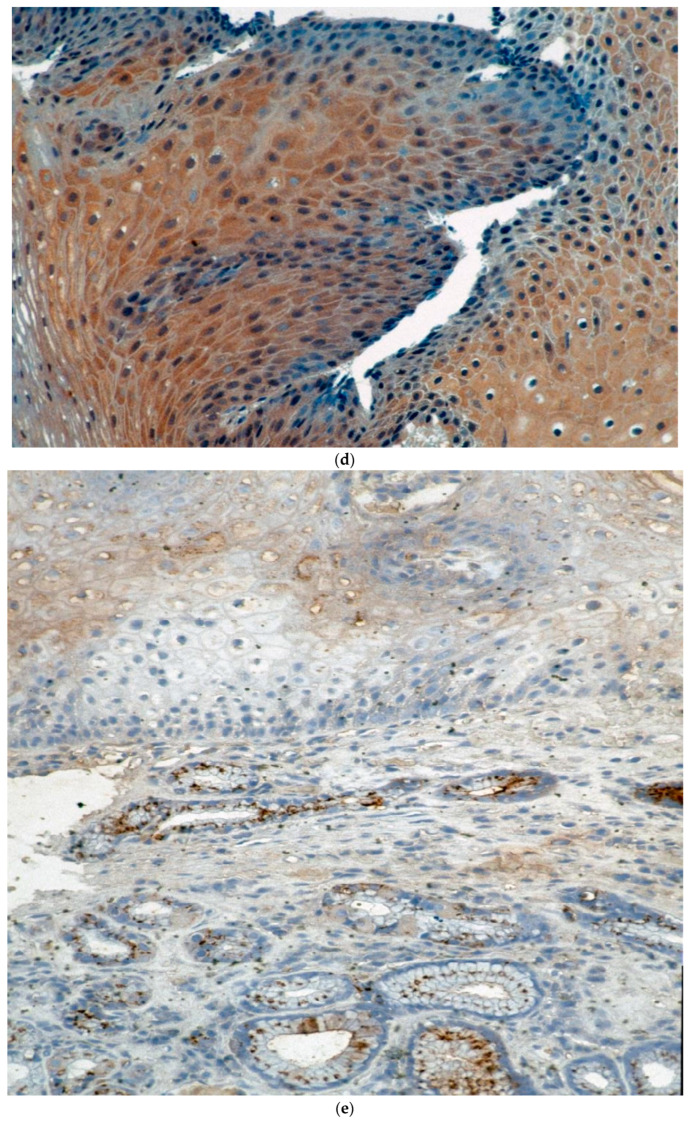
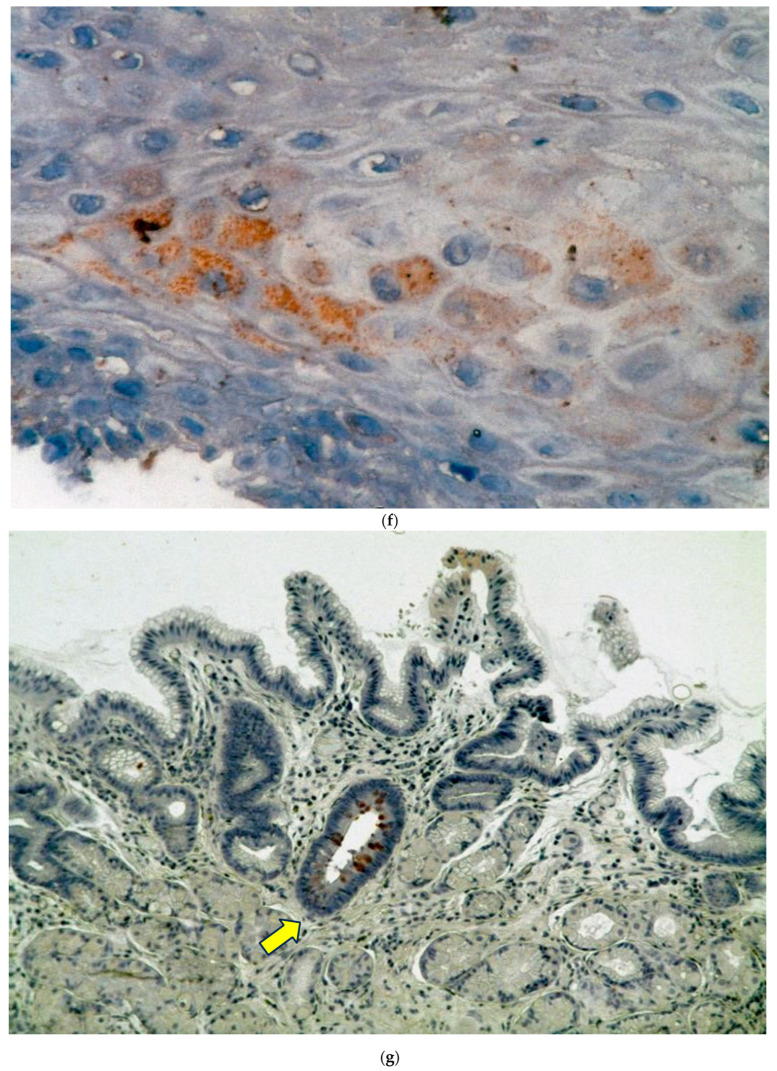
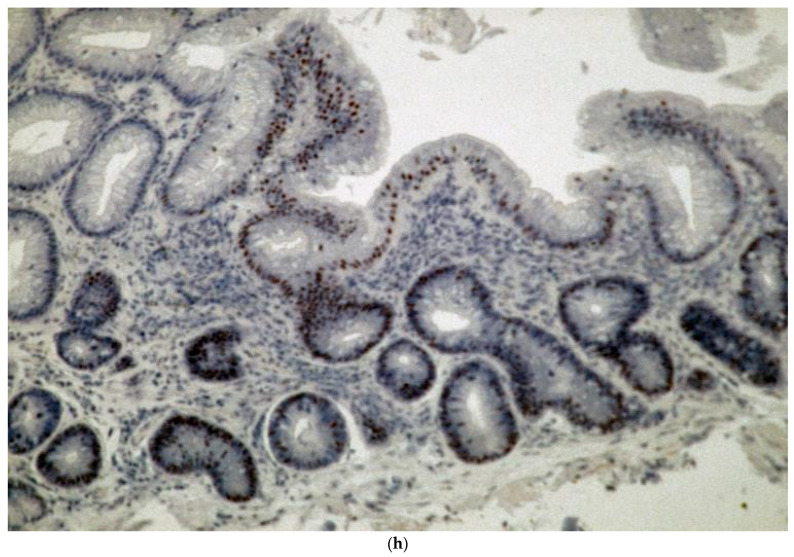
(a) Percentage staining of squamous nuclei in a Barrett’s esophagus patient with p53 nuclear staining as evidenced by the brown nuclei. Magnification 360×. (b) VEGF staining in a glandular section of a specimen taken from a patient with Barrett’s esophagus. (b) shows moderate brown VEGF staining in the glandular epithelium more localized in the cytoplasm (arrows indicate glands and staining). Magnification 50×. (c) Cox2 staining is seen from a section taken through the GEJ in a section taken from a patient with Barrett’s esophagus. Magnification 50×. (d) COX-2 staining in the squamous epithelium is moderate diffuse and cytoplasmic. Magnification 130×. The intensity of stain was 3+ in the areas on the left and 1–2+ on the right. (e) Adnab-9 staining of a section taken from the GEJ of a patient with confirmed Barrett’s esophagus. Esophagus. Magnification 50×. (f) shows Adnab-9 labeling of squamous cells in a patient with Barrett’s esophagus focally with reticulated cytoplasmic staining at a higher power. Magnification 360×. (g) Tn staining of glandular mucosa in a patient with Barrett’s esophagus. Magnification 50×. (h) Intense nuclear CDX2 staining is seen in this section of Barrett’s epithelium and involves most of the glandular epithelium in this section. Magnification 125×.
Figure 2a–h shows the staining with the monoclonals.
Approximately one-third of nuclei are heavily stained, suggesting that abnormal p53 is present from a section of Barrett’s squamous epithelium, suggesting a pre-malignant phenotype. The intensity of the stain in the heaviest stained nuclei was 4+.
Forty-nine specimens from 30 patients were stained with VEGF. The intensity of the stain was 2–3+ in the areas indicated by the arrows.
In Figure 2c, most of the Cox2 staining is confined to the epithelium of dilated glands seen to the right-hand side of the photomicrograph. The yellow arrow shows a focus of staining in the stratified squamous epithelium of the lower esophagus in center field and is likely to be non-specific staining of a rete peg, which is usually associated with false positive stains. The intensity of the stain was 2–3+ in the area indicated by the arrow, which compared favorably with the intensity of the glands in the lower foreground.
Labeling shows intense cytoplasmic staining of the Golgi apparatus in the glandular mucosa in the lower foreground of the photomicrograph and affects most of the glands. This likely represents a reaction of the innate immune system, as this antigen is usually released by Paneth cells, which are part of this system. The faint staining in the upper section of the photomicrograph at the intercalation of squamous epithelium is actually glandular epithelium. The heaviest intensity in the glandular section below is 4+.
The squamous epithelium shows intense brownish red but focal cytoplasmic labeling, suggesting an InImS similar to the glandular component in the above Figure 2e, and is 3+ in the heaviest intensity.
This section of a photomicrograph cut through a glandular section of BE with focal globular dark Tn cytoplasmic staining. The very dense In cytoplasmic staining of the central gland suggests intense focal staining with the anti-Tn antibody. The yellow arrow indicates the gland in which a number of cells express the Tn antigen. The heaviest intensity of staining in the gland highlighted by the arrow is 5+.
The nuclei in this CDX2 stained glandular epithelium show mainly nuclear staining.
Having noted the diversity in staining and the outcomes in both inflammatory and neoplastic biomarkers, we sought to expand the sample size by selecting from an extensive database of patients at increased risk of colorectal cancer where additional parameters of Barrett’s related changes had been noted. Non-invasive follow-up of ~2293 patients, with 451 patients having undergone EGD, we found approximately 65 BE patients, where 40% had inflammation and 60% were noted as non-inflamed. The original total had been 83 BE patients, but since some data were unavailable or inconclusive, we were only able to endorse 46 patients, finding that 10 had regressed and 36 remained stable over time. Twenty-one specimens from 29 patients were stained with CDX2. The heaviest intensity in the gland nuclei is 4–5+.
3.1.2. Tabulation and Correlation of the Effects of Inflammation in Barrett’s Epithelium
Table 4 indicates a significantly lower association of inflammation with both serum and urinary creatinine, but this may not correlate with renal function, as glomerular filtration rates were not available for comparison. Significant correlation with inflamed BE is evident with increased alcoholic intake but has an opposite effect with overweight patients with inflamed BE, and the cause of this association is obscure for now. Dysplasia of BE is higher in inflamed BE, as might be expected, but there is no significant difference. In patients with normal mucosa, AA with no inflammation is over-represented, which would be expected, as BE is less commonly found in AA.
Table 4.
Data regarding BE and normal epithelium with and without inflammation.
| Parameter | BE+ Infl BE− Infl |
Normal Infl. Normal No Infl. |
OR/t | p or CI | |
|---|---|---|---|---|---|
| Serum Cr− | 1.040 ± 0.185 1.409 ± 3.032 |
NSS NSS |
t-Test | <0.022 | |
| ACE exposure | 17/45 (78%) 160/95 |
(82%) | 0.51 | 0.27–0.98 | |
| Urinary Cr− | 115 ± 75 184 ± 100 |
t-Test | <0.022 | ||
| Quan EtOH | 13/20 (65%) 7/20 (35%) |
NSS | NSS | 6.86 | <0.0002 |
| Obese BMI > 28 | 7/23 (30%) 22/33 (67%) |
NSS | NSS | 0.22 | <0.014 |
| AA Ethnicity | 8/38 (21%) | NSS | 104/167(62%) | 0.16 | 0.07–0.37 |
| Dysplasia * | 8/26 (31%) 9/39 (23%) |
N/A | N/A | 0.6 | |
BE+—patients with BE; BE−—patients without BE; infl.—inflammation. OR—odds ratio; p—probability; CI—confidence interval; Cr−—creatinine; ACE—angiotensin converting enzyme inhibitors; t-test—Students t test; ETOH—ethanol intake; BMI—body mass index; AA—African American; NSS—not statistically significant; N/A—not applicable. *—none had high-grade dysplasia, but 5 patients had findings of indefinite dysplasia only in stable BE but with a significant difference at p < 0.046. BE was seen in 46 patients overall.
Additionally, trends for BE vs. normal epithelial (NE) groups were seen with p87 Western blots (7 vs. 14.7% res-p = 0.16): quantitative alcohol intake, 53% vs. 39%—p = 0.07; predominance of males, 95 vs. 89%—p = 0.15; PPi exposure, 41 vs. 30%-0 = 0.18. Trends for BE with and without inflammation were seen for FERAD ratio (ferritin/stool p87), 21,477 ± 37,197 vs. 20,928 ± 66,593-p = 0.14. Comparing BE with inflammation and NE, trends were seen for African Americans (AA), 10/25 (40%) vs. 8/38 (21%)—p = 0.096; quantitative alcohol (Quan EtOH), 5/16 (31%) vs. 103/189 (55%)—p = 0.12. Trends of BMI levels for BE with no inflammation and NE with no inflammation were 22/33 (67%) vs. 81/151 (54%)—p = 0.18, and likewise, there were other trends for PPi (proton pump inhibitor) exposure, 10/23 (44%) vs. 29/102 (28%)—p = 0.2; ACE exposure, 9/26 (35% vs. 56/104 (54%)—p = 0.1; and CCB (calcium channel blocker) exposure, 6/19 (32%) vs. 50/90 (56%)—p = 0.057 (by Pearson’s Chi-square).
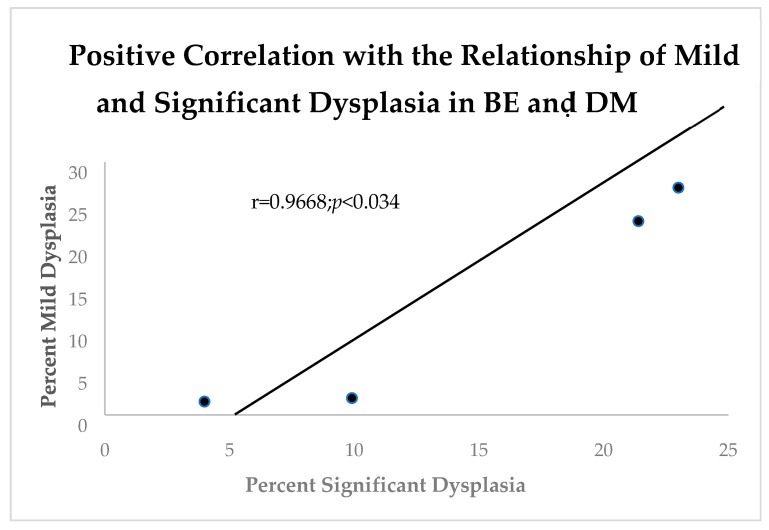
It is well known that diabetes mellitus (DM) causes generalized increased inflammation [10]. In order to contrast BE and the effects of DM where the vast majority were type 2, we compared the effects of DM with mild and severe dysplasia (Figure 3).
Figure 3.
Linear correlation diagram shows an expected positive relationship between mild and significant dysplasia in BE Patients with diabetes mellitus.
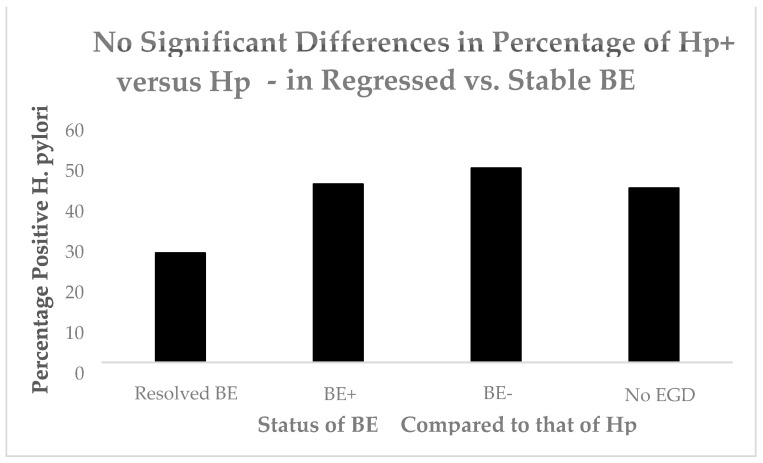
Other have confirmed the relationship of BE and DM [12]. Having shown an effect of DM, we turned to another upper gastrointestinal tract purveyor of inflammation, Helicobacter pylori (Hp). Figure 4 shows no significant effect of Hp in BE.
Figure 4.
A bar diagram showing no significant differences of Hp in BE.
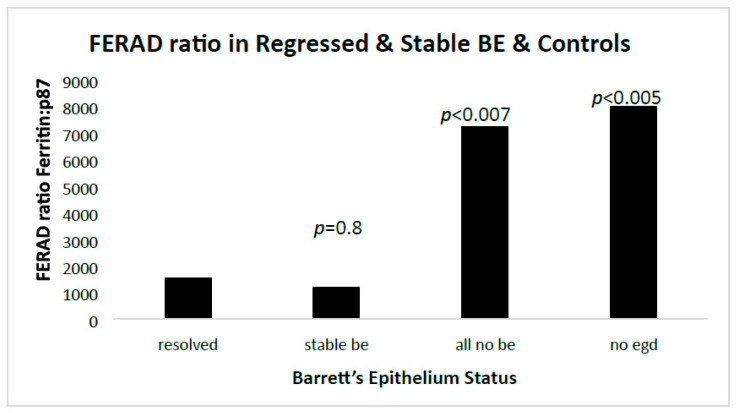
Since, thus far, only DM had an effect on inflammation and neoplasia, we explored the role of an InImS biomarker, the FERAD ratio, and found significant effects only between patients without BE, and none between regressed and stable BE (Figure 5).
Figure 5.
A bar diagram showing the proportional effects of the FERAD ratio in those with and without BE.
The non-EGD group included a large group of patients that were used as an undefined group for comparison with the refined groups. All groups were compared to the regressed BE patients.
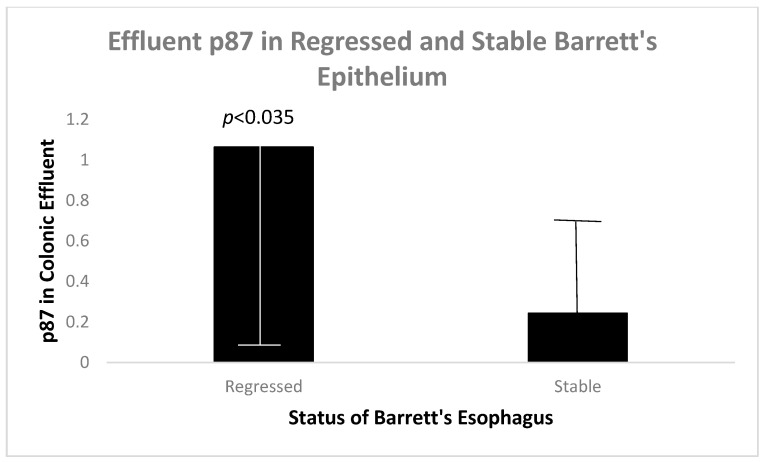
Since we have shown that p87 correlates with inflammatory and preneoplastic states [7,8], we looked at p87 in colonic washings (effluent) as another biomarker of the InImS (Figure 6).
Figure 6.
A bar diagram showing higher mean p87 in the colonic effluent of regressed Barrett’s epithelium patients as opposed to stable patients.
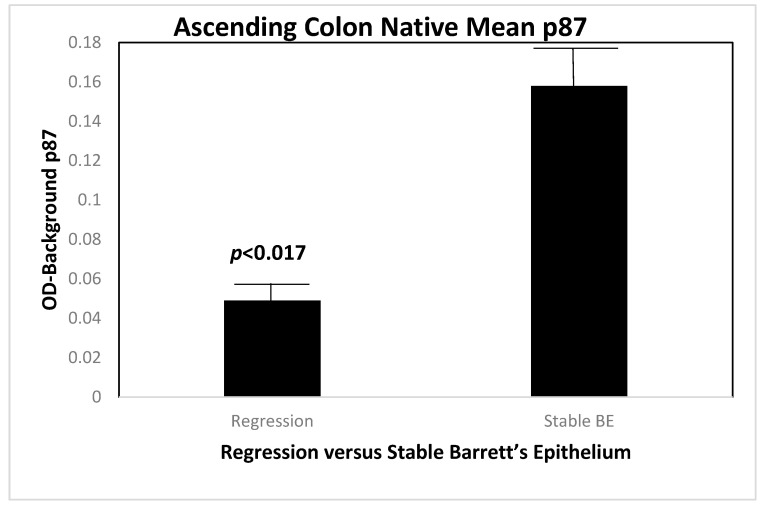
It was of much interest to reveal the source of the p87 in patients with regressed versus stable BE. We therefore contrasted the origins of native (non-fixed) p87 throughout the six regions of the colon in these two groups of patients, and the result can be seen in Figure 7 in biopsies taken from the ascending colon.
Figure 7.
A bar diagram showing the higher level of native p87 in the ascending colon of patients with regressed BE as compared to those with lower levels.
Figure 8 shows a statistically significant lower mean expression of native (unfixed) p87, in a location that is usually rich in Paneth cells. This suggests greater shedding of p87 from this area of the colon in patients with BE regression, and explains the higher p87 content in colonic washings (see Figure 6). In view of factors that drive inflammation [13], we looked at platelet levels in regressed and stable BE. We were able to show a strong relationship between low platelet counts and regression of BE.
Figure 8.
A bar diagram showing a significantly lower platelet count in the patients with BE regression.
In view of the cited regression of BE by PPi medications [14], we investigated the proportion of BE patients taking PPi and found that the proportions of BE regression patients were equivalent to those with stable BE (37.5 versus 38%), but we did not quantify the doses.
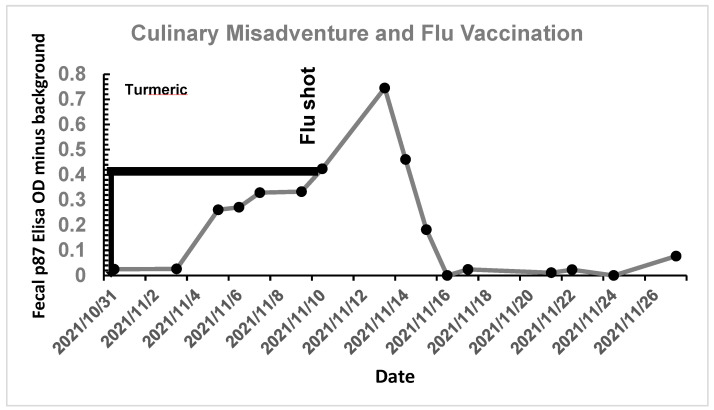
Importantly, it must be shown that the p97 can be manipulated to bring both stool p87 and FERAD ratios in order to achieve regression inter alia with anti-platelet medications. Figure 9 shows the effect of an undisclosed dose of turmeric on stool p87 of a 68-year-old otherwise healthy male, followed by a hospital-mandated flu vaccination.
Figure 9.
Effect of turmeric ingestion, followed by influenza vaccination, on fecal p87.
An undisclosed quantity of turmeric in vegetable broth was ingested for 11 days with a steady increase in fecal p87. This was followed by an influenza vaccination, resulting in a further increase to a peak of OD-background of 0.75 and then a decline to baseline at about 2 days thereafter. Turmeric therefore likely increases p87 and can be used to stimulate the InImS with little financial cost to the patient. However, it is also important to have a strategy that will enable suppression of p87 and the InImS.
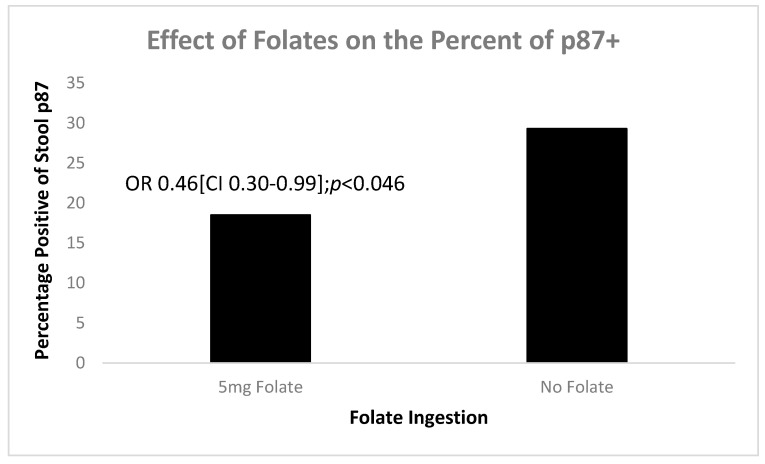
Our database revealed that patients were taking varied amounts of folic acid and we were able to measure p87 in 20 patients taking 5 mg versus 23 of those who were not. Figure 10 shows that folic acid significantly reduced positivity of p87 (OD-background > 0.05) compared to those not taking folates.
Figure 10.
A bar diagram shows that a daily dose of 5 mg folate significantly reduces stool p87.
These data support our supposition that p87 can be manipulated in order to encourage regression of BE. We now used in vitro testing to investigate the effects of low pH on cell lines.
3.1.3. Investigation of the Cell Line MAP Kinase (MAPK), Biomarker, and Adhesion Molecule Response to Exposure to Normal and Physiologically Low pH
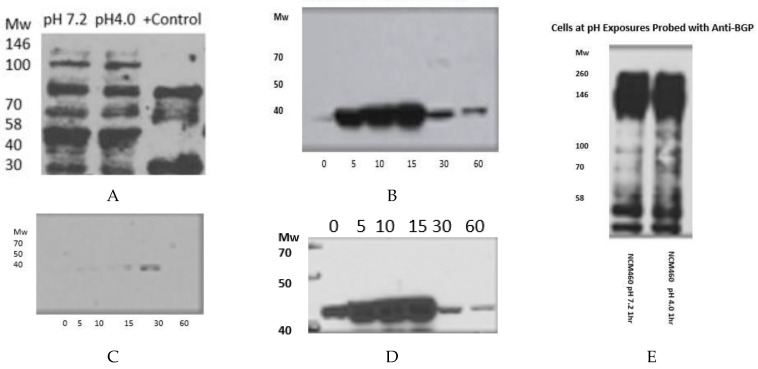
Investigation of the Effect of Normal and Physiologically Low pH Exposure on the Expression of the MAP Kinase (MAPK) Biomarker and Adhesion Molecule Response in the NCM460 Cell Line (Figure 11, Original images can be found in Supplementary Materials).
Figure 11.
Adnab-9 is pH Indifferent (A). Early Response of pp38ɣ (B). 30 min pp38 Mab response (C). Anti-ppERK Response (D). Western blot of NCM460 cell lines exposed to different pH levels for 1 h, stained for BGP using the CEACAM1 monoclonal (E).
In Figure 11A, showing incremental time exposures to pH 4, expression at low pH does not appear to affect p87 expression.
The physiological pH is 7.2 and the acidic pH is 4, and these exposures were all used for Figure 11.
Figure 11E shows that little difference is discerned between the blots at normal or low pH levels.
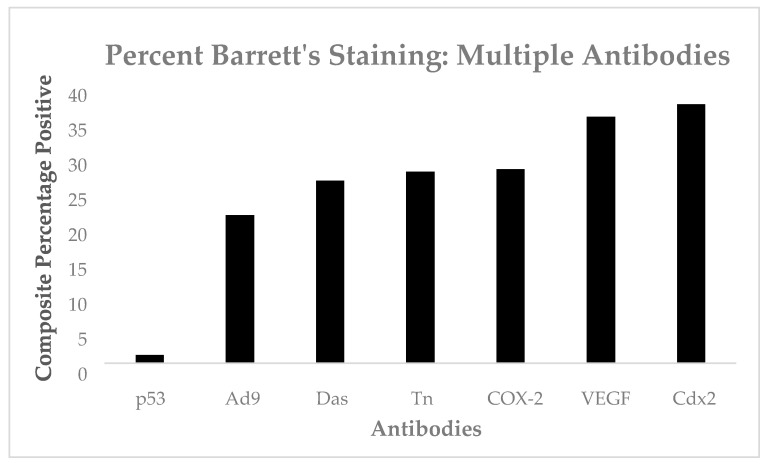
We do have cumulative data from our retrospective series, but there were no statistically significant differences between the antibodies and only one case stained with p53, as seen in Figure 12.
Figure 12.
A bar diagram with percentage staining of antibodies used.
4. Discussion
Dutch researchers were amongst the first to recognize that regression of BE may reduce the risk of cancer [15]. This was a prospective, double-blind, randomized controlled study that used omeprazole 40 mg twice daily to suppress acid secretion to 0.1% of initial secretion and showed a significant regression of BE on repeated endoscopic biopsy follow-up in 68 patients only with the omeprazole treatment with no effect with ranitidine 150 mg bid as the control, over 2 years. In another prospective, longitudinal study, seven of ninety-nine patients followed for 24–106 months showed complete regression of BE. There was an average endoscopic surveillance of 1.3 endoscopic examinations for each year of the study, with continuation of anti-reflux medications. The BE was confirmed with Lugol’s stain and the length of the BE noted [16]. Logistic, multiple regression showed that absence of a hiatal hernia appeared to be the only factor influencing the BE regression. Stepwise regression analysis also implicated length of the BE and absence of a hiatal hernia. A Korean publication [17] studied immunohistochemistry in 25 patients and found that 11 (44%) regressed and suggested an association between regression and lower grade of BE, less KI67, CDX2 expression. Retrospective data from the US [18] looked at 1382 patients with reflux who experienced regression in 505 patients (37.6%). While omeprazole intake was unassociated with regression, vitamin D was significantly increased, while the length of BE was significantly shorter. Interestingly, one patient who regressed was found to have dysplasia, which is unusual but soberly suggests that not all patients who regressed will be immune from neoplasia. No individual data for this patient were provided. However, it did confirm a statistically lower prevalence of hiatal hernia in the patients with BE regression (55.8 vs. 61.8%, respectively). BE regression has also been shown to be a consequence of gastric surgery [12].
The factors in regression mentioned above are all local phenomena and do not relate to a global picture. It has been postulated that the cells of BE emanate from different sources, even unexpected, such as the bone marrow [19]. Given the scope of BE and the likely interaction of this disease with the innate immune system, we expanded this paper to include both traditional laboratory investigation and novel, emergent innate immune system markers [7,8]. Two papers published in 2020 have shed some light on the relationship of the innate immune system in esophageal adenocarcinoma (EAC) and BE, the first by Gokon et al. [14], with immunolocalization in 83 EAC patients compared to 13 controls with BE. Abundant Fox3+ lamina propria lymphocytes (LPL) were found in the EAC patients’ BE sections with a tendency to be linked to p53 expression, and CD8 LPLs in the BE were associated with a worse prognosis in the EAC patients, suggesting a pro-neoplastic immune microenvironment. The second paper by Lagisetty et al. used RNA sequencing analysis, showing that an incremental increase in a subset of cytokines and chemokines, such as IL-6 and CACLB, was characteristic of progression from BE to EAC and implicated M-2 macrophages, pro-B cells, and eosinophils by xCell deconvolution analysis [20]. Compared to BE, EAC microarray immunostaining showed a paucity of immune cells in the face of PD-L1 predominance. We were most interested in the innate immune system as evaluated by a biomarker we termed the FERAD ratio, which uses blood ferritin as the enumerator and fecal Adnab-9 monoclonal binding as the denominator and p87 as the antigen recognized by Adnab-9. We have found this Yin and Yang ratio to be useful in predicting susceptibility to and severity of COVID-19, also correlating with the established absolute neutrophil:absolute lymphocyte count (NLR) [7], and it is also a prognostic marker in gastric adenocarcinoma [8]. We have also applied this biomarker to investigate aspects of BE regression [6], and if we can increase our understanding of the role of the innate immune system in inducing BE regression, we could conceivably eliminate the need for invasive interventions and morbidity. To the best of our knowledge, no workers in the field have attempted this strategy.
The debate regarding the source and role of BE continues unabated, and recently, an exhaustive and thorough study using transcriptomics and genomic techniques concluded that the MB arises from undifferentiated gastric cardia via cMYC and HNF4A transcriptional pathways and that EAC arises from undifferentiated Barrett’s cell types with no identifiable precursor [21]. Previously, p53, a nuclear transcription factor controlling proliferation and genetic stabilization, was a prime candidate and was the most prominent change seen in a large number of cancers, but very early on, a lack of correlation between p53 expression and tumor stage suggested that p53 protein overexpression is an early event in these tumors [22]. VEGF plays a crucial role in angiogenesis of many solid malignancies and, together with p53, correlates with the grade of the malignancy, and VEGF might play a role in the early stage of esophageal carcinogenesis [23]. COX-2 enzyme is often over-expressed in BE and esophageal adenocarcinoma as well as SCC, and one study showed clear COX-2 expression in the epithelial cells in Barrett’s metaplasia, which confirms elevated expression in adenocarcinoma, and it showed that the elevation in expression occurs in the progression from LGD to HGD [24]. Another study concluded that acid increases COX-2 expression through activation of the MAPK pathways, suggesting that acid reflux might promote carcinogenesis in Barrett’s esophagus [25,26]. While p87 is the antigen recognized by the Adnab-9 monoclonal, it is present in premalignant conditions [8] and appears to be part of the InImS and herein seems to play a role in the regression of BE, as the focal nature of staining is proportionate to that shown by Nomura et al. [27] and other authors, who speculate that regression may be associated with low MPC expression. In this study, CDX2 has reasonable sensitivity for BE, whether considering patients or sections, but lacks specificity in individual glandular sections and is thus inferior to a pathologist’s determination of BE. However, some do believe that in the change from squamous to intestinal phenotype, Cdx-2 may play a role as a premalignant marker [28].
Although reports of BE regression are highlighted in the introduction, they are not representative of the entire experience of regression, and while some appear to be successful in cases of Roux-en-Y gastric bypass, others could report only a single case in 1988 [29]. Later reports publicized bypass surgical response in the region of 62–64% in short and long BE segment after a mean of 47 months’ follow-up, but no effect on five patients with “extra-long” BE segments; only one of seventy-eight patients had a finding of low-grade dysplasia [30].
The results of the Western blotting show that acid has little effect on p87 or CEACAM1, and we have previously shown that there is a direct correlation between the two in primates [31]. Low pH causes phosphorylation of p38 by its upstream inflammatory congener, ERK [32]. We used the human colon mucosal cell line as a quintessential example of abundant mucin globules, which approximates the hallmark globules of BE. Seg1 has long been used as an alternative cell line to study BE, but in reality, it is more akin to lung adenocarcinoma, and its use should be avoided [33]. FLO-1, OE33, and OE21 cell lines, however, have a similar reaction to NCM360 cells. Although we did not discuss CDX2 or mAbDas-1 results, we had a small prospective series and had similar staining characteristics, with 46% positive for mAbDas-1 and 42% positive for CDX2. Of interest is that the BART-1 BE cell line, after prolonged exposure to bile salts and acid, can transform its phenotype and adopt colonocyte cellular characteristics [34], somewhat akin to the NCM360 cell line.
In terms of the antigenic landscape, the consistent factor for neoplastic progression of BE is abnormal p53 IHC staining, and a recent study with p53 staining in two cohorts, in 561 patients with and without progression, regardless of the diagnosis of dysplasia in retrospective and prospective cohorts [35], used methods similar to those used in our study. The latter had two pathologists, while theirs had a total of forty-one. However, our IHC was performed by a very experienced PhD in a single study, as opposed to three centers in their study, which may have possibly led to greater heterogeneity. That said, their study was a well-performed study, much broader in scope. p53, COX2, and Tn [36] have a possible role, but they have not been simultaneously studied in the Barrett’s transition. A publication that looked at VEGF found staining in 52% of moderate GERD and found a significant correlation with SSBE [13]. BE Length in COX-2 staining did not correlate. That said, COX-2 is putatively implicated in EAC, and accordingly, aspirin has been shown to reduce the cancer risk. As expected, COX-2 significantly correlated with inflammation but not progression [36]. The Tn antigen is an O-glycosylated glycan often found in cancer tissues, with complex amino acid moieties [37,38], and in Barrett’s cancers, Tn staining is found to correlate with depth of EAC invasion. Autocrine-secreted VEGF is universal in BE and dysplastic BE and VEGF receptors stimulate an ERK pathway [31], as we have shown in our Western blot NCM360 cells. In this study, CDX2 has reasonable sensitivity for BE whether considering patients or sections, but lacks specificity in individual BE sections and is thus inferior to a pathologist’s determination of BE. In Figure 2h, the general nuclear staining has been described in both non-dysplastic and dysplastic Barrett’s mucosa, and the global nuclear staining is seen, but the intensity increases in dysplastic epithelial nuclei [26].
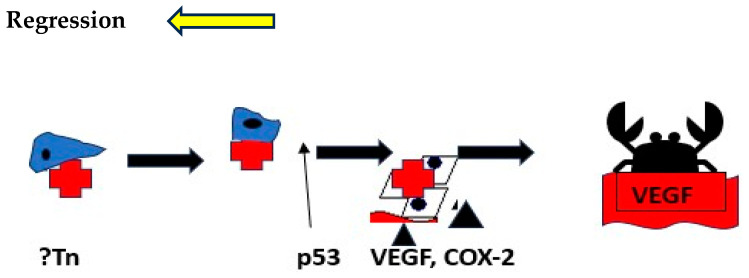
The p87 antigen recognized by the Adnab-9 monoclonal stains glandular BE, and regression is associated with gut-secreted p87, the source of which appears to be the rectum. In primates, p87 correlates with CEACAM1 [31], and the latter is a downstream effector of VEGF [39]. This concordance may be associated with BE progression. mAbDas-1 shares some staining characteristics with Adnab-9 in both BE [40] and intraductal papillary neoplasms of the pancreas [41]. All patients participating in the immunohistochemistry assays are described in Section 2.1.2. We offer Figure 13 as a stylized progression model thatwe have termed the MeDyCan pathway to neoplasia. In Figure 2f of Adnab-9 staining, the position of the eccentric nuclei with a basilar position suggests that all the cells with this configuration are in fact metaplastic Paneth cells (MPCs), known to be expressed in Barrett’s esophagus [42]. It has been shown in animal experiments that bile acids and acidic pH can induce squamous MPC [43]. Furthermore, Nomura et al. exposed a squamous cell in vitro culture to alpha-defensin-5, a Paneth cell secretion, and the expression of E-cadherin was reduced [27]. They suggested that cell–cell interaction may be reduced as a consequence, possibly leading to progression, but stopped short of assigning a neoplastic role.
Figure 13.
Stylized putative pathway leading to EAC in BE and regression.
The factors may allow BE regression by actors of the InImS and anti-inflammatory/antiplatelet medicine, at its earlier stages. Further studies will be needed to confirm this scenario. Tn initiates, and p53 indicates the point of no return and the crab, EAC.
5. Conclusions
Regression of BE appears to be related to lower hematologic platelet levels, InImS Paneth cell shedding, shorter length of Barrett’s epithelium, and lesser inflammation, younger age, and lower BMI values. Not all of these parameters are actionable, but some are, namely antiplatelet medications and NSAIDs, the latter being the least toxic, and it might also reduce inflammation. The InImS can increase activity by using turmeric or reduce p87 by using folates. Weight loss programs are on offer to veterans seeking to lose weight and reduce BMI. Certainly, a prospective, randomized, double-blind trial using these relatively innocuous measures may aid BE regression. From earlier studies, intensive PPi therapy has been shown to be effective. Omeprazole also has anti-neoplastic activity demonstrated in CRC [44] and breast [45] cancer cells, and we have previously shown that the growth of an aggressive neuroendocrine cell line NCI-H716, originally of colorectal origin, was curtailed significantly by omeprazole, in a milieu of gastrin added to the tissue culture medium [44]. The Adnab-9 binding to p87 was low in Barrett’s esophagus, regardless of regression or stability (Figure 1a,b), and was the lowest of all antibody labeling aside from p53 (Figure 12). The overall setting of the InImS, as gauged by the FERAD ratio, was also low (Figure 5), suggesting that the progression of Barrett’s neoplasia is “under the radar”. We have shown this proclivity in both infections (COVID) and gastric cancer [7,8]. Other moderating factors, such as H. pylori, are not operative (Figure 4). However, regression of Barrett’s epithelium does bear associations with increased effluent p87, presumably due to the reduced expression of native p87 in the mucosa of the ascending colon (Figure 6 and Figure 7). While p87 is found in both glandular and squamous portions of Barrett’s epithelium, this would appear to be a reaction to the effects of inflammation (Figure 2e,f), whereas the reported Paneth cell metaplasia appears to have an identical distribution at the base of the glandular epithelium and exhibit the morphological appearance of such cells in the normal small bowel [46]. Although there are contradictory reports about the efficacy of PPi in preventing cancer [47,48], they can be part of the armamentarium in the kings’ stable that we have outlined above, to affect regression on Barrett’s epithelium, and may also reduce EAC incidence by a minimum of 19% [47]. The role of diabetes adding to inflammation awaits elucidation [49].
Acknowledgments
The authors wish to thank Fazal Omar, Mejia Luis, Violeta Yordanova, and Yi Xu for their dedication and help with the project. We are grateful to Kiron Das and David Beer for their guidance and generosity and to John Frank for his expertise in performing the CDX2 immunohistochemistry. Marc E. Key of Dako Inc. provided antibodies and expertise. Andrea Snyr was our superb librarian. This paper is dedicated to our friend and teacher Rami Samuni. No AI was used in the formulation of this paper or any aspects thereof. We also acknowledge that the views expressed in this manuscript are not necessarily those of the US Federal Government and that this work is in the public domain. The authors who conceptualized this work are MT, FA, and LK. Those who actively performed assays were JH, OES, HT, MK, and LM, and those who actively helped write the manuscript were MT, EL, ML, BE, and MPM, who also provided the NCM360 cells.
Supplementary Materials
The following supporting information can be downloaded at: https://www.mdpi.com/article/10.3390/biom14091182/s1, Original images of Figure 11 can be found in supplementary materials.
Author Contributions
Conceptualization, M.T.; Methodology, H.T., J.H. (James Hatfield), M.P.M. and L.K.; Validation, M.J.L.; Formal analysis, M.T., N.K., O.A.-S., H.T., J.H. (James Hatfield), E.L., J.H. (Jason Hallman), M.J.L. and B.M.; Investigation, M.K.; Data curation, O.A.-S.; Writing – original draft, M.T.; Writing – review & editing, S.S., M.P.M., L.K. and B.M. All authors have read and agreed to the published version of the manuscript.
Institutional Review Board Statement
The study was approved by the IRB (institutional review board) and Human Investigation Committee of Wayne State University. The approval numbers are #070700MP4F and #H 09-62-94, and the approval dates are 13 September 2006 and 17 August 2000, respectively.
Informed Consent Statement
All patients gave informed consent.
Data Availability Statement
The data presented in this study are available on request from the corresponding author due to Data Transfer Agreement. This term means a written agreement between the provider and the recipient of data that are transferred from one to the other. It defines what data may be used, how the data will be used, who may access and use the data, how the data must be stored and secured, and how the recipient will dispose of the data after completion of the research.
Conflicts of Interest
Author Mary Pat Moyer was employed by the company INCELL Corporation LLC. The remaining authors declare that the research was conducted in the absence of any commercial or financial relationships that could be construed as a potential conflict of interest. The INCELL Corporation LLC had no role in the design of the study; in the collection, analyses, or interpretation of data; in the writing of the manuscript, or in the decision to publish the results.
Funding Statement
This research received no external funding.
Footnotes
Disclaimer/Publisher’s Note: The statements, opinions and data contained in all publications are solely those of the individual author(s) and contributor(s) and not of MDPI and/or the editor(s). MDPI and/or the editor(s) disclaim responsibility for any injury to people or property resulting from any ideas, methods, instructions or products referred to in the content.
References
- 1.Rosemurgy A., Wilfong C., Craigg D., Co F., Sucandy I., Ross S. The Evolving Landscape of Esophageal Cancer: A Four-Decade Analysis. Am. Surg. 2019;85:944–948. doi: 10.1177/000313481908500933. [DOI] [PubMed] [Google Scholar]
- 2.Verbeek R.E., Spittuler L.F., Peute A., van Oijen M.G., Ten Kate F.J., Vermeijden J.R., Oberndorff A., van Baal J.W., Siersema P.D. Familial clustering of Barrett’s esophagus and esophageal adenocarcinoma in a European cohort. Clin. Gastroenterol. Hepatol. 2014;12:1656–1663.e1. doi: 10.1016/j.cgh.2014.01.028. [DOI] [PubMed] [Google Scholar]
- 3.Giri S., Sundaram S. Screening for esophageal adenocarcinoma: Should we use Barrett’s screening protocols? Clin. Gastroenterol. Hepatol. 2020;20:2409–2418. doi: 10.1016/j.cgh.2021.11.015. [DOI] [PubMed] [Google Scholar]
- 4.Sawas T., Zamani S.A., Killcoyne S., Dullea A., Wang K.K., Iyer P.G., Fitzgerald R.C., Katzka D.A. Limitations of Heartburn and Other Societies’ Criteria in Barrett’s Screening for Detecting De Novo Esophageal Adenocarcinoma. Clin. Gastroenterol. Hepatol. 2022;20:1709–1718. doi: 10.1016/j.cgh.2021.10.039. [DOI] [PubMed] [Google Scholar]
- 5.Yusuf A., Fitzgerald R.C. Screening for Barrett’s Oesophagus: Are We Ready for it? Curr. Treat. Options Gastroenterol. 2021;19:321–336. doi: 10.1007/s11938-021-00342-1. [DOI] [PMC free article] [PubMed] [Google Scholar]
- 6.Mayrand S. Treatment of Barrett’s esophagus. Can. J. Gastroenterol. 1997;11((Suppl. B)):98B–102B. [PubMed] [Google Scholar]
- 7.Tobi M., Bluth M.H., Rossi N.F., Demian E., Talwar H., Tobi Y.Y., Sochacki P., Levi E., Lawson M., McVicker B. In the SARS-CoV-2 Pandora Pandemic: Can the Stance of Premorbid Intestinal Innate Immune System as Measured by Fecal Adnab-9 Binding of p87:Blood Ferritin, Yielding the FERAD Ratio, Predict COVID-19 Susceptibility and Survival in a Prospective Population Database? Int. J. Mol. Sci. 2023;24:7536. doi: 10.3390/ijms24087536. [DOI] [PMC free article] [PubMed] [Google Scholar]
- 8.Tobi M., Weinstein D., Kim M., Hatfield J., Sochacki P., Levi E., An T., Hamre M., Tolia V., Fligiel S., et al. Helicobacter pylori Status May Differentiate Two Distinct Pathways of Gastric Adenocarcinoma Carcinogenesis. Curr. Oncol. 2023;30:7950–7963. doi: 10.3390/curroncol30090578. [DOI] [PMC free article] [PubMed] [Google Scholar]
- 9.Ma S., Guo X., Wang C., Yin Y., Xu G., Chen H., Qi X. Association of Barrett’s esophagus with Helicobacter pylori infection: A meta-analysis. Ther. Adv. Chronic Dis. 2022;13:20406223221117971. doi: 10.1177/20406223221117971. [DOI] [PMC free article] [PubMed] [Google Scholar]
- 10.Iyer P.G., Borah B.J., Heien H.C., Das A., Cooper G.S., Chak A. Association of Barrett’s esophagus with type II Diabetes Mellitus: Results from a large population-based case-control study. Clin. Gastroenterol. Hepatol. 2013;11:1108–1114.e5. doi: 10.1016/j.cgh.2013.03.024. [DOI] [PMC free article] [PubMed] [Google Scholar]
- 11.Zampeli E., Karamanolis G., Morfopoulos G., Xirouchakis E., Kalampoki V., Michopoulos S., Savva S., Tzias V., Zouboulis-Vafiadis I., Kamberoglou D., et al. Increased Expression of VEGF, COX-2, and Ki-67 in Barrett’s Esophagus: Does the Length Matter? Dig. Dis. Sci. 2012;57:1190–1196. doi: 10.1007/s10620-011-1990-6. [DOI] [PubMed] [Google Scholar]
- 12.Goonawardena J., Ward S. Effect of Roux-en-Y gastric bypass on Barrett’s esophagus: A systematic review. Surg. Obes. Relat. Dis. 2021;17:221–230. doi: 10.1016/j.soard.2020.09.003. [DOI] [PubMed] [Google Scholar]
- 13.Vogel S., Thein S.L. Platelets at the crossroads of thrombosis, inflammation and haemolysis. Br. J. Haematol. 2018;180:761–767. doi: 10.1111/bjh.15117. [DOI] [PMC free article] [PubMed] [Google Scholar]
- 14.Gokon Y., Fujishima F., Taniyama Y., Ishida H., Yamagata T., Sawai T., Uzuki M., Ichikawa H., Itakura Y., Takahashi K., et al. Immune microenvironment in Barrett’s esophagus adjacent to esophageal adenocarcinoma: Possible influence of adjacent mucosa on cancer development and progression. Virchows Arch. 2020;477:825–834. doi: 10.1007/s00428-020-02854-0. [DOI] [PubMed] [Google Scholar]
- 15.Peters F.T.M., Ganesh S., Kuipers E.J., Sluiter W.J., Klinkenberg-Knol E.C., Lamers C.B.H.W., Kleibeuker J.H. Endoscopic regression of Barrett’s oesophagus during omeprazole treatment; a randomized double-blind study. Gut. 1999;45:489–494. doi: 10.1136/gut.45.4.489. Erratum in Gut 2000, 47, 54–55. [DOI] [PMC free article] [PubMed] [Google Scholar]
- 16.Weston A.P., Badr A.S., Hassanein R.S. Prospective Multivariate Analysis of Factors Predictive of Complete Regression of Barrett’s Esophagus. Am. J. Gastroenterol. 1999;94:3420–3426. doi: 10.1111/j.1572-0241.1999.01603.x. [DOI] [PubMed] [Google Scholar]
- 17.Hyun J.J., Lee H.S., Kim N. Predictable Marker for Regression of Barrett’s Esophagus by Proton Pump Inhibitor Treatment in Korea. J. Neurogastroenterol. Motil. 2013;19:210–218. doi: 10.5056/jnm.2013.19.2.210. [DOI] [PMC free article] [PubMed] [Google Scholar]
- 18.Brown C.S., Lapin B., Wang C. Predicting regression of Barrett’s esophagus: Results from a retrospective cohort of 1342 patients. Surg. Endosc. 2014;28:2803–2807. doi: 10.1007/s00464-014-3548-0. [DOI] [PubMed] [Google Scholar]
- 19.Que J., Garman K.S., Souza R.F., Spechler S.J. Pathogenesis and Cells of Origin of Barrett’s Esophagus. Gastroenterology. 2019;157:349–364. doi: 10.1053/j.gastro.2019.03.072. [DOI] [PMC free article] [PubMed] [Google Scholar]
- 20.Lagisetty K.H., McEwen D.P., Nancarrow D.J., Schiebel J.G., Ferrer-Torres D., Ray D., Frankel T.L., Lin J., Chang A.C., Kresty L.A., et al. Immune determinants of Barrett’s progression to esophageal adenocarcinoma. JCI Insight. 2021;6:e143888. doi: 10.1172/jci.insight.143888. [DOI] [PMC free article] [PubMed] [Google Scholar]
- 21.Nowicki-Osuch K., Zhuang L., Jammula S., Bleaney C.W., Mahbubani K.T., Devonshire G., Katz-Summercorn A., Eling N., Wilbrey-Clark A., Madissoon E., et al. Molecular phenotyping reveals the identity of Barrett’s esophagus and its malignant transition. Science. 2021;373:760–767. doi: 10.1126/science.abd1449. [DOI] [PubMed] [Google Scholar]
- 22.Flejou J.F., Muzeau F., Potet F., Lepelletier F., Fékété F., Hénin D. Overexpression of the p53 tumor suppressor gene product in esophageal and gastric carcinomas. Pathol. Res. Pract. 1994;190:1141–1148. doi: 10.1016/S0344-0338(11)80440-1. [DOI] [PubMed] [Google Scholar]
- 23.Ishikawa M., Kitayama J., Kazama S., Nagawa H. The expression pattern of vascular endothelial growth factor C and D in human esophageal normal mucosa, dysplasia and neoplasia. Hepatogastroenterology. 2004;51:1319–1322. [PubMed] [Google Scholar]
- 24.Morris C.D., Armstrong G.R., Bigley G., Green H., Attwood S.E. Cyclooxygenase-2 expression in the Barrett’s metaplasia-dysplasiaadenocarcinoma sequence. Am. J. Gastroenterol. 2001;96:990–996. doi: 10.1111/j.1572-0241.2001.03599.x. [DOI] [PubMed] [Google Scholar]
- 25.Souza R.F., Shewmake K., Pearson S., Sarosi G.A., Jr., Feagins L.A., Ramirez R.D., Terada L.S., Spechler S.J. Acid increases proliferation via ERK and p38 MAPK-mediated increases in cyclooxygenase-2 in Barrett’s adenocarcinoma cells. Am. J. Physiol. Gastrointest. Liver Physiol. 2004;287:G743-8. doi: 10.1152/ajpgi.00144.2004. [DOI] [PubMed] [Google Scholar]
- 26.Karamchandani D.M., Lehman H.L., Ohanessian S.E., Massé J., Welsh P.A., Odze R.D., Goldblum J.R., Berg A.S., Stairs D.B. Increasing diagnostic accuracy to grade dysplasia in Barrett’s esophagus using an immunohistochemical panel for CDX2, p120ctn, c-Myc and Jagged1. Diagn. Pathol. 2016;11:23. doi: 10.1186/s13000-016-0473-7. [DOI] [PMC free article] [PubMed] [Google Scholar]
- 27.Nomura Y., Tanabe H., Moriichi K., Igawa S., Ando K., Ueno N., Kashima S., Tominaga M., Goto T., Inaba Y., et al. Reduction of E-cadherin by human defensin-5 in esophageal squamous cells. Biochem. Biophys. Res. Commun. 2013;439:71–77. doi: 10.1016/j.bbrc.2013.08.026. [DOI] [PubMed] [Google Scholar]
- 28.Vallböhmer D., DeMeester S.R., Peters J.H., Oh D.S., Kuramochi H., Shimizu D., Hagen J.A., Danenberg K.D., Danenberg P.V., DeMeester T.R., et al. Cdx-2 expression in squamous and metaplastic columnar epithelia of the esophagus. Dis. Esophagus. 2006;19:260–266. doi: 10.1111/j.1442-2050.2006.00586.x. [DOI] [PubMed] [Google Scholar]
- 29.Perniceni T., Leymarios J., Molas G., Fékéte F. L’endobrachyoesophage régresse-t-il après diversion duodénale totale? [Does Barrett esophagus regress after total duodenal diversion?] Gastroenterol. Clin. Biol. 1988;12:709–712. (In French) [PubMed] [Google Scholar]
- 30.Csendes A., Bragheto I., Burdiles P., Smok G., Henriquez A., Parada F. Regression of intestinal metaplasia to cardiac or fundic mucosa in patients with Barrett’s esophagus suBEitted to vagotomy, partial gastrectomy and duodenal diversion. A prospective study of 78 patients with more than 5 years of follow up. Surgery. 2006;139:46–53. doi: 10.1016/j.surg.2005.05.022. [DOI] [PubMed] [Google Scholar]
- 31.Talwar H., McVicker B., Tobi M. p38γ Activation and BGP (Biliary Glycoprotein) Induction in Primates at Risk for Inflammatory Bowel Disease and Colorectal Cancer-A Comparative Study with Humans. Vaccines. 2020;8:720. doi: 10.3390/vaccines8040720. [DOI] [PMC free article] [PubMed] [Google Scholar]
- 32.Keswani R.N., Chumsangsri A., Mustafi R., Delgadom J., Cohen E.E., Bissonnette M. Sorafenib inhibits MAPK-mediated proliferation in a Barrett’s esophageal adenocarcinoma cell line. Dis. Esophagus. 2008;21:514–521. doi: 10.1111/j.1442-2050.2007.00799.x. [DOI] [PubMed] [Google Scholar]
- 33.Bus P., Siersema P.D., van Baal J.W. Cell culture models for studying the development of Barrett’s esophagus: A systematic review. Cell. Oncol. 2012;35:149–161. doi: 10.1007/s13402-012-0076-6. [DOI] [PMC free article] [PubMed] [Google Scholar]
- 34.Bajpai M., Liu J., Geng X., Souza R.F., Amenta P.S., Das K.M. Repeated exposure to acid and bile selectively induces colonic phenotype expression in a heterogeneous Barrett’s epithelial cell line. Lab. Investig. 2008;88:643–651. doi: 10.1038/labinvest.2008.34. [DOI] [PubMed] [Google Scholar]
- 35.Redston M., Noffsinger A., Kim A., Akarca F.G., Rara M., Stapleton D., Nowden L., Lash R., Bass A.J., Stachler M.D. Abnormal IP53 predicts risk of progression in patients with Barrett’s Esophagus Regardless of a diagnosis of dysplasia. Gastroenterology. 2022;162:468–481. doi: 10.1053/j.gastro.2021.10.038. [DOI] [PMC free article] [PubMed] [Google Scholar]
- 36.Ling F.C., Baldus S.E., Khochfar J., Xi H., Neiss S., Brabender J., Metzger R., Drebber U., Dienes H.P., Bollschweiler E., et al. Association of COX-2 expression with corresponding active and chronic inflammatory reactions in Barrett’s metaplasia and progression to cancer. Histopathology. 2007;50:203–209. doi: 10.1111/j.1365-2559.2007.02576.x. [DOI] [PubMed] [Google Scholar]
- 37.Dobrochaeva K., Khasbiullina N., Shilova N., Antipova N., Obukhova P., Ovchinnikova T., Galanina O., Blixt O., Kunz H., Filatov A., et al. Specificity of human natural antibodies referred to as anti-Tn. Mol. Immunol. 2020;120:74–82. doi: 10.1016/j.molimm.2020.02.005. [DOI] [PubMed] [Google Scholar]
- 38.Zhang Q., Yu C., Peng S., Xu H., Wright E., Zhang X., Huo X., Cheng E., Pham T.H., Asanuma K., et al. Autocrine VEGF Signaling Promotes Proliferation of Neoplastic Barrett’s Epithelial Cells Through a PLC-Dependent Pathway. Gastroenterology. 2014;146:461–472. doi: 10.1053/j.gastro.2013.10.011. [DOI] [PMC free article] [PubMed] [Google Scholar]
- 39.Rueckschloss U., Kuerten S., Ergün S. The role of CEA-related cell adhesion molecule-1 (CEACAM1) in vascular homeostasis. Histochem. Cell Biol. 2016;146:657–671. doi: 10.1007/s00418-016-1505-9. [DOI] [PubMed] [Google Scholar]
- 40.Rogge-Wolf C., Seldenrijk C.A., Das K.M. Prevalence of mAbDAS-1 positivity in biopsy specimens from the esophagogastric junction. Am. J. Gastroenterol. 2002;97:2979–2985. doi: 10.1111/j.1572-0241.2002.07114.x. [DOI] [PubMed] [Google Scholar]
- 41.Das K.K., Xiao H., Geng X., Fernandez-del-Castillo C., Morales-Oyarvide V., Daglilar E., Forcione D.G., Bounds B.C., Brugge W.R., Pitman M.B., et al. mAb Das-1 is specific for high-risk and malignant intraductal papillary mucinous neoplasm (IPMN) Gut. 2014;63:162634. doi: 10.1136/gutjnl-2013-306219. [DOI] [PMC free article] [PubMed] [Google Scholar]
- 42.Chen W., Frankel W.L., Cronley K.M., Yu L., Zhou X., Yearsley M.M. Significance of Paneth cell metaplasia in Barrett esophagus: A morphologic and clinicopathologic study. Am. J. Clin. Pathol. 2015;143:665–671. doi: 10.1309/AJCPVUJMCVBC9PKM. [DOI] [PMC free article] [PubMed] [Google Scholar]
- 43.Appelman H.D., Umar A., Orlando R.C., Sontag S.J., Nandurkar S., El-Zimaity H., Lanas A., Parise P., Lambert R., Shields H.M. Barrett’s esophagus: Natural history. Ann. N. Y. Acad. Sci. 2011;1232:292–308. doi: 10.1111/j.1749-6632.2011.06057.x. [DOI] [PubMed] [Google Scholar]
- 44.Tobi M., Chintalapani S., Goo R., Maliakkal B., Reddy J., Lundqvist M., Oberg K., Luk G. Omeprazole inhibits growth of cancer cell line of colonic origin. Dig. Dis. Sci. 1995;40:1526–1530. doi: 10.1007/BF02285203. [DOI] [PubMed] [Google Scholar]
- 45.Ihraiz W.G., Ahram M., Bardaweel S.K. Proton pump inhibitors enhance chemosensitivity, promote apoptosis, and suppress migration of breast cancer cells. Acta Pharm. 2020;70:179–190. doi: 10.2478/acph-2020-0020. [DOI] [PubMed] [Google Scholar]
- 46.Naini B.V., Souza R.F., Odze R.D. Barrett’s Esophagus: A Comprehensive and Contemporary Review for Pathologists. Am. J. Surg. Pathol. 2016;40:e45–e66. doi: 10.1097/PAS.0000000000000598. [DOI] [PMC free article] [PubMed] [Google Scholar]
- 47.Sharaiha R.Z., Freedberg D.E., Abrams J.A., Wang Y.C. Cost-effectiveness of chemoprevention with proton pump inhibitors in Barrett’s esophagus. Dig. Dis. Sci. 2014;59:1222–1230. doi: 10.1007/s10620-014-3186-3. [DOI] [PMC free article] [PubMed] [Google Scholar]
- 48.Zeng X., Liu L., Zheng M., Sun H., Xiao J., Lu T., Huang G., Chen P., Zhang J., Zhu F., et al. Pantoprazole, an FDA-approved proton-pump inhibitor, suppresses colorectal cancer growth by targeting T-cell-originated protein kinase. Oncotarget. 2016;7:22460–22473. doi: 10.18632/oncotarget.7984. [DOI] [PMC free article] [PubMed] [Google Scholar]
- 49.Tsalamandris S., Antonopoulos A.S., Oikonomou E., Papamikroulis G.A., Vogiatzi G., Papaioannou S., Deftereos S., Tousoulis D. The Role of Inflammation in Diabetes: Current Concepts and Future Perspectives. Eur. Cardiol. 2019;14:50–59. doi: 10.15420/ecr.2018.33.1. [DOI] [PMC free article] [PubMed] [Google Scholar]
Associated Data
This section collects any data citations, data availability statements, or supplementary materials included in this article.
Supplementary Materials
Data Availability Statement
The data presented in this study are available on request from the corresponding author due to Data Transfer Agreement. This term means a written agreement between the provider and the recipient of data that are transferred from one to the other. It defines what data may be used, how the data will be used, who may access and use the data, how the data must be stored and secured, and how the recipient will dispose of the data after completion of the research.


