

Abstract
Absolute quantity imaging of biomolecules on a single cell level is critical for measurement assurance in biosciences and bioindustries. While infrared (IR) transmission microscopy is a powerful label-free imaging modality capable of chemical quantification, its applicability to hydrated biological samples remains challenging due to the strong IR absorption by water. Traditional IR imaging of hydrated cells relies on powerful light sources, such as synchrotrons, to mitigate the light absorption by water. However, we overcome this challenge by applying a solvent absorption compensation (SAC) technique to a home-built benchtop IR microscope based on an external-cavity quantum cascade laser. SAC-IR microscopy adjusts the incident light using a pair of polarizers to pre-compensate the IR absorption by water while retaining the full dynamic range. Integrating the IR absorbance over a cell yields the total mass of biomolecules per cell. We monitor the total mass of the biomolecules of live fibroblast cells over twelve hours, demonstrating promise for advancing our understanding of the biomolecular processes occurring in live cells on the single-cell level.
Graphical Abstract

Characterizing and quantifying biomolecules in cells is critical for understanding cellular functions,1 macromolecular crowding,2,3 advanced biomanufacturing of therapeutics,4 and disease progression and diagnostics.5,6 However, the quantification of absolute mass in single live cells remains a measurement challenge. Traditional biochemical assays7 and mass spectrometry-based analyses are extremely sensitive,8 but their ensemble-based, destructive approach is unsuitable for characterizing highly heterogeneous, live cell systems. Optical imaging techniques such as fluorescence microscopy can discriminate individual cells with high molecular specificity to target markers. Still, the quantification of cell-consisting molecules is complicated by a lack of controllability in labeling efficiency and photobleaching.9,10 Alternatively, spontaneous or coherent Raman imaging11–13 can identify molecules without labeling by vibrational signatures; however, weak emission signals are system-dependent and, thus, yield only relative quantitation and require internal references of known concentrations for absolute quantification.13
Infrared (IR) absorption-based imaging can simultaneously identify label-free and quantify the absolute concentrations of molecules of a cell, including proteins, fatty acids, and nucleic acids, by detecting their spectral signatures with relatively high cross-sections.14 Moreover, the measured value, absorbance, is system-independent, making the value SI (international system of units)-traceable and, thus, interlaboratory-comparable. However, a fundamental challenge in IR absorption measurements of biological molecules is the broad and strong IR absorption by water.15 In particular, the water bending mode at 1650 cm−1 overlaps with the amide I absorption peak, a characteristic peak for protein quantification and secondary structure analysis,16 making IR unsuitable for quantifying this key biomolecule.
This challenge to IR imaging has been passively mitigated either by reducing the transmission path length,17,18 employing attenuated total reflectance (ATR) configurations,19,20 or using a synchrotron for increased light intensity.21 However, thinner sampling chambers suffer from physical compression of cells and difficulty in microfluidic control for live cell imaging applications. Despite the easy coupling of ATR detection with a live-cell chamber, ATR-IR can sense only a few micrometers near a substrate surface, representing only part of a cell. Bright synchrotron sources to enable transmission through water have been used for live cell IR imaging.22–24 However, the limited accessibility hinders the broad applicability of IR imaging. Chan and Kazarian reported non-synchrotron transmission Fourier-transform IR (FT-IR) images of live cells in microfluidic channels using a pair of hemisphere lenses.25,26 However, they did not track live cells to monitor their spectral variations over time.
Recently, readily available benchtop external-cavity quantum cascade lasers (EC-QCLs), which emit monochromatic tunable light in mid- and far-IR (800 – 3000 cm−1), have enabled new discrete frequency infrared microscope designs.27,28 Notably, QCL-based IR absorption microscopy demonstrates high speed, aberration correction, and high signal-to-noise (SNR).29,30 Other QCL-based IR microscopy methods based on indirect photothermal IR signals have been reported.31,32 For example, IR-pump visible-probe (refraction 32–34 and fluorescence 32,35,36) approaches enabled non-contact IR absorption imaging with sub-micrometer spatial resolution and were used for live cell imaging. However, the signal changes caused by a photothermal effect are sample- and system-dependent and, thus, are not readily convertible to absolute concentrations or mass.
On the other hand, a direct transmission-based IR imaging approach suffers challenges originating from the strong IR absorption by water in the mid-IR region. The transmitted light intensity varies by more than a thousand times near the amide I band. However, it is challenging to adjust the dynamic range of the detection system by multiple orders of magnitude during rapid wavelength scanning. To address this critical limitation, we recently introduced a simple optical technique that could adjust the incident light intensity rapidly with a great dynamic range.37 The method, called solvent absorption compensation (SAC), modified the incident light to equalize the transmission spectrum through a reference or solvent. Thus, SAC could use the maximum dynamics range over the entire scanning range, eliminating water absorption contribution optically and enhancing SNR by >100 times for the amide I absorption peak compared to a conventional IR transmission measurement.37 In subsequent SAC-IR spectroscopy papers,38,39 we used acousto-optic modulators (AOMs) to adjust the light intensity rapidly during wavelength scanning. However, AOM-based units for SAC require bulky footprints and can suffer from wavelength-dependent beam direction shifts, which can pose a significant challenge to hyperspectral imaging. Thus, in the present work, we introduce a set of rotating and fixed polarizers for SAC control.40 Because the response of the rotational stage of a polarizer is slower than the AOM response, this two-polarizer method may be unsuitable for very rapid wavelength-scanning spectroscopy systems. However, the deviation-free approach using two flat polarizers can work for a microscopy system where spatial scanning () precedes spectral scanning (). The two-polarizer SAC unit is coupled to a home-built transmission QCL-IR microscope in a sample-scanning mode with the entire laser wavenumber range spanning from 900 cm−1 to 1776 cm−1. This wide range covers the fingerprint peaks of multiple biomolecules, including protein, fatty acid, and nucleic acid, inside a single cell. We compare protein mass per cell between fixed and live cells using the amide I absorption peak of proteins near 1650 cm−1, which was not available by conventional non-SAC-IR approaches. We characterize system performance and demonstrate that a simple, direct transmission-based IR measurement can be used for live, intercellular absolute protein mass measurements.
Figure 1a shows the schematic of the SAC-IR microscope (SI for detailed description). Briefly, for SAC, the IR beam passed through an IR polarizer (ISP Optics) mounted on a rotation stage (Newport) and then back through a fixed IR polarizer; rotating the first polarizer modulated the incident light intensity as a function of wavelength. Sample chambers used in this work consisted of a 1 mm thick CaF2 slide (Crystran), a 25 μm spacer tape (3M), and a 1 mm thick CaF2 slide with drilled holes for cells and media introduction. For SAC, the transmitted beam was moved to a fluid-only blank region (termed reference region), and for each wavenumber, the rotating polarizer angle was adjusted so that the transmission intensity became a constant setpoint over the entire wavenumber scanning range. (see Figure S1).
Figure 1. Schematic of solvent absorption compensation IR (SAC-IR) microscopy.
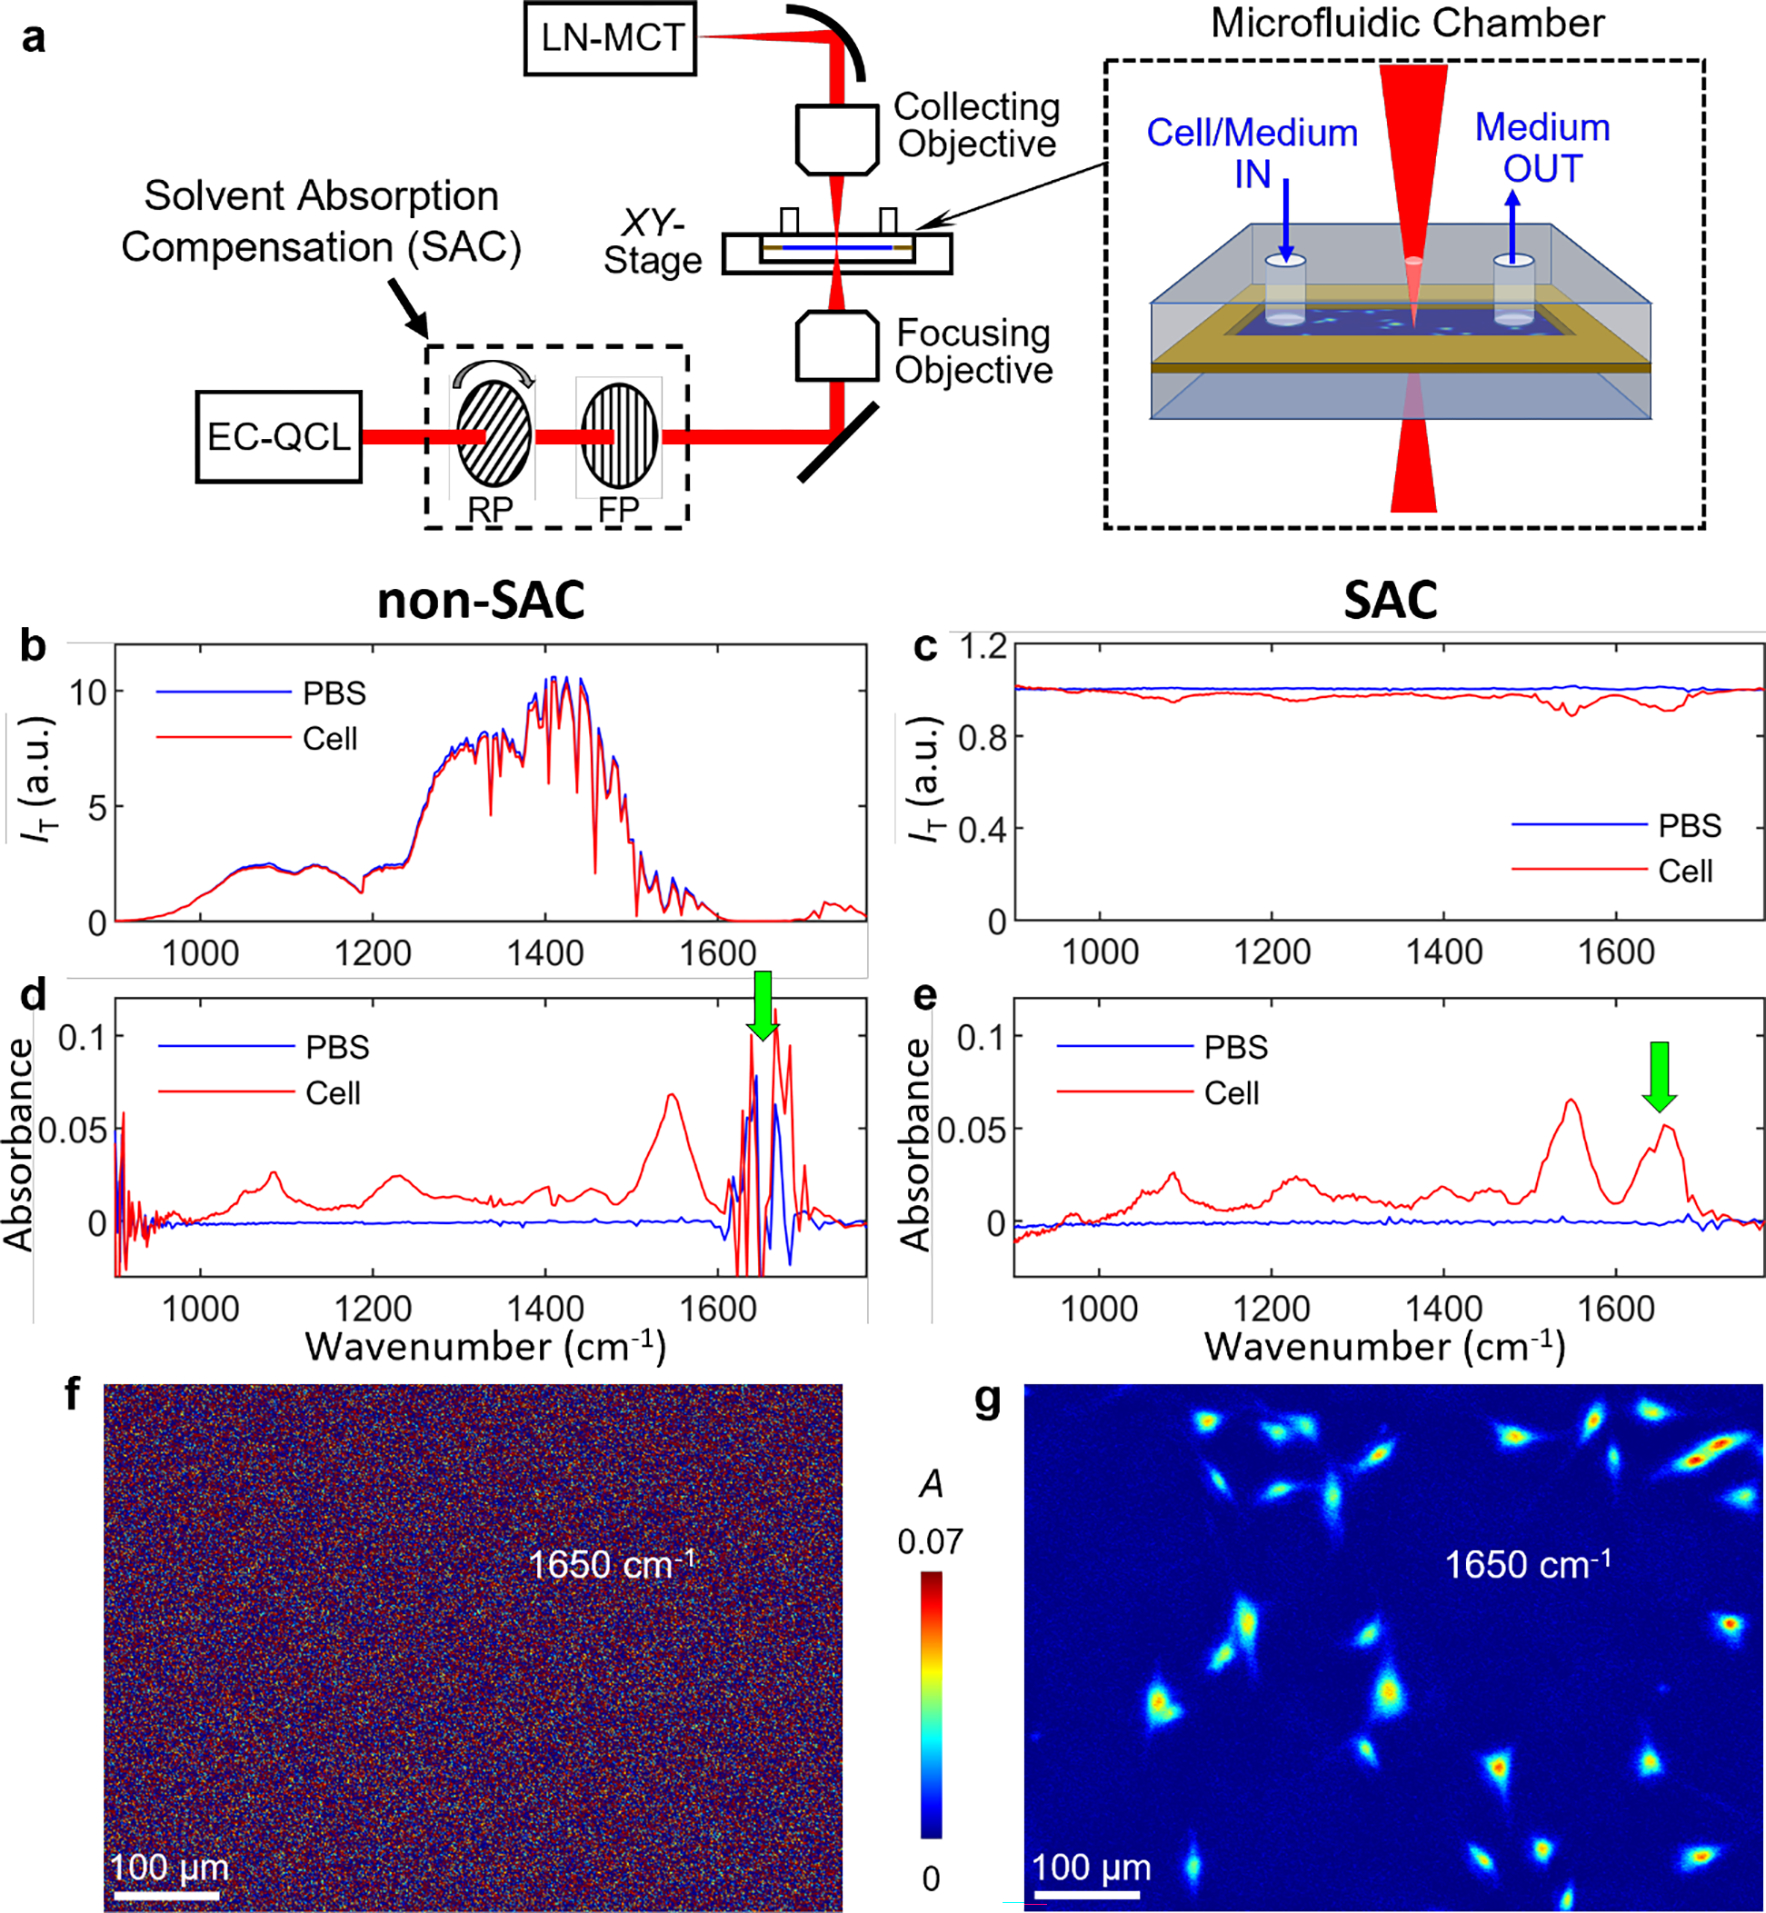
(a) Optical system of the SAC-IR microscopy setup. The laser intensity is controlled as a function of wavelength by a pair of rotating and fixed polarizers. EC-QCL: external-cavity quantum cascade laser; RP: rotating polarizer; FP: fixed polarizer; and LN-MCT: liquid nitrogen-cooled mercury-cadmium-telluride detector. The inset illustrates a microfluidic sample chamber consisting of two 1-mm thick CaF2 windows and a 25 μm spacer. One of the CaF2 windows has drilled holes for introducing cells and media. (b,c) Spectra of transmitted light intensity in a fixed fibroblast cell region (red) and a phosphate buffer saline (PBS) region (blue) without SAC (b) and with SAC (c). The acquisition time for a line spectrum () was 5 min. (d,e) Absorbance spectra of a PBS (reference, blue) and a fixed fibroblast cell (red) without SAC (d) and with SAC (e). (f,g) Absorbance images of fixed fibroblast cells, measured at 1650 cm−1 without SAC (f) and with SAC (g).
To demonstrate the need for SAC, we compared the transmitted light intensity IT of a reference region (Figure 1b, the blue line) to the transmission intensity from an image pixel near the center of a fixed NIH 3T3 fibroblast cell (Figure 1b, the red line, see SI for cell culture details). Figure 1b shows that without SAC, water strongly absorbs IR in the region of 1600 cm−1 – 1700 cm−1, and the transmission intensity difference between a reference (PBS-only region) and sample (PBS and fibroblast cell) is close to or below the dynamic range noise limit of the detection system. In comparison, Figure 1c demonstrates the SAC implementation; the reference intensity spectrum (PBS, the blue line) is near constant, and there is a resolvable intensity difference between the reference and sample. We also note that IR below 1000 cm−1 is weak due to strong absorption by the CaF2 windows, but SAC compensates for substrate IR absorption, too.
Figures 1d,e show absorption spectra in a reference region (blue) and near a cell center (red). The SAC-implemented IR spectra of the cell in the 1600 cm−1 –1700 cm−1 region are observable with a high SNR. We then constructed absorption images of hydrated fixed fibroblast cells (see Figure S2 for details). The absorption image without SAC in Figure 1f shows that cells are unresolved from the background because the strong absorption of water overlaps with absorption from biomolecules within the fibroblast cell. In SAC (Figure 1g), water absorption is compensated, and the absorption by analyte molecules in the cells becomes resolvable from the background. Figure S3 shows histograms of absorbance values; the broad distribution of the background in non-SAC overwhelms the signal of cells, whereas, in SAC, the cells’ absorbance values can be readily resolved from the narrowed main distribution. We estimate the pixel-to-pixel (spatial) absorbance noise at 1645 cm−1 in the background region (Figure S3) of non-SAC absorption images to be 0.025. The spatial absorbance noise in SAC images is 0.002, a >10-fold improvement compared to non-SAC. Similarly, the spectral noises measured in the 1623 cm−1 – 1672 cm−1 region are 0.020 and 0.002 for non-SAC and SAC, respectively (Figure S4).
Figure 2 demonstrates system performance in space and frequency using a mixture of polystyrene (PS, Phosphorex) and poly(methyl methacrylate) (PMMA, Phosphorex) particles dispersed in water. The nominal diameters of both particles are 5 μm. Similar to Figure 1, the absorbance of each image pixel was calculated by the reference (water) region. Thus, the apparent IR absorbance spectra of the two types of microparticles are shown in Figure 2a. Both spectra show a strong negative absorbance region centered near 1645 cm−1, indicating that the transmission is higher at a pixel than the background region. This apparent negative absorbance occurs when the matter in the beam path absorbs less light of the specific wavenumber than the replaced water.41,42 In addition to the water exclusion effect, the Mie scattering makes it difficult to quantitatively separate the inherent vibrational absorption spectrum and the scattering from an observed transmission spectrum. Even with the complex spectral mixing, the strong absorption peak centered near 1712 cm−1 observed from PMMA particles is assignable to the C=O stretching mode from the easter group of PMMA.43 Similar to PMMA particles, the apparent IR absorption spectrum of PS particles in Figure 2a shows the negative dip at 1645 cm−1 and the positive baseline drift due to water exclusion and light scattering, respectively. Still, the signature peaks at 1493 cm−1 and 1453 cm−1 of the benzene ring of PS were observable.44
Figure 2. System performance of SAC-IR microscopy.
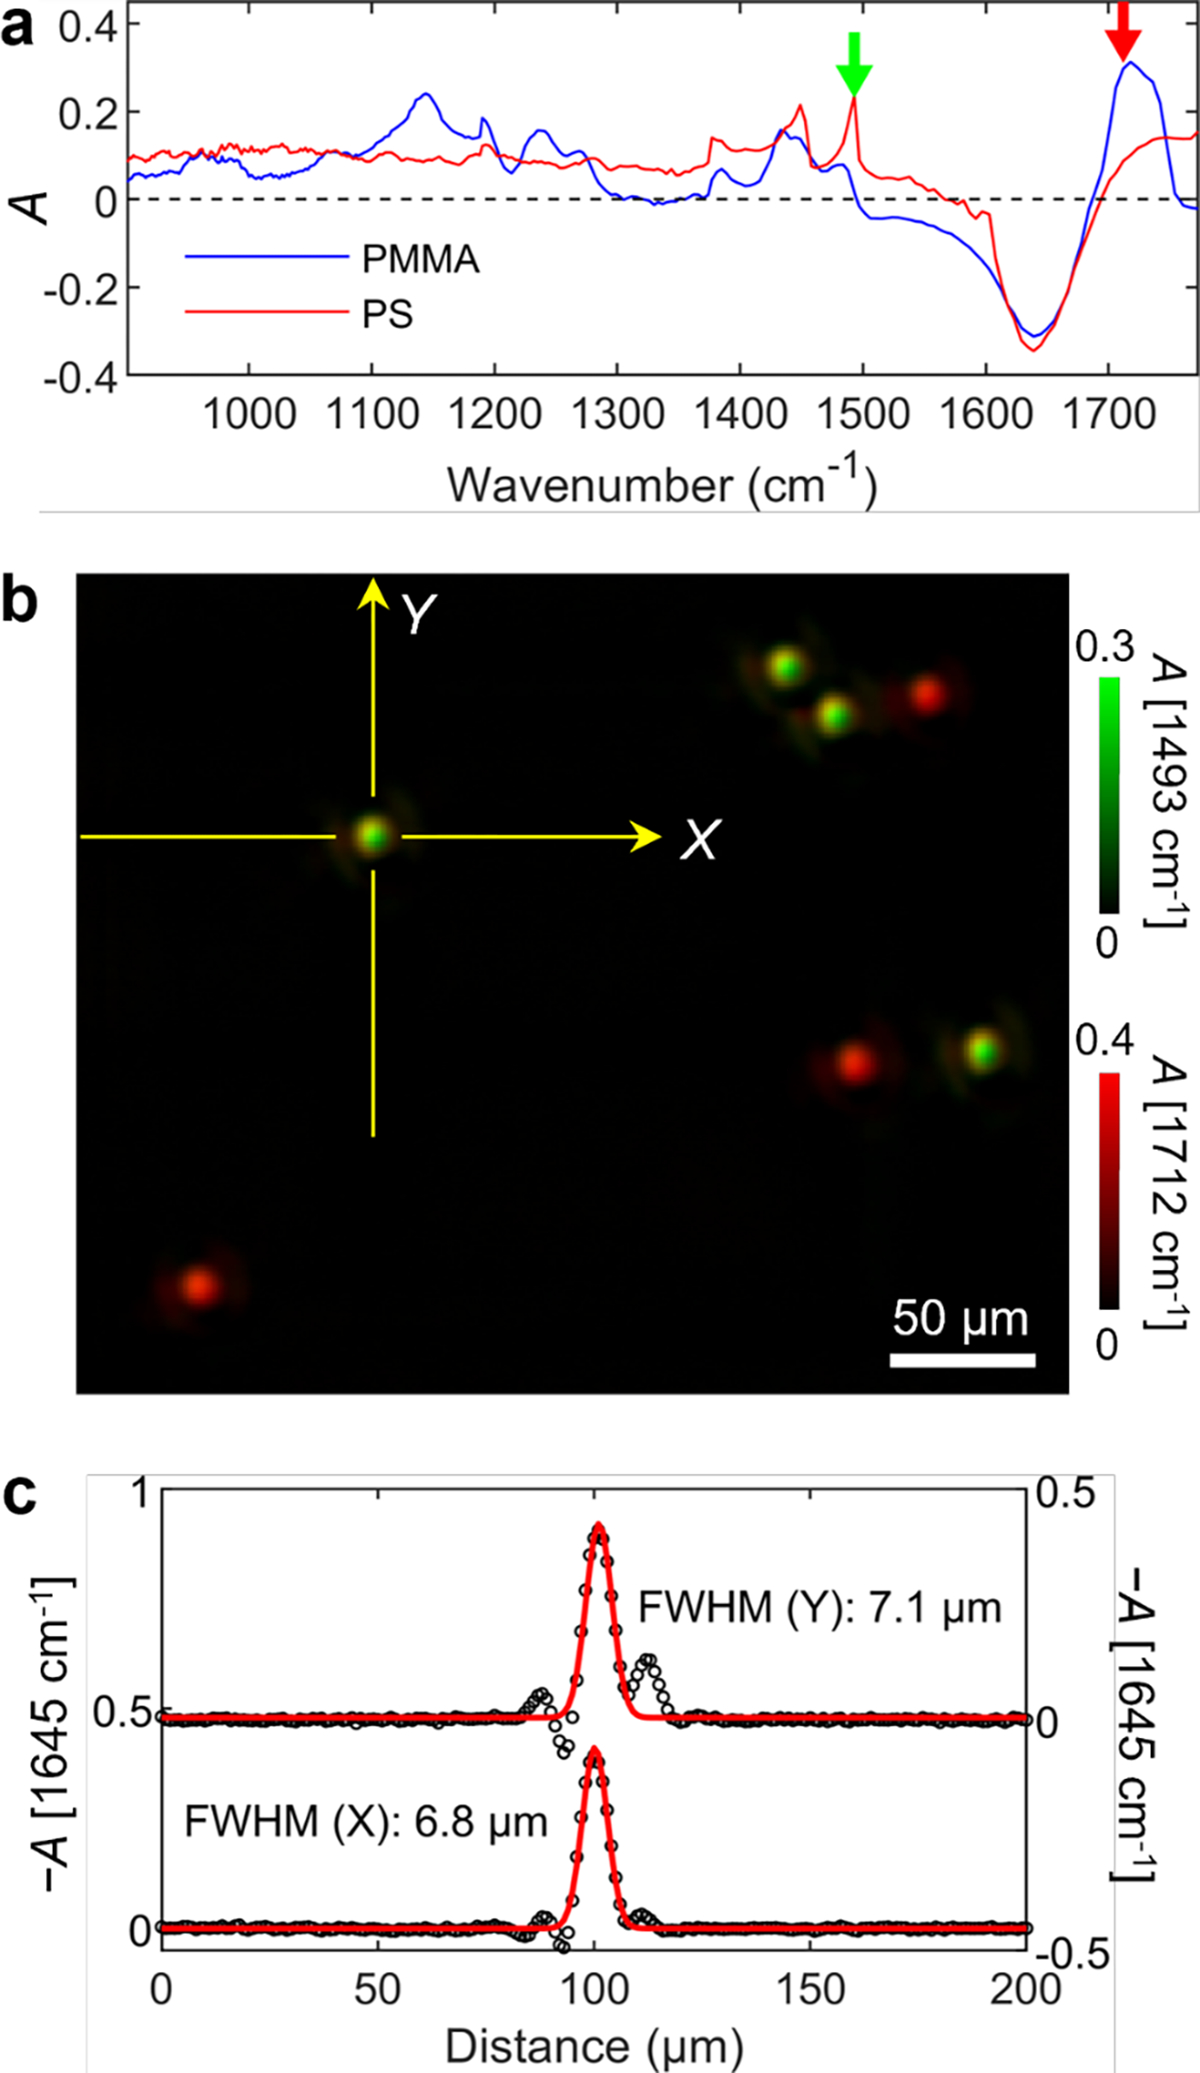
Imaging results using a mixture of 5-μm diameter polystyrene (PS) and poly(methyl methacrylate) (PMMA) microparticles in water with a 25 μm spacer. (a) IR spectra of the PS and PMMA microparticles using SAC. (b) Composite image with absorbances at 1493 cm−1 (green) and 1712 cm−1 (red) using SAC. (c) Line scans of the indicated PS particle in panel b.
Figure 2b shows a pseudo-labeled composite image of a microparticle mixture constructed with two absorbance images acquired at 1493 cm−1 (green) and 1712 cm−1 (red), corresponding to PS and PMMA, respectively. All particles in the composite image were readily identifiable as either PS or PMMA. We measured the full-width-half-maximum (FWHM) from line scans of multiple particles. The mean FWHMs from particles are 7.3 ± 0.2 μm in the fast-scanning direction (, horizontal) and 7.0 ± 0.4 μm in the slow-scanning direction (, vertical), where the uncertainties indicate the standard deviation. This resolving power is close to the diffraction-limited resolution (0.5λ/NA) at 1650 cm−1 with a 0.4 NA reflective objective.
Next, we demonstrate label-free chemical imaging of key biomolecules in fixed cells. Figure 3a shows the absorbance spectra of three fixed fibroblast cells. For each spectrum of a cell, the sample stage was -scanned at a fixed location, and it was repeated while the wavenumber changed. The line-averaged spectra of three different cells show similarity in IR peak position and width, although peak heights vary among cells. The peak height variation may be due to variations in either cell height or molecular concentration inside a cell or both. Unfortunately, the origin cannot be known only with an IR measurement. In Figure 3b, IR spectra were presented for comparison from representative cellular molecules, including protein, nucleic acid, and fatty acid ester. The peaks at 1650 cm−1 and 1550 cm−1 from the cells show a strong correlation with the amide I and II peaks of protein, respectively. On the other hand, the peaks observed at 1085 cm−1 and 1230 cm−1 correspond to the symmetric and antisymmetric PO2− stretching modes of nucleic acid, respectively.45 The weak peak at 1745 cm−1 can be attributed to the ester group in phospholipid or fatty acid ester. Although various types of ester molecules exist in cells, we will call the 1745 cm−1 peak for fatty acid, for simplicity, in this paper. Figures 3c–e show absorbance images constructed at the most relevant wavenumbers of protein, fatty acid, and nucleic acid, respectively. Because of the relatively weak absorbance of nucleic acid compared to the baseline, Figure 3e for nucleic acid was constructed by absorbance difference between 1085 cm−1 and 1053 cm−1. The composite image in Figure 3f shows the spatial distribution of the three biomolecules. The blue-colored feature is located at the center of cells, while protein is distributed over the entire cell. On the other hand, fatty acid is localized in non-nuclear regions.
Figure 3. SAC-IR spectra and images of fixed fibroblast cells.

(a) Line-averaged spectra of three different fixed fibroblast cells crossing the cell centers. (b) IR spectra of bovine serum albumin in water (solid green, rich in α-helix) and β-lactoglobulin in water (dotted green, rich in β-sheet) for protein, and herring DNA in water (blue) for nucleic acid. The absorption spectra of the proteins and DNA solutions were measured with a reference of deionized water. The absorption spectrum of glycerol trioctanoate in CCl4 and CS2 (red) for fatty acid ester was downloaded from the NIST Chemistry WebBook (webbook.nist.gov). All absorption spectra were scaled to the concentration of 10 mg/mL. (c–e) Absorbance images at wavenumbers representative of (c) protein at 1656 cm−1, (d) fatty acid at 1748 cm−1, and (e) nucleic acid at 1085 cm−1 and 1053 cm−1. (f) Composite image of panels c–e. The vertical dashed lines in a,b indicate the wavenumbers used to construct the images of panels c–e.
Among the IR peaks that represent biomolecules in the cell spectra, we focused on the absorbance peak at 1650 cm−1, which is dominantly due to the amide I peak of protein. Also, the absorption cross sections of major biomolecules, such as nucleic acid and fatty acid, are lower than that of protein at 1650 cm−1, as shown in Figure 3b. Some carbohydrates contain peptide bonds, e.g., sialic acid, but their concentration in a cell is much lower than proteins. Thus, for simplicity, we assumed the absorbance at 1650 cm−1 originated from proteins and used it to determine the absolute protein mass per cell.
If cell height is known, measured absorbance will lead to the concentration of molecules in a cell. However, the current imaging system could not measure absorbance and height simultaneously during live cell imaging. Instead, we determine the total mass per cell () from the absorbance sum () and the absorption coefficient () with the following relation,
| (1) |
where is the concentration; is the cell volume; is the absorption coefficient; is the mean cell height; is the cell area; and is the mean absorbance over . A cell area, , was determined by segmenting cells in absorption images with the threshold of 99% of the cumulative distribution of the background absorbance values (see SI for details).
To calculate protein , we used the absorption coefficient, at 1650 cm−1, calculated from the spectra of two non-glycosylated proteins with different secondary structures, shown in Figure 3b. However, we note that using a single value measured from only two protein solutions may yield a non-negligible uncertainty in determining the absolute mass of protein because non-protein molecules can still contribute to the 1650 cm−1 absorbance, and the peak shape of the amide I peak can vary depending on protein species. Thus, as long as imaging speed allows, values at more wavenumbers can be used for calculation, improving the accuracy in quantifying protein . Back to the straightforward and quick approach, the single value was used in Eq. (1) to calculate the protein of both fixed and live cells, whose SAC-IR images are shown in Figure 4a,b. The calculated protein values, shown in Figure 4c, span from 20 pg to 350 pg, and the distributions seem non-Gaussian. The median value of the fixed cells’ is 105 pg from 74 cells. This is slightly lower than that of live cells’ (122 pg from 94 cells). However, considering the breadth of the distributions, it is difficult to conclude whether protein is reduced by fixation or not. As a sanity test, we compared the protein by varying the threshold level for cell segmenting. Figure S5 shows that the mean protein is reduced by 6% when the threshold is elevated from 1 σ to 3 σ, where σ is the standard deviation of the background absorbance distribution. The range of protein is consistent with previously reported values from whole-cell protein mass measurements,46 UV absorption microscopy,47,48 and stimulated Raman scattering (SRS).13 Thus, despite the many assumptions and simplifications, the absorbance at 1650 cm−1 can be useful for the quantification of protein mass in live cells.
Figure 4. Comparison of SAC-IR images of fixed and live fibroblast cells.

(a,b) IR images of fixed and live cells at 1650 cm−1. (c) Scatter plots of protein mass per cell for 74 fixed and 94 live cells. The median (mean) values are 105 pg (126 pg) and 122 pg (131 pg) for fixed and live cells, respectively. The boxes indicate the 25% and 75%, and the horizontal lines indicate the median values.
Next, we used SAC-IR microscopy to image live cells every 12 min for 12 h at three representative wavenumbers (1656 cm−1, 1745 cm−1, and 1230 cm−1) for protein, fatty acid ester, and nucleic acid, respectively. For nucleic acid, we used absorbance at a single wavenumber of 1230 cm−1 instead of absorbance difference, as shown in Figure 3, to increase the imaging frame rate and take advantage of slightly higher absorbance signals. The absorbance images sequentially acquired for the three wavenumbers were combined into a composite image every 12 min. The time-lapse of entire IR absorbance composite images for 12 h can be found in SI Movie 1. Most cells were agile, and some underwent cell division. Figure 5a shows IR images at three different times among the total 62 frames. Figures 5b–d show the trajectories of three isolated and in-frame cells during the entire imaging. The cell labeled as b showed cell division. The cell c was about to finish cell division in the last frames. On the other hand, cell d did not show division but showed fluctuation in size while migrating. We monitored the fluctuation of the absorbances at the three wavenumbers corresponding to protein, fatty acid, and nucleic acid. Figures 5e–g show the total absorbance per cell () as a function of time for the three wavenumbers. The absorbance tracks of the three biomolecules show a strong correlation. For example, when the sample chamber was replenished with a CO2-saturated medium prepared in an incubator at , the absorbance tracks responded to the medium replacement. In Figures 5e,d, one hour before cell division, all three absorbances began to increase, likely to prepare cell division. On the other hand, the non-dividing cell d shows little correlation between the three absorbance profiles. For proteins, the total absorbance was converted into the absolute mass per cell using Eq. (1) and labeled on the right. Unlike absorbance at 1656 cm−1 for proteins, single-frequency absorbances at 1745 cm−1 and 1230 cm−1 can be contributed by other chemicals than fatty acid and nucleic acid. Thus, we did not convert the total absorbances at the two frequencies into the total masses of fatty acid and nucleic acid. However, if sufficiently more spectral images are available, their absolute per-cell masses could also be monitored. An IR transmission imaging system with a faster imaging speed and more frequencies could provide more quantitative, time-dependent information on the absolute per-cell masses for various biomolecules in live cells.
Figure 5. Live fibroblast SAC-IR images.

(a) Three-color SAC-IR images acquired every twelve minutes for twelve hours. Yellow color represents absorbance associated with protein at 1656 cm−1; magenta for fatty acid at 1745 cm−1; and cyan for nucleic acid at 1230 cm−1. (b–d) Enlarged images of the dividing cells (b and c) and the non-dividing cell (d), indicated in panel a. The centers of mass absorbance of the marked cells are plotted as time traces. (e–g) Tracking total absorbance per cell () of the cells in panel (b–d), respectively, measured at the three different wavenumbers. In (e), the red and black solid lines after 10.8 h are the values of the daughter cells.
In summary, we have demonstrated the non-synchrotron IR transmission imaging of live cells using the home-built SAC-IR microscopy technique. The SAC approach successfully mitigated the strong water absorption near the amide bands. Based on SAC-IR images measured at multiple frequencies, we have successfully demonstrated an optical method to measure the abundance and distribution of key biomolecules (e.g., protein, fatty acid, and nucleic acid) in fixed and live cells. In particular, using the total amide I band absorbance per cell, we determined the absolute per-cell mass of protein in multiple live fibroblast cells. By imaging live fibroblast cells over twelve hours, we monitor the per-cell mass change of the three molecular species during various phases, including cell division. The current demonstration was based on only three wavenumbers. If we could record more wavenumber images while maintaining biologically relevant frame rates for live cells, we would be able to retrieve more reliable and detailed information on molecular compositions. As an economical and widely adoptable imaging modality, SAC-IR microscopy could emerge as a standard imaging method of quantifying biomolecules with SI-traceability in live cells and hydrated tissues across fields such as biology, biotechnology, and medicine.
Supplementary Material
Acknowledgments
We thank Charles Camp for helpful discussions and Joy Dunkers for assistance with confocal microscopy. We thank the NIST Biomanufacturing Program for financial support. Yow-Ren Chang thanks the National Research Council for financial support.
Footnotes
The authors declare no competing financial interest.
Certain commercial equipment, instruments, or materials are identified in this paper to foster understanding. Such identification does not imply endorsement by NIST, nor does it imply that the materials or equipment identified are necessarily the best available for the purpose.
Official contribution of the National Institute of Standards and Technology; not subject to copyright in the United States.
Supporting Information.
The Supporting Information is available free of charge at https://pubs.acs.org/doi/10.1021/acs.analchem.4c02108.
Detailed experimental descriptions of SAC-IR microscope, samples, and data processing. Example of polarizer angle setting as a function of frequency for SAC pre-compensation of water absorption. Description of IR image pre-processing steps. Comparison between non-SAC and SAC signal and noise distributions. Comparison between non-SAC and SAC absorbance spectra. Description of the threshold level selection process to define the cell boundary (PDF)
Live cell IR absorption movies of NIH 3T3 fibroblast cells (MOV)
Data and materials availability
Data are available upon request from the corresponding author.
References
- (1).Poulhazan A; Dickwella Widanage MC; Muszyński A; Arnold AA; Warschawski DE; Azadi P; Marcotte I; Wang T Identification and Quantification of Glycans in Whole Cells: Architecture of Microalgal Polysaccharides Described by Solid-State Nuclear Magnetic Resonance. J Am Chem Soc 2021, 143 (46), 19374–19388. 10.1021/JACS.1C07429. [DOI] [PMC free article] [PubMed] [Google Scholar]
- (2).Ellis RJ Macromolecular Crowding: An Important but Neglected Aspect of the Intracellular Environment. Curr Opin Struct Biol 2001, 11 (1), 114–119. 10.1016/S0959-440X(00)00172-X. [DOI] [PubMed] [Google Scholar]
- (3).Wang Y; Sarkar M; Smith AE; Krois AS; Pielak GJ Macromolecular Crowding and Protein Stability. J Am Chem Soc 2012, 134 (40), 16614–16618. 10.1021/JA305300M. [DOI] [PubMed] [Google Scholar]
- (4).Ren J; Andrikopoulos N; Velonia K; Tang H; Cai R; Ding F; Ke PC; Chen C Chemical and Biophysical Signatures of the Protein Corona in Nanomedicine. J Am Chem Soc 2022, 144 (21), 9184–9205. 10.1021/JACS.2C02277. [DOI] [PubMed] [Google Scholar]
- (5).Vallabh SM; Nobuhara CK; Llorens F; Zerr I; Parchi P; Capellari S; Kuhn E; Klickstein J; Safar JG; Nery FC; Swoboda KJ; Geschwind MD; Zetterberg H; Arnold SE; Minikel EV; Schreiber SL Prion Protein Quantification in Human Cerebrospinal Fluid as a Tool for Prion Disease Drug Development. Proc Natl Acad Sci U S A 2019, 116 (16), 7793–7798. 10.1073/PNAS.1901947116. [DOI] [PMC free article] [PubMed] [Google Scholar]
- (6).Xu S; Ma W; Bai Y; Liu H Ultrasensitive Ambient Mass Spectrometry Immunoassays: Multiplexed Detection of Proteins in Serum and on Cell Surfaces. J Am Chem Soc 2019, 141 (1), 72–75. 10.1021/JACS.8B10853. [DOI] [PubMed] [Google Scholar]
- (7).Lidke DS; Wilson BS Caught in the Act: Quantifying Protein Behaviour in Living Cells. Trends Cell Biol 2009, 19 (11), 566–574. 10.1016/J.TCB.2009.08.004. [DOI] [PMC free article] [PubMed] [Google Scholar]
- (8).Comi TJ; Do TD; Rubakhin SS; Sweedler JV Categorizing Cells on the Basis of Their Chemical Profiles: Progress in Single-Cell Mass Spectrometry. J Am Chem Soc 2017, 139 (11), 3920–3929. 10.1021/JACS.6B12822. [DOI] [PMC free article] [PubMed] [Google Scholar]
- (9).Reiche MA; Aaron JS; Boehm U; DeSantis MC; Hobson CM; Khuon S; Lee RM; Chew TL When Light Meets Biology - How the Specimen Affects Quantitative Microscopy. J Cell Sci 2022, 135 (6). 10.1242/JCS.259656/274812. [DOI] [PubMed] [Google Scholar]
- (10).Waters JC Accuracy and Precision in Quantitative Fluorescence Microscopy. J Cell Biol 2009, 185 (7), 1135–1148. 10.1083/jcb.200903097. [DOI] [PMC free article] [PubMed] [Google Scholar]
- (11).Fu D; Lu FK; Zhang X; Freudiger C; Pernik DR; Holtom G; Xie XS Quantitative Chemical Imaging with Multiplex Stimulated Raman Scattering Microscopy. J Am Chem Soc 2012, 134 (8), 3623–3626. 10.1021/JA210081H. [DOI] [PMC free article] [PubMed] [Google Scholar]
- (12).Dodo K; Fujita K; Sodeoka M Raman Spectroscopy for Chemical Biology Research. J Am Chem Soc 2022, 144 (43), 19651–19667. 10.1021/JACS.2C05359. [DOI] [PMC free article] [PubMed] [Google Scholar]
- (13).Oh S; Lee CH; Yang W; Li A; Mukherjee A; Basan M; Ran C; Yin W; Tabin CJ; Fu D; Xie XS; Kirschner MW Protein and Lipid Mass Concentration Measurement in Tissues by Stimulated Raman Scattering Microscopy. Proc Natl Acad Sci U S A 2022, 119 (17), e2117938119. 10.1073/PNAS.2117938119. [DOI] [PMC free article] [PubMed] [Google Scholar]
- (14).Baker MJ; Trevisan J; Bassan P; Bhargava R; Butler HJ; Dorling KM; Fielden PR; Fogarty SW; Fullwood NJ; Heys KA; Hughes C; Lasch P; Martin-Hirsch PL; Obinaju B; Sockalingum GD; Sulé-Suso J; Strong RJ; Walsh MJ; Wood BR; Gardner P; Martin FL Using Fourier Transform IR Spectroscopy to Analyze Biological Materials. Nat Protoc 2014, 9 (8), 1771–1791. 10.1038/nprot.2014.110. [DOI] [PMC free article] [PubMed] [Google Scholar]
- (15).Quaroni L; Zlateva T Infrared Spectromicroscopy of Biochemistry in Functional Single Cells. Analyst 2011, 136 (16), 3219–3232. 10.1039/C1AN15060J. [DOI] [PubMed] [Google Scholar]
- (16).Xue M; Ye S; Ma X; Ye F; Wang C; Zhu L; Yang Y; Chen J Single-Vesicle Infrared Nanoscopy for Noninvasive Tumor Malignancy Diagnosis. J Am Chem Soc 2022, 144 (44), 20278–20287. 10.1021/JACS.2C07393. [DOI] [PubMed] [Google Scholar]
- (17).Wrobel TP; Bhargava R Infrared Spectroscopic Imaging Advances as an Analytical Technology for Biomedical Sciences. Anal Chem 2018, 90 (3), 1444–1463. 10.1021/acs.analchem.7b05330. [DOI] [PMC free article] [PubMed] [Google Scholar]
- (18).Doherty J; Cinque G; Gardner P Single-Cell Analysis Using Fourier Transform Infrared Microspectroscopy. Appl Spectrosc Rev 2017, 52 (6), 560–587. 10.1080/05704928.2016.1250214. [DOI] [Google Scholar]
- (19).Kazarian S; Chan SKLA; Kazarian SG; Chan KLA Attenuated Total Reflection Fourier-Transform Infrared (ATR-FTIR) Imaging of Tissues and Live Cells. Chem Soc Rev 2016, 45 (7), 1850–1864. 10.1039/C5CS00515A. [DOI] [PubMed] [Google Scholar]
- (20).Lórenz-Fonfría VA; Granell M; León X; Leblanc G; Padrós E In-Plane and out-of-Plane Infrared Difference Spectroscopy Unravels Tilting of Helices and Structural Changes in a Membrane Protein upon Substrate Binding. J Am Chem Soc 2009, 131 (42), 15094–15095. 10.1021/JA906324Z. [DOI] [PubMed] [Google Scholar]
- (21).Doherty J; Zhang Z; Wehbe K; Cinque G; Gardner P; Denbigh J Increased Optical Pathlength through Aqueous Media for the Infrared Microanalysis of Live Cells. Anal Bioanal Chem 2018, 410 (23), 5779–5789. 10.1007/s00216-018-1188-2. [DOI] [PMC free article] [PubMed] [Google Scholar]
- (22).Tobin MJ; Puskar L; Barber RL; Harvey EC; Heraud P; Wood BR; Bambery KR; Dillon CT; Munro KL FTIR Spectroscopy of Single Live Cells in Aqueous Media by Synchrotron IR Microscopy Using Microfabricated Sample Holders. Vib Spectrosc 2010, 53 (1), 34–38. 10.1016/J.VIBSPEC.2010.02.005. [DOI] [Google Scholar]
- (23).Quaroni L; Zlateva T; Sarafimov B; Kreuzer HW; Wehbe K; Hegg EL; Cinque G Synchrotron Based Infrared Imaging and Spectroscopy via Focal Plane Array on Live Fibroblasts in D2O Enriched Medium. Biophys Chem 2014, 189, 40–48. 10.1016/J.BPC.2014.03.002. [DOI] [PubMed] [Google Scholar]
- (24).Jamin N; Dumas P; Moncuit J; Fridman WH; Teillaud JL; Carr GL; Williams GP Highly Resolved Chemical Imaging of Living Cells by Using Synchrotron Infrared Microspectrometry. Proc Natl Acad Sci U S A 1998, 95 (9), 4837–4840. 10.1073/PNAS.95.9.4837. [DOI] [PMC free article] [PubMed] [Google Scholar]
- (25).Chan KLA; Altharawi A; Fale P; Song CL; Kazarian SG; Cinque G; Untereiner V; Sockalingum GD Transmission Fourier Transform Infrared Spectroscopic Imaging, Mapping, and Synchrotron Scanning Microscopy with Zinc Sulfide Hemispheres on Living Mammalian Cells at Sub-Cellular Resolution. Appl Spectrosc 2020, 74 (5), 544–552. 10.1177/0003702819898275. [DOI] [PubMed] [Google Scholar]
- (26).Chan KLA; Kazarian SG Aberration-Free FTIR Spectroscopic Imaging of Live Cells in Microfluidic Devices. Analyst 2013, 138 (14), 4040–4047. 10.1039/C3AN00327B. [DOI] [PubMed] [Google Scholar]
- (27).Yeh K; Kenkel S; Liu JN; Bhargava R Fast Infrared Chemical Imaging with a Quantum Cascade Laser. Anal Chem 2015, 87 (1), 485–493. 10.1021/ac5027513. [DOI] [PMC free article] [PubMed] [Google Scholar]
- (28).Phal Y; Yeh K; Bhargava R Design Considerations for Discrete Frequency Infrared Microscopy Systems. Appl Spectrosc 2021, 75 (9), 1067–1092. 10.1177/00037028211013372. [DOI] [PMC free article] [PubMed] [Google Scholar]
- (29).Mittal S; Yeh K; Suzanne Leslie L; Kenkel S; Kajdacsy-Balla A; Bhargava R Simultaneous Cancer and Tumor Microenvironment Subtyping Using Confocal Infrared Microscopy for All-Digital Molecular Histopathology. Proc Natl Acad Sci U S A 2018, 115 (25), E5651–E5660. 10.1073/pnas.1719551115. [DOI] [PMC free article] [PubMed] [Google Scholar]
- (30).Lux L; Phal Y; Hsieh P-H; Bhargava R On the Limit of Detection in Infrared Spectroscopic Imaging. Appl Spectrosc 2022, 76 (1), 105–117. 10.1177/00037028211050961. [DOI] [PMC free article] [PubMed] [Google Scholar]
- (31).Dazzi A; Prater CB AFM-IR: Technology and Applications in Nanoscale Infrared Spectroscopy and Chemical Imaging. Chem Rev 2017, 117 (7), 5146–5173. 10.1021/ACS.CHEMREV.6B00448. [DOI] [PubMed] [Google Scholar]
- (32).Zhang D; Li C; Zhang C; Slipchenko MN; Eakins G; Cheng J Depth-Resolved Mid-Infrared Photothermal Imaging of Living Cells and Organisms with Submicrometer Spatial Resolution. Sci Adv 2016, 2 (9), e1600521. 10.1126/sciadv.1600521. [DOI] [PMC free article] [PubMed] [Google Scholar]
- (33).Castillo HB; Shuster SO; Tarekegn LH; Davis CM Oleic Acid Differentially Affects Lipid Droplet Storage of de Novo Synthesized Lipids in Hepatocytes and Adipocytes. Chem Commun 2024, 60 (23), 3138–3141. 10.1039/D3CC04829B. [DOI] [PMC free article] [PubMed] [Google Scholar]
- (34).Gustavsson N; Paulus A; Martinsson I; Engdahl A; Medjoubi K; Klementiev K; Somogyi A; Deierborg T; Borondics F; Gouras GK; Klementieva O Correlative Optical Photothermal Infrared and X-Ray Fluorescence for Chemical Imaging of Trace Elements and Relevant Molecular Structures Directly in Neurons. Light Sci Appl 2021, 10 (1), 151. 10.1038/s41377-021-00590-x. [DOI] [PMC free article] [PubMed] [Google Scholar]
- (35).Li M; Razumtcev A; Yang R; Liu Y; Rong J; Geiger AC; Blanchard R; Pfluegl C; Taylor LS; Simpson GJ Fluorescence-Detected Mid-Infrared Photothermal Microscopy. J Am Chem Soc 2021, 143 (29), 10809–10815. 10.1021/JACS.1C03269. [DOI] [PubMed] [Google Scholar]
- (36).Jia D; Zhang Y; Yang Q; Xue Y; Tan Y; Guo Z; Zhang M; Tian L; Cheng J-X 3D Chemical Imaging by Fluorescence-Detected Mid-Infrared Photothermal Fourier Light Field Microscopy. Chemical & Biomedical Imaging 2023, 1 (3), 260–267. 10.1021/cbmi.3c00022. [DOI] [PMC free article] [PubMed] [Google Scholar]
- (37).Chon B; Xu S; Lee YJ Compensation of Strong Water Absorption in Infrared Spectroscopy Reveals the Secondary Structure of Proteins in Dilute Solutions. Anal Chem 2021, 93 (4), 2215–2225. 10.1021/acs.analchem.0c04091. [DOI] [PMC free article] [PubMed] [Google Scholar]
- (38).Kim S-M; Chang Y-R; Lee YJ Quantum Cascade Laser Infrared Spectroscopy for Glycan Analysis of Glycoproteins. Anal Chem 2024, 96 (32), 13120–13130. 10.1021/acs.analchem.4c01772. [DOI] [PubMed] [Google Scholar]
- (39).Kim S-M; Chang Y-R; Lee YJ Single-Detector Double-Beam Modulation for High-Sensitivity Infrared Spectroscopy. Sci Rep 2023, 13 (1), 18231. 10.1038/s41598-023-44740-0. [DOI] [PMC free article] [PubMed] [Google Scholar]
- (40).Hoke C; Moon CR; Ghetler A; Han Y High Dynamic Range Infrared Imaging Spectroscopy. 10184835, January 22, 2019. [Google Scholar]
- (41).Yang H; Yang S; Kong J; Dong A; Yu S Obtaining Information about Protein Secondary Structures in Aqueous Solution Using Fourier Transform IR Spectroscopy. Nat Protoc 2015, 10 (3), 382–396. 10.1038/nprot.2015.024. [DOI] [PubMed] [Google Scholar]
- (42).Rahmelow K; Hübner W Infrared Spectroscopy in Aqueous Solution: Difficulties and Accuracy of Water Subtraction. Appl Spectrosc 1997, 51 (2), 160–170. 10.1366/0003702971940080. [DOI] [Google Scholar]
- (43).NIST Chemistry WebBook. https://webbook.nist.gov/.
- (44).Liang CY; Krimm S Infrared Spectra of High Polymers. VI. Polystyrene. Journal of Polymer Science 1958, 27 (115), 241–254. 10.1002/pol.1958.1202711520. [DOI] [Google Scholar]
- (45).Banyay M; Sarkar M; Gräslund A A Library of IR Bands of Nucleic Acids in Solution. Biophys Chem 2003, 104 (2), 477–488. 10.1016/S0301-4622(03)00035-8. [DOI] [PubMed] [Google Scholar]
- (46).Conlon I; Raff M Differences in the Way a Mammalian Cell and Yeast Cells Coordinate Cell Growth and Cell-Cycle Progression. J Biol 2003, 2 (1), 7. 10.1186/1475-4924-2-7. [DOI] [PMC free article] [PubMed] [Google Scholar]
- (47).Cheung MC; LaCroix R; McKenna BK; Liu L; Winkelman J; Ehrlich DJ Intracellular Protein and Nucleic Acid Measured in Eight Cell Types Using Deep-Ultraviolet Mass Mapping. Cytometry Part A 2013, 83A (6), 540–551. 10.1002/cyto.a.22277. [DOI] [PubMed] [Google Scholar]
- (48).Zeskind BJ; Jordan CD; Timp W; Trapani L; Waller G; Horodincu V; Ehrlich DJ; Matsudaira P Nucleic Acid and Protein Mass Mapping by Live-Cell Deep-Ultraviolet Microscopy. Nat Methods 2007, 4 (7), 567–569. 10.1038/nmeth1053. [DOI] [PubMed] [Google Scholar]
Associated Data
This section collects any data citations, data availability statements, or supplementary materials included in this article.
Supplementary Materials
Data Availability Statement
Data are available upon request from the corresponding author.