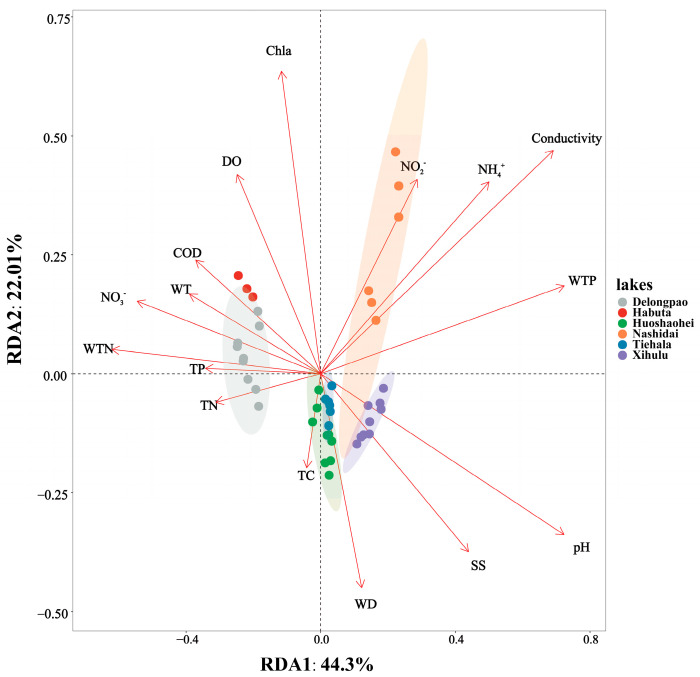
Figure 9.
RDA combining correspondence analysis with multiple regression analysis, where each step is regressed against environmental factors. Each dot represents a sample, with different colored dots corresponding to different lakes and ellipses indicating the 95% confidence intervals for each lake. The proximity of two dots reflects the higher functional similarity between the samples. Arrows represent environmental factors, and the angle between two arrows indicates the magnitude of the correlation between them. An acute angle suggests a positive correlation, a right angle suggests no correlation, and an obtuse angle indicates a negative correlation. The length of an arrow indicates the strength of that factor’s influence on the bacterial community structure and function. The angle between the arrow and the coordinate axis represents the degree of correlation with that axis, with lower angles indicating a higher correlation. The projection of a sample onto an environmental factor arrow reflects the relative value of that factor in the sample. The percentages next to the axes represent the proportion of variance in the dataset explained by each axis. TC: total carbon in sediment; TN: total nitrogen in sediment; TP: total phosphorus in sediment; WT: water temperature; DO: dissolved oxygen; Conductivity: electrical conductivity; pH: pondus hydrogen; WTP: total phosphorus in water; WTN: total nitrogen in water; NH4+: ammonia nitrogen; NO3−: nitrate nitrogen; NO2−: nitrous nitrogen; COD: chemical oxygen demand; Chla: chlorophyll a; SS: suspended solids.

