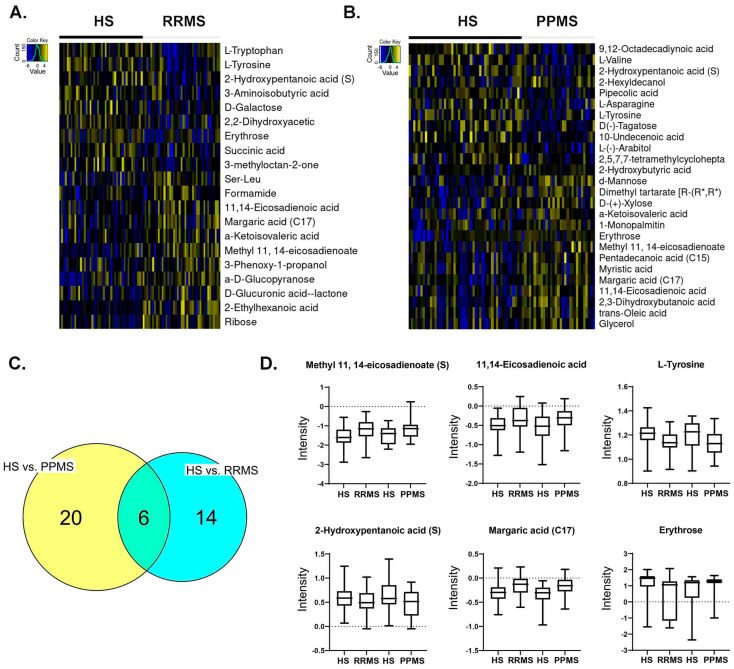
Figure 2.
Metabolite profile across RRMS vs. HS and PPMS vs. HS. (A) Heatmap of differential metabolites between RRMS patients and HS. (B) Heatmap of differential metabolites between PPMS and HS. (C) Overlap between differential metabolites in RRMS vs. HS and PPMS vs. HS patients. (D) Intensity plots depicting the differences among the HS, RRMS, and PPMS.

