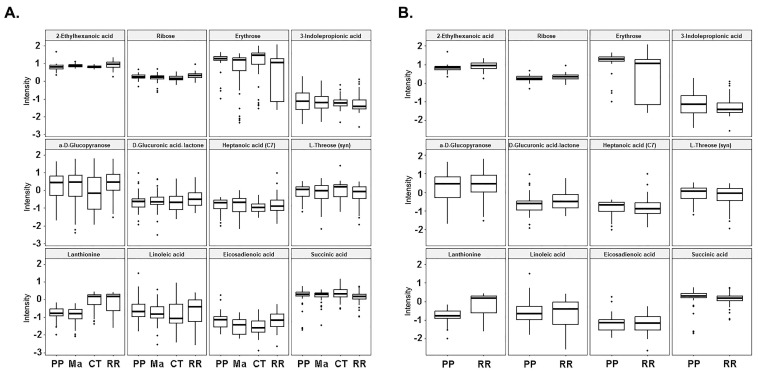
Figure 5.
S-signature across the HS, RRMS, and PPMS cohorts. (A) The intensity trend of the ‘S’- signature metabolites from 3 binary classifiers is shown for all the groups. (B) The intensity trend of the ‘S’ RRMS signature metabolites is shown between RRMS and PPMS only. (PP primary progressive; Ma: matched controls for PPMS; CT controls for RRMS; RR relapsing-remitting).

