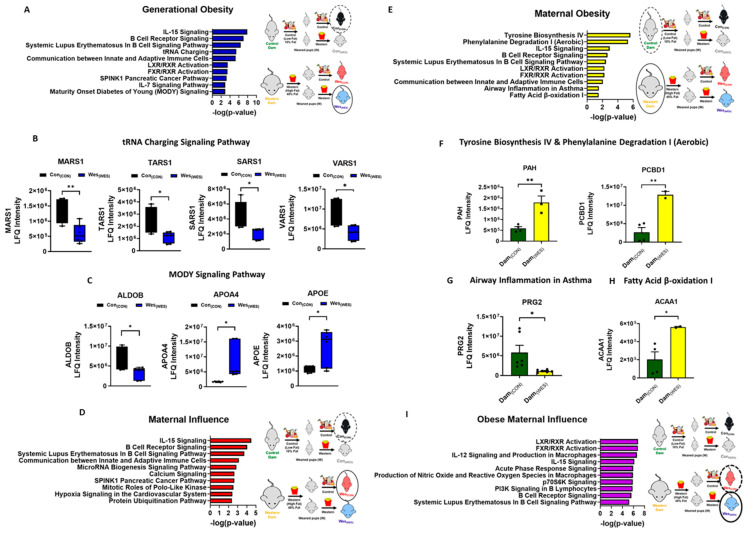
Figure 5.
Analysis of differentially expressed proteins. (A) Ingenuity pathway analysis of differentially regulated proteins among the generational obesity comparison group. (B) Differentially expressed proteins mapped to the tRNA charging signaling pathway. (C) Differentially expressed proteins mapped to the MODY signaling pathway. Ingenuity pathway analysis of differentially regulated proteins among the (D) maternal influence and (E) maternal obesity groups. Differentially expressed proteins mapped to the (F) tyrosine biosynthesis and phenylalanine degradation signaling pathway. (G) Airway inflammation in asthma signaling pathway and (H) fatty acid β-oxidation I signaling pathway. (I) Ingenuity pathway analysis of differentially regulated proteins among the obese maternal influence groups. The top 10 pathways are represented in the ingenuity pathway analysis figures. * p < 0.05; ** p < 0.01.

