Abstract
Glutamate is the predominant excitatory neurotransmitter in the mammalian brain. Once released, its rapid removal from the synaptic cleft is critical for preventing excitotoxicity and spillover to neighboring synapses. Despite consensus on the role of glutamate in normal and disease physiology, technical issues limit our understanding of its metabolism in intact cells. To monitor glutamate levels inside and at the surface of living cells, genetically encoded nanosensors were developed. The fluorescent indicator protein for glutamate (FLIPE) consists of the glutamate/aspartate binding protein ybeJ from Escherichia coli fused to two variants of the green fluorescent protein. Three sensors with lower affinities for glutamate were created by mutation of residues peristeric to the ybeJ binding pocket. In the presence of ligands, FLIPEs show a concentration-dependent decrease in FRET efficiency. When expressed on the surface of rat hippocampal neurons or PC12 cells, the sensors respond to extracellular glutamate with a reversible concentration-dependent decrease in FRET efficiency. Depolarization of neurons leads to a reduction in FRET efficiency corresponding to 300 nM glutamate at the cell surface. No change in FRET was observed when cells expressing sensors in the cytosol were superfused with up to 20 mM glutamate, consistent with a minimal contribution of glutamate uptake to cytosolic glutamate levels. The results demonstrate that FLIPE sensors can be used for real-time monitoring of glutamate metabolism in living cells, in tissues, or in intact organisms, providing tools for studying metabolism or for drug discovery.
Keywords: aspartate, hippocampal neuron, neurotransmitter, secretion, transport
In addition to being an intermediate of primary metabolism in all biological cells, glutamate serves as the major excitatory amino acid neurotransmitter in the vertebrate central nervous system (1). As such, glutamate influences essentially all forms of behavior, including consciousness, sensory perception, motor control, and mood. Changes in the strength of connectivity at glutamatergic synapses in the form of long-term potentiation and long-term depression are considered to be the cellular mechanisms underlying learning and memory (2). In addition to its role in normal nervous system physiology, glutamate is also thought to be directly involved in neurologic damage occurring in stroke and neurodegenerative disorders, including AIDS-dementia complex, motor neuron disease, and Alzheimer's and Parkinson's diseases, through receptor-mediated toxicity (3).
Despite its prominent role in normal and disease physiology, accurate and precise measurements of glutamate in living tissue are lacking. The concentration of glutamate in the cytoplasm and synaptic vesicles in neurons has been estimated by measurements of the amino acid in extracts (4). Extracellular glutamate concentrations have been measured by in vivo microdialysis techniques (5, 6). However, these techniques are limited in spatial and temporal resolution and are not suitable for detecting rapid local concentration changes around single synapses.
In vivo measurement of ions and metabolites making use of FRET has successfully been used to measure calcium concentration changes. Genetically encoded sensors for calcium were generated by fusing two fluorescent proteins (FPs) with different emission spectra to a recognition element consisting of calmodulin and the M13 peptide (7, 8). Binding of calcium to calmodulin causes a global structural rearrangement resulting in a significant change in FRET intensity. Recently, a number of bacterial periplasmic binding proteins, which upon ligand binding undergo a venus flytrap-like closure of their two lobes, have successfully been used as scaffolds to develop FRET nanosensors for maltose, ribose, and glucose (9-11). Because they are encoded genetically, the sensors can be used in vivo and targeted to subcellular compartments to specifically analyze concentration changes within a specific compartment of an intact live cell (12).
De Lorimier et al. (13) showed that the ybeJ protein from Escherichia coli, which shares sequence homology to glutamine- and histidine-binding proteins, can function as an in vitro glutamate sensor when coupled to an environmentally sensitive small molecule dye. YbeJ was thus used as a recognition element for developing fluorescent indicator proteins for glutamate (FLIPE), reasoning that the hinge-bending motion could be allosterically transduced into a glutamate-dependent change in FRET efficiency between the attached FPs. FLIPE nanosensors were generated by flanking the mature ybeJ protein with enhanced cyan FP (ECFP) and Venus, a yellow FP (YFP) variant with reduced pH sensitivity and chloride sensitivity (14). The ratio between Venus and ECFP emission intensity changed upon addition of glutamate in a concentration-dependent and saturable manner, demonstrating that the conformation change in the glutamate recognition domain is translated into a change in FRET efficiency. When a FLIPE sensor with a Kd of 630 nM was expressed on the surface of rat hippocampal cells or rat pheochromocytoma PC12 cells, the sensor responds to extracellular glutamate with a reduced Venus/ECFP emission intensity ratio. This reduction in FRET efficiency is also observed when rat hippocampal cells expressing a surface-anchored FLIPE sensor were electrically or chemically depolarized. An affinity mutant of FLIPE (with a Kd of 10 μM) expressed on the cell surface responded to perfusion with glutamate and responded weakly to electrical or chemical stimulation, consistent with the hypothesis that the concentration of glutamate released from the cells are at the low end of the dynamic range of this lower-affinity sensor. Taken together, FLIPE sensors can be used to monitor glutamate concentrations over a wide concentration range at the surface of living cells. The set of genetically encoded nanosensors for glutamate may therefore be suitable for applications such as measuring glial glutamate metabolism and transport, visualization of spillover effects, or detection of neuronal activity in live organisms, and applications in other areas such as analysis of glutamate metabolism and transport.
Experimental Procedures
FLIPE Constructs and Plasmids. A truncated glutamate/aspartate-binding protein sequence (ybeJ, also gltI; NP_415188), encoding the predicted mature protein without periplasmic leader sequence, was amplified by PCR from E. coli K12 genomic DNA by using primers 5′-ggtaccggaggcgccgcaggcagcacgctggacaaaatc-3′ and 5′-accggtaccggcgccgttcagtgccttgtcattcggttc-3′. The PCR fragment was cloned into the KpnI site of FLIPmal-25μ (9) in pRSET-B (Invitrogen), exchanging the maltose-binding protein sequence with that of ybeJ. The resulting plasmid was named pRSET-FLIPE-600n. To improve pH tolerance and chloride tolerance and maturation of the sensor, enhanced YFP in pRSET-FLIPE-600n was replaced with the coding sequence of Venus, a YFP variant with improved pH tolerance and maturation rate (14). Affinity mutants carrying the substitution S118W (initiator methionine counted as position 1), A207R, or A207W were created by site-directed mutagenesis (15), and sequences were verified. pRSET-FLIPE constructs were transferred to E. coli BL21(DE3)Gold (Stratagene) by electroporation. FLIPE proteins expressed in BL21(DE3)Gold strain were extracted and purified as described in ref. 9.
For expression in the cytosol of PC12 cells, DNA fragments containing FLIPE-100μ and FLIPE-1m sequences were excised from pRSET-FLIPE-100μ and pRSET-FLIPE-1m with BamHI/HindIII and cloned into pCDNA3.1 (Invitrogen).
For expression at the cell surface, FLIPE-600n and FLIPE-10μ cassettes were cloned into pDisplay (Invitrogen) as follows: XmaI site and SalI sites were introduced at the 5′ and 3′ ends of the FLIPE cassette by PCR with primers 5′-gagcccgggatggtgagcaagggcgaggag-3′ and 5′-gaggtcgaccttgtacagctcgtccatgccgag-3′. PCR fragments were cloned into pGEM-T-Easy (Promega), sequenced to confirm construct fidelity, excised with XmaI/SalI, and cloned into pDisplay.
In Vitro Characterization of FLIPE. Emission spectra and ligand titration curves were obtained by using a monochromator microplate reader (Safire, Tecan, Austria; excitation 433/12 nm; emission 485/12 and 528/12 nm). All analyses were done in 20 mM sodium phosphate buffer, pH 7.0. The Kd of each FLIPE sensor was determined by fitting to a single site binding isotherm: S = (r - rapo)/(rsat - rapo) = [L]/(Kd + [L]), where S is saturation, [L] is ligand concentration, r is ratio, rapo is ratio in the absence of ligand, and rsat is ratio at saturation with ligand. Measurements were performed with at least three independent protein extracts. To determine glutamate concentration in soy sauce (Kikkoman, Noda, Japan), calf serum (Cosmic Calf Serum, HyClone), and PC12 cell lysate, FLIP-E-600n was added to a dilution series of the respective samples, and fluorescence emission spectra were recorded. The Venus/ECFP emission intensity ratio was determined, and the dilution at which the sensor is half-saturated (corresponding to the 630 nM Kd of the sensor) was determined by using a single-site-binding isotherm. For comparison, glutamate oxidase assays were done by using the Amplex Red Glutamate/Glutamate Oxidase Assay Kit (Molecular Probes).
Cell Culture and Transfection. Rat pheochromocytoma PC12 cells were cultured in DMEM media supplemented with 10% equine serum and 5% cosmic calf serum (HyClone). Transfection was performed by using Lipofectamine 2000 (Invitrogen). Rat embryonic hippocampal cells were prepared as described in ref. 16 and transfected by using a modified calcium phosphate transfection protocol (17).
Imaging of Cell Cultures. Rat hippocampal cells and PC12 cells were imaged 24-48 h after transfection in custom-made chambers by using an inverted epifluorescence microscope (DM IRE2, Leica, Leica, Germany) with a cooled CoolSnap HQ digital camera (Photometrics, Tucson, AZ) and a ×63 water immulsion lens (HCX PL APO, Leica, Leica, Germany). Dual emission intensity ratios were simultaneously recorded by using a DualView with an OI-5-EM filter set (Optical Insights, Santa Fe, NM) and metafluor 6.1r1 software (Universal Imaging, Downingtown, PA). Unless stated otherwise, cells were superfused with Tyrode's saline solution (119 mM NaCl/2.5 mM KCl/2 mM CaCl2/2 mM MgCl2/25 mM Hepes/30 mM glucose). For superfusion of hippocampal cells, 10 μM 6-cyano-7-nitroquinoxaline-2,3-dione (CNQX; Tocris Cookson, Ellisville, MO) was added to avoid activation of non-NMDA receptors. For chemical stimulation, hippocampal cells were perfused with excitatory Tyrode's saline solution (32 mM NaCl/90 mM KCl/2 mM CaCl2/2 mM MgCl2/25 mM Hepes/30 mM glucose). For electrical stimulation, current pulses were passed between the electrodes on both ends of the chamber by using a modified Isostim 320 (World Precision Instruments, Sarasota, FL; pulse frequency, 10Hz; applied voltage, 10V/cm). Neurons were superfused with 5 μM FM 4-64 (Molecular Probes) and stimulated electrically for 30 s to accumulate dye in active synapses (18). Imaging experiments were repeated at least three times independently.
Results
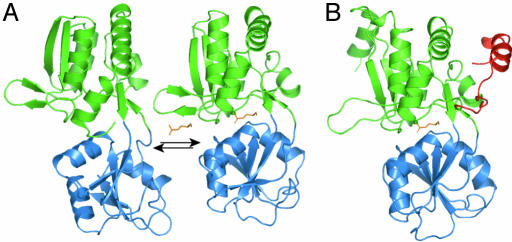
Structural Modeling of ybeJ. Attempts to convert the ligand-binding domain of the metabotropic glutamate receptor mGluR1 into a glutamate nanosensor by fusing the ligand binding domain to cyan FP (CFP) and YFP did not yield sensors that show glutamate-dependent responses (S.O., unpublished data). The E. coli glutamate/aspartate-binding protein ybeJ functions as a high-affinity in vitro glutamate sensor when coupled to environmentally sensitive small fluorophore dyes (13). Therefore, ybeJ was selected for conversion to a genetically encoded nanosensor. The sequence of ybeJ had been aligned with amino acid-binding proteins of known structure (E. coli histidine-binding protein hisJ: PDB ID code 1hsl, 43% similarity; E. coli glutamine-binding protein glnH: PDB ID code 1wdn, 41% similarity) (13), and a prediction of the final processed sequence was made by removal of the presumptive periplasmic leader sequence. This sequence was submitted for an automated structure prediction by using the Robetta server, with glnH structure as a template for backbone construction and threading. The highest-ranking predicted structure is shown in Fig. 1, along with the depiction of the glnH open-to-closed conformational change. The ybeJ sequence used for the construction of the FLIPE sensor has an elongated C-terminal sequence relative to other periplasmic amino acid-binding proteins. The assignment of these 25 amino acids are particularly uncertain. The five highest-scoring models from Robetta predict that the C-terminal extension associates with the N-terminal domain, suggesting that ybeJ is also a type II bacterial PBP protein (19, 20), as are all periplasmic hydrophillic amino acid binding proteins of known structures.
Fig. 1.
Comparison of the predicted structure of E. coli ybeJ with the open (PDB ID code 1ggg) and closed (PDB ID code 1wdn) forms of the glnH glutamine-binding protein from E. coli. (A) Glutamine-binding protein conformational equilibrium. N-terminal domain, green; second domain, blue; glutamine, orange. (B) Highest-scoring model for ybeJ from Robetta. The position of glutamate in the binding pocket is taken to be the same as glutamine in the glnH pocket. N-terminal domain, green; second domain, blue; C-terminal extension, red; glutamate, orange.
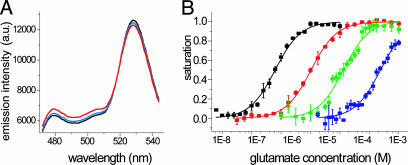
In Vitro Characterization of FLIPE Nanosensors. A DNA fragment encoding the mature ybeJ protein was fused between ECFP and Venus sequences. The chimeric gene was expressed in E. coli and purified through a His-6 tag by using Ni2+ affinity chromatography. Addition of glutamate to purified protein resulted in an increase in CFP emission and a decrease in Venus emission, suggesting that the binding of glutamate to ybeJ results in a conformational change of the chimeric protein (Fig. 2A). Spectra at three different glutamate concentrations (zero, Kd, saturation) show an isosbestic point at 520 nm (Fig. 2A). The Hill coefficient for glutamate is 1.0. The binding constant (Kd) for glutamate was determined to be 600 nM, consistent with results from de Lorimier et al. (13), with a maximum ratio change of 0.27. Binding constants of FLIPE-600n for aspartate, glutamine, and asparagine were determined as 1.0, 100, and 200 μM, respectively (Table 1).
Fig. 2.
Characterization of FLIPE sensors purified from E. coli. (A) Emission spectrum of FLIPE-600n in the absence and presence of glutamate (absence, black; Kd, blue; saturation, red). The addition of glutamate leads to a decrease in the relative Venus/ECFP emission ratio. (B) Glutamate titration curves for FLIPE-600n (black) and affinity mutants FLIPE-10μ (red), FLIPE-100μ (green), and FLIPE-1m (blue). Data are presented as the average of at least three experiments.
Table 1. FLIPE affinity mutants.
|
Kd, M
|
|||||
|---|---|---|---|---|---|
| Name of sensor | Mutation of ybeJ | Glutamate | Aspartate | Glutamine | Asparagine |
| FLIPE-600n | WT | 6 × 10⁻⁷ | 6 × 10⁻⁶ | 1 × 10⁻⁴ | 2 × 10⁻⁴ |
| FLIPE-10μ | A207R | 1 × 10⁻⁵ | 6 × 10⁻⁵ | 1 × 10⁻³ | n.d. |
| FLIPE-100μ | S118W | 1 × 10⁻⁴ | n.d. | n.d. | n.d. |
| FLIPE-1m | A207W | 1 × 10⁻³ | n.d. | n.d. | n.d. |
Binding constants determined in vitro. n.d., not determined.
To expand the dynamic range of the glutamate sensor, the ybeJ domain was mutagenized to create sensors with lower glutamate affinity. It had been shown that conjugation of fluorophores to sites located at the perimeter of the interdomain cleft forming the ligand-binding pocket (“peristeric” sites) may perturb the ligand-binding affinity in periplasmic-binding proteins (13), and mutation of these and nearby positions modulates binding affinity (21). Among the peristeric residues analyzed, mutation of Ala-207 to Arg or Trp decreased binding affinity. Mutation of the endosteric residue Ser-118 to Trp also decreased affinity (Table 1 and Fig. 2B). The FLIPE sensor and the affinity mutants were named FLIPE-600n, FLIPE-10μ, FLIPE-100μ, and FLIPE-1m according to their Kd for glutamate.
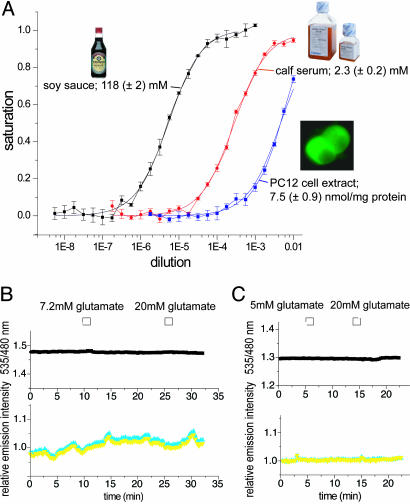
To demonstrate that FLIPE sensors are suitable for measuring glutamate or aspartate in complex solutions, proteins were used to determine glutamate levels in commercially available soy sauce and calf serum as well as PC12 cell extract. The measured concentration was slightly below the value determined by using an enzymatic assay (Fig. 3A and Table 2), likely reflecting FLIPE's response to aspartate and glutamine.
Fig. 3.
In vitro detection of glutamate/aspartate in complex solutions. (A) Glutamate concentration in soy sauce, calf serum, and PC12 cell extract was determined by fitting a single-site binding isotherm. (B and C) Addition of external glutamate did not cause a signal change of FLIPE-10μcytosol (B) or FLIPE-1mcytosol (C) expressed in PC12 cells. B Lower and C Lower represent CFP (cyan) and Venus (yellow) emission intensity expressed relative to time point 0.
Table 2. Glutamate concentration in complex solutions.
| FLIPE-600n | Glutamate oxidase assay | |
|---|---|---|
| Soy sauce, mM | 118 ± 2 | 96.5 ± 1.1 |
| Calf serum, mM | 2.3 ± 0.2 | 1.7 ± 0.2 |
| PC12 cell extract, nmol/mg protein | 7.5 ± 0.9 | 7.1 ± 0.8 |
Assays were performed on samples from the same batch by using FLIPE-600n and a glutamate oxidase assay (n > 3).
In Vivo Characterization of FLIPE. Cytosolic glutamate levels in mammalian cells are predicted to be between 1 and 10 mM (22). To test whether external changes in glutamate levels affect cytosolic steady-state levels, PC12 cells were transformed with FLIPE-100μ and FLIPE-1m, covering a detection range of cytosolic glutamate concentrations between 10 μM and 10 mM. However, perfusion of the cells with glutamate up to concentrations of 20 mM did not lead to FRET changes (>10 cells from three independent transformations), suggesting that the rate of glutamate uptake mediated by EAAC1, GLT-1, and GLAST, three glutamate transporters expressed in PC12 cells (23), is too low relative to the existing steady-state levels and rates of metabolism and compartmentalization to significantly affect cytosolic levels (Fig. 3B). Although the analogous glucose sensor functionally measures glucose levels in various cell types, the data do not exclude the possibility that the function of the sensors is inhibited in the cytosol.
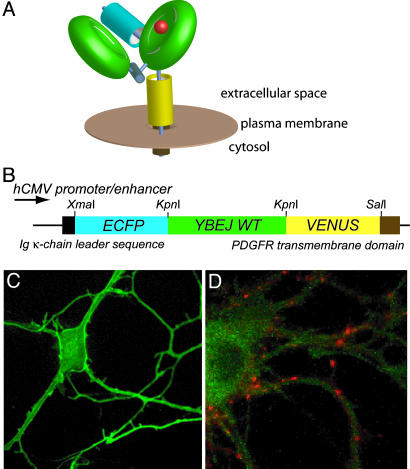
In glutamatergic neurons, glutamate is secreted into the synaptic cleft by fusion of glutamate-containing vesicles to the presynaptic plasma membrane. To detect extracellular glutamate, FLIPE-600n and FLIPE-10μ were cloned into pDisplay. pDisplay carries a leader sequence, directing the protein to the secretory pathway, and a transmembrane domain, which anchors the protein to the extracellular face of the plasma membrane (Fig. 4 A and B). Primary rat hippocampal cells and PC12 cells were transfected with FLIPE-600nsurface and FLIPE-10μsurface constructs, and localization was analyzed by confocal microscopy. Expression of FLIPEsurface was observed on the plasma membrane of rat hippocampal cells and, to a lesser extent, in intracellular compartments (Fig. 4C). After perfusion with Tyrode's buffer containing 1 mg/ml of trypsin, most of the fluorescence was eliminated, thus verifying that FLIPE is displayed at the cell surface (Fig. 5). Synapse formation was confirmed by FM4-64 staining (Fig. 4D).
Fig. 4.
Surface display of FLIPE nanosensors. (A) Model of a FLIPE sensor displayed at the cell surface by using transmembrane spanning domain of the platelet-derived growth factor (PDGF). (B) FLIPEsurface fusion construct consisting of a secretion signal at the N terminus of FLIPE and a C-terminal fusion with the PDGF membrane span. (C) Confocal images of hippocampal neurons expressing FLIPE-600nsurface. Note that the signal is highest at the plasma membrane. (D) A hippocampal cell stained with FM4-64. Synapses stain red.
Fig. 5.
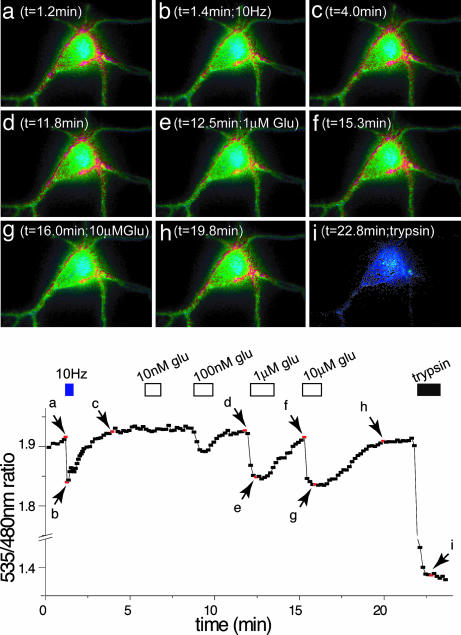
FRET change at the surface of hippocampal neurons expressing FLIPE-600nsurface in response to electrical stimulation. (Upper) Ratiometric images of a hippocampal neuron expressing FLIPE-600nsurface after electrical stimulation and perfusion with varying concentrations of glutamate. (Lower) Corresponding quantification of results from Upper obtained by integration over the entire cell body. Cells were constantly perfused with Tyrode's saline solution at a rate of 0.9 ml/min.
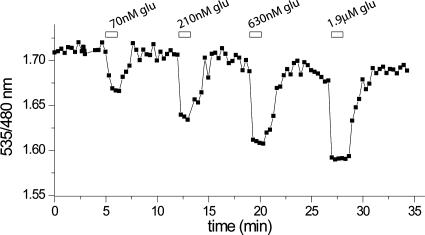
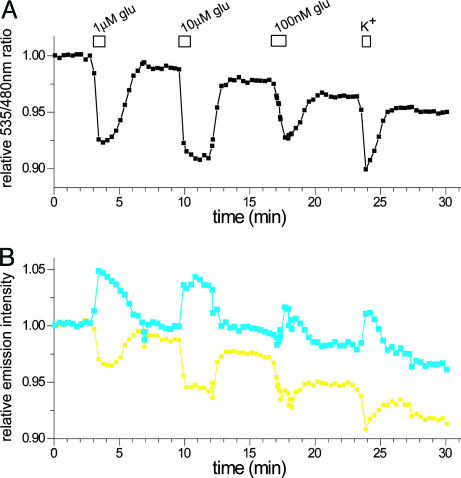
To quantify glutamate, the intensity of CFP and Venus emission was integrated on a pixel-by-pixel basis, and the Venus/CFP ratio was calculated. When hippocampal cells expressing FLIPE-600nsurface were electrically stimulated by a current pulse (Fig. 5) or chemically stimulated by perfusing cells with excitatory Tyrode's saline solution (Fig. 6 and 7), a decrease in the Venus/CFP ratio was observed, suggesting that glutamate is released from hippocampal cells in response to depolarization. To titrate the response to extracellular glutamate, cells were perfused with increasing glutamate concentrations. The emission intensity ratio changed in a concentration-dependent manner (Figs. 5 d-h and 6), indicating that the FLIPE-600nsurface displayed on the cell surface binds extracellular glutamate. In most experiments, YFP emission decreased over the time of the experiment, as observed by using similar sensors in ref. 10. The dynamic response range of the FLIPE-600nsurface sensor is 100 nM-1 μM, similar to that of the sensor in vitro (Fig. 6). The Venus/CFP ratio returned to the initial value when cells were perfused with glutamate-free medium, demonstrating that the change is reversible in vivo.
Fig. 6.
FRET change at the surface of a PC12 cell expressing FLIPE-600nsurface in response to glutamate. The cell was perfused with glutamate concentrations corresponding to 10% (70 nM), 25% (210 nM), 50% (630 nM), 75% (1.9 μM) saturation.
Fig. 7.
FRET change at the surface of hippocampal neurons expressing FLIPE-600nsurface in response to high potassium. (A) Response to external perfusion with glutamate and stimulation with excitory Tyrode's solution (high potassium). (B) Normalized fluorescence intensity traces for CFP (blue) and Venus (yellow). Venus intensity decays over time more rapidly compared with CFP as observed previously with other FRET sensors (10).
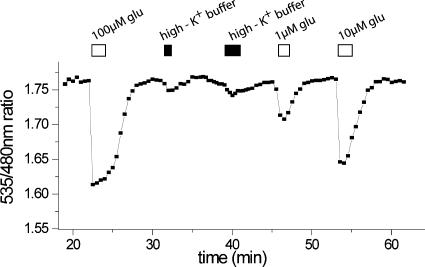
In contrast to cells expressing FLIPE-600nsurface, chemical depolarization lead to a correspondingly smaller Venus/CFP emission intensity change in cells expressing the FLIPE-10μsurface (Fig. 8). Larger ratio changes were observed when cells were perfused with glutamate concentrations saturating the sensor (Fig. 8), consistent with the lower Kd of FLIPE-10μ observed in vitro, suggesting that the glutamate concentration near the surface after depolarization was at the lower end of the dynamic range of FLIPE-10μsurface sensor. Moreover, this experiment demonstrates that the ratio changes observed are due to glutamate (or aspartate) secretion.
Fig. 8.
FRET change at the surface of hippocampal neurons expressing FLIPE-10μsurface in response to high potassium. Cells were superfused with Tyrode's saline solution, and at given time points, glutamate or high K+ buffer was added.
Discussion
To monitor glutamate by using an optical sensor, a bacterial glutamate-binding protein was converted into a nanosensor by attaching an FP variant to each terminus of the mature ybeJ protein. The purified sensor shows a maximal ratio change of 0.27 upon addition of glutamate, with an apparent affinity of 630 nM, similar to the value of 800 nM obtained for the unmodified wild-type protein (24). The FLIPE sensor detects glutamate but also aspartate with 10-fold lower affinity and glutamine with 100-fold lower affinity. Affinity mutants were generated for in vivo measurements, covering a range of glutamate from nanomolar to millimolar. The sensors can be used for in vitro analysis of amino acid levels in complex solutions and in cell extracts.
This set of glutamate sensors should be suitable for monitoring glutamate transport and metabolism as reported for glucose detection by using an analogous FLIPglu in COS-7 cells in ref. 10. FLIPE sensors expressed in the cytosol of PC12 cells did not show a signal change upon perfusion with glutamate up to 20 mM. Provided the sensor function is not inhibited in vivo, this finding suggests that cytosolic steady-state glutamate levels are primarily determined by metabolic conversion rather than uptake rates. Cytosolic concentrations in neurons are assumed to be 1-10 mM, consistent with the Kd of vesicular glutamate transport measured between 0.3 and 2 mM (25, 26). PC12 cells express several high-affinity glutamate uptake systems; however, these systems appear to have insufficient capacity to significantly affect intracellular levels.
A major advantage of genetically encoded nanosensors is the ability to target the proteins to subcellular compartments, as demonstrated for FLIPglu in nuclei (27). To measure glutamate secretion, we tested whether FLIPE sensors can be targeted efficiently to the surface of neuronal cells. A surface-displayed sensor would enable direct measurement of neurotransmitter release in living cells or organisms, which otherwise requires complicated technologies. FLIPE was thus targeted to the cell surface by using a secretion signal at the N terminus and a transmembrane anchor sequence at the C terminus. A significant fraction of FLIPEsurface was found at the surface of the neuronal cells by confocal imaging and as confirmed by trypsin sensitivity. The magnitude of the response to perfusion with different glutamate concentrations is consistent with the corresponding in vitro affinities of FLIPE-600n and FLIPE-10μ. Stimulation of hippocampal neurons with high potassium concentrations and by electrical pulses also leads to a FRET response, consistent with accumulation of glutamate to concentrations of ≈300 nM at the surface of neurons. This value probably does not accurately reflect the concentration in a synaptic cleft in vivo because of differences in cell culture and intact organisms. Synapses in live tissue are surrounded by glial cells, which limit effective synaptic volume and enzymatically clear the glutamate from the synapse by uptake and conversion to glutamine (28). Thus glutamate pulses are concentrated and short-lived (29). The cell culture contains a low number of glia, leaving synaptic clefts more exposed to perfusion by bulk solvent. This result may explain the lower glutamate pulse concentration observed in culture and the slow recovery after depolarization had been discontinued.
The contribution of aspartate to the response is probably low, because the affinity of FLIPE-600n is 10-fold lower, and the aspartate levels detected in rat thalamus are ≈5-fold lower than the corresponding glutamate concentrations (30).
The kinetics of both association and dissociation are expected to be rapid for glutamate binding to FLIPE; thus, the signal observed is likely to accurately reflect current concentrations. Kinetic measurements on glutamine- and histidine-binding proteins of E. coli suggest a value of kon ≈108 M-1s-1 for the association of glutamate and FLIPE protein (31). Ligand binding affinity of the periplasmic binding proteins is typically off-rate limited; the value of koff for the FLIPE sensors examined here is expected to be ≈101 to 105 s-1 (31). The rapid ligand association and dissociation should permit analysis of the transient (≈1 ms), high-concentration (>1 mM) pulses of glutamate predicted for synaptic transmission (29).
In contrast to the findings in hippocampal neurons, pheochromocytoma PC12 cells showed no response to electrical and excitatory Tyrode's saline solution treatment. This finding was not unexpected because PC12 cells have a low capacity to secrete glutamate, mainly due to the low vesicular glutamate transport activity in these cells (32, 33).
A confocal FRET imaging system with faster acquisition rates and higher resolution, in combination with restricted expression of FLIPE-600nsurface at synapses, should allow for analysis of glutamate concentrations at individual synapses. Furthermore, it will be interesting to compare the results obtained here to data obtained in cocultures with glia or to analyze FRET changes in slices or living organisms to study spillover (10), the effect of drugs, and the role of dendritic reuptake in long-term potentiation (34).
Allosteric Signal Transduction Mechanism in FLIPE Nanosensors. Fluorescent indicator protein (FLIP) nanosensors have thus far been developed by using type I periplasmic binding proteins (9-12, 19), with fluorophores attached to the N- and C-termini of the recognition element present on the two different lobes. The FPs attached to the different lobes are expected to undergo a significant relative rearrangement in concert with the conformational movement. The sign of the change in FRET efficiency for each existing sensor was consistent with the change in interfluorophore distance predicted from the crystal structure (9-12, 35), demonstrating the importance of donor-acceptor separation in transfer efficiency. Interestingly, however, the magnitude of the FRET change of the various FLIP sensors is constant despite different absolute distance changes of the termini, suggesting that rotational averaging serves to dampen the distance effect and to change the value of the orientation factor κ2 (36).
Periplasmic hydrophillic amino acid-binding proteins of known structure have been classified as type II periplasmic binding proteins (19, 20) with N- and C-termini located on the same protein lobe. The structures of histidine-, glutamine-, and lysine/arginine/ornithine-binding proteins have been solved in both the open and closed states with little change in the relative position of the termini during ligand binding (37, 38). The modeled structures of ybeJ also suggest a type II configuration, although the assignment of the C-terminal region is uncertain. Modeling of the entire FLIPE construct, however, suggests that the Venus domain fused to the C terminus of ybeJ will be allosterically regulated by the domain closure. In the open state, the Venus domain is modeled to be sterically hindered by the second ybeJ lobe, resulting in a displacement toward the ECFP domain and a reduction in conformational flexibility. Upon domain closure, this steric hindrance is relieved, and the Venus domain is modeled to relax away from the ECFP, with an increase in conformational averaging. This predicted motion of the Venus domain relative to the ECFP domain, and the resulting change in donor-acceptor separation and rotation, is consistent with the observed decrease in transfer efficiency upon ligand binding. It thus appears that both direct and indirect allosteric effects may give rise to functioning fluorescent allosteric signal transduction mechanisms (39).
Conclusions
The ybeJ protein was converted successfully into a genetically encoded glutamate sensor. Site-directed mutagenesis permitted the generation of affinity mutants covering a wide range of physiologically relevant glutamate concentrations. The sensors were used to measure glutamate secretion from cultured cells in real time. For certain in vivo measurements, e.g., determination of cytosolic changes, it may be desirable to engineer the sensors to further increase the signal, perhaps by modifying the linker domains or by insertion of the fluorophores into the binding protein sequence (S.O. and W.B.F., unpublished data). The glutamate sensors will be useful for a wide range of applications, to study, e.g., glial glutamate uptake and release, amino acid uptake and release from plant cells to identify the efflux mechanisms, or the role of plant glutamate receptor analogs (40). Furthermore, transgenic organisms expressing FLIPE can be used to detect neuronal activity directly in organ slices or whole organism, as demonstrated for the calcium FRET, indicator in Caenorhabditis elegans neurons (41).
Acknowledgments
We thank David Ehrhardt (Carnegie Institution of Washington) for his invaluable help with imaging and data analysis. This work was made possible by National Institutes of Health Roadmap Initiative Metabolomics Technology Development Grant R33DK070272 (to W.B.F.), National Institutes of Health Grants K02 NS045634 and 3P50 NS012151 (to R.J.R.), Human Frontier Science Program Grant RGP0041/2004C (to W.B.F.), and Department of Energy Grant DE-FG02-04ER15542 (to W.B.F.).
Author contributions: S.O., L.L.L., R.J.R., and W.B.F. designed research; S.O. performed research; S.O., K.D.M., R.J.R., and S.J.S. contributed new reagents/analytic tools; S.O., L.L.L., R.J.R., S.J.S., and W.B.F. analyzed data; and S.O., L.L.L., R.J.R., and W.B.F. wrote the paper.
Abbreviations: FLIPE, fluorescent indicator protein for glutamate; FP, fluorescent protein, CFP, cyan FP; ECFP, enhanced cyan FP; YFP, yellow FP.
References
- 1.Cotman, C. W. & Monaghan, D. T. (1986) Adv. Exp. Med. Biol. 203, 237-252. [DOI] [PubMed] [Google Scholar]
- 2.Kandel, E. R. (2001) Science 294, 1030-1038. [DOI] [PubMed] [Google Scholar]
- 3.Rothstein, J. D. (1996) Neurol 47, S19-S26. [Google Scholar]
- 4.Burger, P. M., Mehl, E., Cameron, P. L., Maycox, P. R., Baumert, M., Lottspeich, F., De Camilli, P. & Jahn, R. (1989) Neuron 3, 715-720. [DOI] [PubMed] [Google Scholar]
- 5.Faden, A. I., Demediuk, P., Panter, S. S. & Vink, R. (1989) Science 244, 798-800. [DOI] [PubMed] [Google Scholar]
- 6.Fallgren, A. B. & Paulsen, R. E. (1996) Neurochem. Res. 21, 19-25. [DOI] [PubMed] [Google Scholar]
- 7.Miyawaki, A., Llopis, J., Heim, R., McCaffery, J. M., Adams, J. A., Ikura, M. & Tsien, R. Y. (1997) Nature 388, 882-887. [DOI] [PubMed] [Google Scholar]
- 8.Romoser, V. A., Hinkle, P. M. & Persechini, A. (1997) J. Biol. Chem. 272, 13270-13274. [DOI] [PubMed] [Google Scholar]
- 9.Fehr, M., Frommer, W. B. & Lalonde, S. (2002) Proc. Natl. Acad. Sci. USA 99, 9846-9851. [DOI] [PMC free article] [PubMed] [Google Scholar]
- 10.Fehr, M., Lalonde, S., Lager, I., Wolff, M. W. & Frommer, W. B. (2003) J. Biol. Chem. 278, 19127-19133. [DOI] [PubMed] [Google Scholar]
- 11.Lager, I., Fehr, M., Frommer, W. B. & Lalonde, S. (2003) FEBS Lett. 553, 85-89. [DOI] [PubMed] [Google Scholar]
- 12.Fehr, M., Okumoto, S., Deuschle, K., Lager, I., Looger, L. L., Persson, J., Kozhukh, L., Lalonde, S. & Frommer, W. B. (2005) Biochem. Soc. Trans. 33, 287-290. [DOI] [PubMed] [Google Scholar]
- 13.de Lorimier, R. M., Smith, J. J., Dwyer, M. A., Looger, L. L., Sali, K. M., Paavola, C. D., Rizk, S. S., Sadigov, S., Conrad, D. W., Loew, L. & Hellinga, H. W. (2002) Protein Sci. 11, 2655-2675. [DOI] [PMC free article] [PubMed] [Google Scholar]
- 14.Nagai, T., Ibata, K., Park, E. S., Kubota, M., Mikoshiba, K. & Miyawaki, A. (2002) Nat. Biotechnol. 20, 87-90. [DOI] [PubMed] [Google Scholar]
- 15.Kunkel, T. A., Roberts, J. D. & Zakour, R. A. (1987) Methods Enzymol. 154, 367-382. [DOI] [PubMed] [Google Scholar]
- 16.Goslin, K., Amussen, H. & Banker, K. (1998) in Culturing Nerve Cells, eds. Goslin, K. & Banker, G. (MIT Press, Cambridge MA.), pp. 339-370.
- 17.Xia, Z., Dudek, H., Miranti, C. K. & Greenberg, M. E. (1996) J. Neurosci. 16, 5425-5436. [DOI] [PMC free article] [PubMed] [Google Scholar]
- 18.Micheva, K. D., Holz, R. W. & Smith, S. J. (2001) J. Cell Biol. 154, 355-368. [DOI] [PMC free article] [PubMed] [Google Scholar]
- 19.Tam, R. & Saier, M. H., Jr. (1993) Microbiol. Rev. 57, 320-346. [DOI] [PMC free article] [PubMed] [Google Scholar]
- 20.Fukami-Kobayashi, K., Tateno, Y. & Nishikawa, K. (1999) J. Mol. Biol. 286, 279-290. [DOI] [PubMed] [Google Scholar]
- 21.Marvin, J. S. & Hellinga, H. W. (2001) Nat. Struct. Biol. 8, 795-798. [DOI] [PubMed] [Google Scholar]
- 22.McMahon, H. T. & Nicholls, D. G. (1991) Biochim. Biophys. Acta 1059, 243-264. [DOI] [PubMed] [Google Scholar]
- 23.Kobayashi, S. & Millhorn, D. E. (2001) J. Neurochem. 76, 1935-1948. [DOI] [PubMed] [Google Scholar]
- 24.Willis, R. C. & Furlong, C. E. (1975) J. Biol. Chem. 250, 2574-2580. [PubMed] [Google Scholar]
- 25.Maycox, P. R., Deckwerth, T., Hell, J. W. & Jahn, R. (1988) J. Biol. Chem. 263, 15423-15428. [PubMed] [Google Scholar]
- 26.Carlson, M. D., Kish, P. E. & Ueda, T. (1989) J. Biol. Chem. 264, 7369-7376. [PubMed] [Google Scholar]
- 27.Fehr, M., Lalonde, S., Ehrhardt, D. W. & Frommer, W. B. (2004) J. Fluoresc. 14, 603-609. [DOI] [PubMed] [Google Scholar]
- 28.Marcaggi, P. & Attwell, D. (2004) Glia 47, 217-225. [DOI] [PubMed] [Google Scholar]
- 29.von Gersdorff, H., Sakaba, T., Berglund, K. & Tachibana, M. (1998) Neuron 21, 1177-1188. [DOI] [PubMed] [Google Scholar]
- 30.Parrot, S., Sauvinet, V., Riban, V., Depaulis, A., Renaud, B. & Denoroy, L. (2004) J. Neurosci. Methods 140, 29-38. [DOI] [PubMed] [Google Scholar]
- 31.Miller, D. M., 3rd, Olson, J. S., Pflugrath, J. W. & Quiocho, F. A. (1983) J. Biol. Chem. 258, 13665-13672. [PubMed] [Google Scholar]
- 32.Fremeau, R. T., Jr., Troyer, M. D., Pahner, I., Nygaard, G. O., Tran, C. H., Reimer, R. J., Bellocchio, E. E., Fortin, D., Storm-Mathisen, J. & Edwards, R. H. (2001) Neuron 31, 247-260. [DOI] [PubMed] [Google Scholar]
- 33.Lehre, K. P. & Danbolt, N. C. (1998) J. Neurosci. 18, 8751-8757. [DOI] [PMC free article] [PubMed] [Google Scholar]
- 34.Levenson, J., Weeber, E., Selcher, J. C., Kategaya, L. S., Sweatt, J. D. & Eskin, A. (2002) Nat. Neurosci. 5, 155-161. [DOI] [PubMed] [Google Scholar]
- 35.Shilton, B. H., Flocco, M. M., Nilsson, M. & Mowbray, S. L. (1996) J. Mol. Biol. 264, 350-363. [DOI] [PubMed] [Google Scholar]
- 36.Jares-Erijman, E. A. & Jovin, T. M. (2003) Nat. Biotechnol. 21, 1387-1395. [DOI] [PubMed] [Google Scholar]
- 37.Quiocho, F. A. & Ledvina, P. S. (1996) Mol. Microbiol. 20, 17-25. [DOI] [PubMed] [Google Scholar]
- 38.Mowbray, S. L. & Bjorkman, A. J. (1999) J. Mol. Biol. 294, 487-499. [DOI] [PubMed] [Google Scholar]
- 39.Hellinga, H. W. & Marvin, J. S. (1998) Trends Biotechnol. 16, 183-189. [DOI] [PubMed] [Google Scholar]
- 40.Wipf, D., Ludewig, U., Tegeder, M., Rentsch, D., Koch, W. & Frommer, W. B. (2002) Trends Biochem. Sci. 27, 139-147. [DOI] [PubMed] [Google Scholar]
- 41.Kerr, R., Lev-Ram, V., Baird, G., Vincent, P., Tsien, R. Y. & Schafer, W. R. (2000) Neuron 26, 583-594. [DOI] [PubMed] [Google Scholar]


