Abstract
We studied the distribution of human immunodeficiency virus type 1 (HIV-1) DNA in CCR5-positive and -negative peripheral blood lymphocyte populations in HIV-1-infected individuals. While HIV-1 DNA in the CCR5-positive population showed no correlation with CD4 count, the increase of total HIV-1 DNA with lower CD4 count was mainly contributed by the increase of HIV-1 DNA in the CCR5-negative population. This might indicate the change in coreceptor usage from CCR5 to CXCR4 in later stages of disease progression. However, some of the samples with a high viral DNA load in the CCR5-negative population did not have any characteristic of the V3 loop sequence that is compatible with CXCR4 usage or the syncytium-inducing (SI) phenotype. We also did not find any known characteristic change predictive of the SI phenotype in V1 and V2 sequences. Our findings showed that there might be a shift in target cell populations during disease progression, and this shift was not necessarily associated with the genetic changes characteristic of CXCR4 usage.
Human immunodeficiency virus type 1 (HIV-1) isolates from asymptomatic individuals at earlier stages of infection are usually found to be macrophage-tropic and nonsyncytium inducing (NSI) and to use only CCR5 as a coreceptor (R5 isolates). In contrast, viral isolates from AIDS patients can be T-cell line-tropic and syncytium inducing (SI) and to use either both CCR5 and CXCR4 (R5X4 isolates) or only CXCR4 (X4 isolates) (10, 11, 15, 17). The major genetic determinant of cell tropism and chemokine receptor usage lies in the V3 loop; minor determinants were also described in V1 and V2 (3, 7, 8, 18). The appearance of SI viruses is associated with a more rapid CD4 count decline and disease progression (10, 11). The chemokine receptors CCR5 and CXCR4 are differentially expressed on different subsets of CD4+ T cells. CCR5 is expressed on activated T cells and a subset of memory T cells (2). CXCR4 is expressed mainly on naive cells, which are the cells that have not yet encountered antigen and therefore are resting cells (14). Resting cells were shown to be refractive to HIV-1 infection, and naive cells have been shown to be less susceptible to productive HIV infection even after activation of the cells (5, 16). We have shown earlier that CXCR4-expressing cells become more activated in later stages of disease progression and therefore might be more susceptible to HIV infection (1). These data imply that there should be a shift in the target cell population from CCR5+ cells to CXCR4+ cells with the viral phenotypic switching and the disease progression. The distribution of HIV infection in T-cell subsets with different chemokine receptors in vivo, however, has not been studied. Whether this distribution is influenced by the viral chemokine receptor usage and disease progression has not been shown. A recent study showed that naive cells were also infected with CCR5-using viruses (13). This raised a question as to whether our current understanding of the viral chemokine receptor usage and the chemokine receptor expression in T-cell subsets is accurate in an in vivo situation.
We analyzed cross-sectionally the viral DNA content in CCR5-positive and -negative peripheral lymphocyte populations to study the viral DNA distribution and to examine the influence of CD4 count and the viral chemokine receptor usage as determined by V3 signature sequences and on the viral DNA distribution.
MATERIALS AND METHODS
Blood specimens and cell separation.
Blood samples were collected from 30 HIV-1-infected patients at the HIV Clinic of Siriraj Hospital. Patients were arbitrarily selected to include both asymptomatic and symptomatic infections. All patients were not treated with any antiretroviral drug at the time of specimen collection. Ten milliliters of venous blood was collected from each subject and processed for cell separation within 3 h. CD4 count was performed on whole blood specimens. Peripheral blood mononuclear cells (PBMC) were separated from the blood specimens by centrifugation on Ficoll cushion. The cells were washed and resuspended in RPMI 1640 medium with 10% fetal calf serum (FCS), and monocytes were depleted by plastic adherence overnight. The nonadherent cells were further separated into CCR5-positive and -negative populations by using MACS (Miltenyi Biotech) immunomagnetic beads and a CCR5 monoclonal antibody (2D7). The separation was done according to the manufacturer's instructions in two repetitive cycles in order to get maximum purity. The unseparated and separated cell populations were analyzed by using a flow cytometer using CD4, CD14, and CCR5 monoclonal antibodies to determine CD4 percentage and assess the purity of each separated population.
To verify the purity of our separated cell preparation, we analyzed the mRNA expression in each cell fraction by reverse transcription-PCR (RT-PCR). The RNA extracted by using TRIzol reagent (Gibco-BRL) was heated at 68°C for 5 min, chilled on ice, and subjected to the RT reaction in a 50-μl volume containing 5 μg of random hexamer, 1× PCR buffer (10 mM Tris-Cl, 50 mM KCl, 0.1% Triton X-100), 1.5 mM MgCl2, 200 μM concentrations of deoxynucleoside triphosphates (dNTPs), 10 U of RNase inhibitor, and 9 U of avian myeloblastosis virus-reverse transcriptase at 45°C for 1 h. Then, 15 μl Fifteen microliter of the RT reaction was amplified in a PCR reaction as previously described, using primers CCR5c (CAAAAAGAAGGTCTTCATTACACC) and CCR5d (CCTGTGCCTCTTCTTCTCATTTCG) (9). The PCR reaction mixture contained 1× PCR buffer, 1.5 mM MgCl2, 200 μM concentrations of the dNTPs, 20 pmol of each primer, and 2.5 U of Taq. The amplification consisted of 40 cycles, with 5 initial cycles of 94°C for 1 min, 55°C for 1 min, and 72°C for 1.5 min, followed by 35 cycles of 94°C for 30 s, 60°C for 30 s, and 72°C for 45 s. The PCR products were visualized after electrophoresis in 2% agarose gel and ethidium bromide staining.
Quantitative PCR.
A gag competitive quantitative nested PCR was done using a competitor with an internal 18-bp deletion. The competitor was made in two steps. First, a shorter competitor of 97 bp with an 18-bp deletion was made in a PCR reaction using the primers SK38, SK39, and SK38-delta, which carried the deletion, as described previously (12). This competitor can be used in one-step competitive PCR. In order to increase the sensitivity, we designed another competitor that can be used in nested PCR by extending the competitor in overlapping extension reactions using the shorter competitor and SK380 and SK390 (19) as primers.
To quantitate HIV DNA, unsorted and sorted cells were lysed and DNA was purified using QIA-Amp Blood Kit (Qiagen). DNA equivalent of 1.5 × 10⁵ cells was amplified by nested PCR, together with a serial dilution of the competitor. SK380 and SK390 were used in the first-round PCR, and SK38 and SK39 were used in the second-round PCR. The PCR was done in a total volume of 50 μl containing 1× PCR buffer, 1.5 mM MgCl2, 200 μM concentrations of the dNTPs, 20 pmol of each primer, and 2.5 U of Taq. The amplification cycles were 95°C for 1 min, 60°C for 1 min, and 72°C for 1 min, with 35 cycles for the first round and 95°C for 1 min, 55°C for 1 min, and 72°C for 1 min and 35 cycles for the second round. The PCR products were visualized after electrophoresis in 10% polyacrylamide and ethidium bromide staining. The PCR product bands were photographed with a digital camera, and the area under the curve for each band was calculated using Gel-Pro software. The area of competitor bands was adjusted for its lower molecular weight. The ratios between wild-type and competitor PCR products were plotted against the copy numbers of competitor, and the copy number of wild-type DNA was extrapolated from the curve where the ratio = 1. The HIV DNA content in each cell fraction was then calculated, with adjustment for contaminated cells seen in flow cytometric analysis, by solving these two equations: (i) αX + βY = the measured HIV DNA load in the CCR5+ fraction and (ii) γX + δY = the measured HIV DNA load in the CCR5− fraction, where X is the adjusted HIV DNA load in the CD4+ CCR5+ fraction, Y is the adjusted HIV DNA load in the CD4+ CCR5− fraction, α is the number of CD4+ CCR5+ cells in the CCR5+ fraction, β is the number of CD4+ CCR5− cells in the CCR5+ fraction, γ is the number of CD4+ CCR5+ cells in the CCR5− fraction, and δ is the number of CD4+ CCR5− cells in the CCR5− fraction.
To quantitate HIV RNA, unsorted and sorted cells were lysed and RNA was extracted using TRIzol reagent (Gibco-BRL). An RNA equivalent of 1.5 × 10⁵ cells was amplified by a competitive RT-PCR. The above-mentioned DNA competitor was cloned into pGEM-T Easy (Promega), and RNA competitor was made by an in vitro transcription reaction by using T-7 RNA polymerase. The RT reaction contained 1× Tth RT-PCR buffer (Boehringer Mannheim), 2.5 mM MnCl2, 200 μM concentrations of dNTPs, 20 pmol of SK390 primer, 2.5 U of Tth DNA polymerase (Boehringer Mannheim), and a serial dilution of RNA competitor. The reaction was incubated at 60°C for 20 min and chilled on ice, and then 20 pmol of SK380 primer was added together with MgCl2 and 10× chelating buffer (Boehringer Mannheim) to obtain final concentrations of 2 mM and 1×, respectively. The reaction was then heated at 94°C for 5 min and to 60°C for 20 min. The cDNA product was then further amplified by the same nested PCR as that used for DNA quantitation.
Sequence analysis.
C2-V3 fragments were amplified from unsorted cells by a nested PCR using AI1 (ACTATGGGGTTCCTGTGTG) and AI2 (CCTCCTCCAGGTCTGAA) as outer primers and CI1 (GGCAGTCTAGCAGAAGAAAAGATAATAATCAGA) and BI2 (ATCTCCTCCTGATGGTGGCTGAA) as inner primers. V1-V5 fragments were amplified for V1V2 sequencing in some samples using envB (AGAAAGAGAAGAAGACAGTGGAAATGA) and AO2 (AGGTGAGTATCCCTG) as outer primers and AI1 and AI2 as inner primers. The V1V2 and V3 regions of the PCR products were then sequenced directly by using V1 (CAGATGCAGGAGGATGTAATCAGT) and CI1 (GGCAGTCTAGCAGAAGAAAAGATAATAATCAGA), respectively, as sequencing primers. The sequencing reactions were dideoxy-termination cycle sequencing using a BigDye Terminator kit (PE/Applied Biosystems) according to the manufacturer's protocol and an ABI Prism 310 automated sequencer. Selected samples were cloned into pGEM-T Easy (Promega) after PCR amplification, and then 10 clones from each sample were sequenced.
RESULTS
Distribution of HIV-1 DNA in CCR5-positive and -negative lymphocyte subsets.
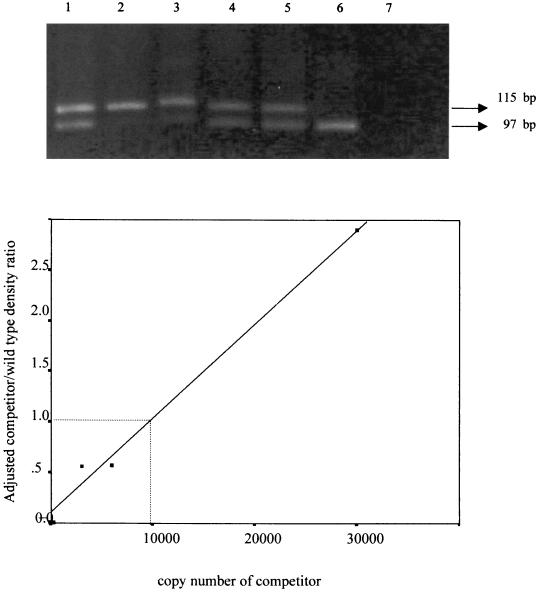
To verify the accuracy of the quantitative PCR, we measured the HIV DNA content in 8E5 cells, which harbor one copy of HIV-1 proviral DNA per cell. When 10,000 cells representing 10,000 copies of HIV DNA were analyzed, the result of our quantitative PCR measurement was 9,950 copies (Fig. 1).
FIG. 1.
Verification of the quantitative HIV-DNA PCR. (A) A total of 104 copies of HIV DNA in 8E5 cells were coamplified with 300, 1,500, 3,000, 6,000, or 30,000 copies of the competitor as shown in lanes 2 to 6, respectively. Lane 1 is the marker containing both wild-type (115 bp) and competitor (97 bp) amplicons, and lane 7 is blank. (B) Ratios of adjusted density of the competitor and wild-type bands plotted against the copy number of the competitor.
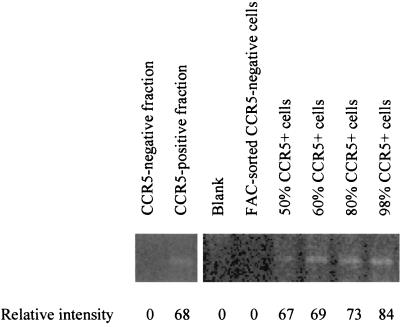
Lymphocyte subsets were separated from 30 individuals who presented at various disease stages, as shown by their CD4 count range of 4 to 728 cells/mm3. The percentages of CCR5-positive cells in our purified cell preparations were 96.2% ± 1.7% (mean ± The standard deviation) and 12.8% ± 3.1% for CCR5-positive and CCR5-negative fractions, respectively. Minimal CD14+ monocytes were found in the presorted nonadherent cells (1.4% ± 1%). To ensure that the contaminated monocytes did not contain significant amount of HIV DNA that could interfere with our result, we measured HIV DNA in 15 adherent cell samples and found that 9 of 15 cases were negative and the other 6 cases had fewer than 25 copies of HIV DNA in 104 adherent cells. Because there was a possibility that CCR5 molecules on the cell surface might have been lost during the cell separation process, we analyzed CCR5 mRNA expression of the cell preparations by RT-PCR in six sample sets. A set of representative results is shown in Fig. 2. RNA from 200,000 cells of a CCR5-negative cell preparation was negative for CCR5 RNA, while RNA from a CCR5-positive fraction was positive for CCR5 RNA. When compared to the standard curve using highly purified CCR5-positive and -negative cells by fluorescence-activated cell sorting (FACS), the intensity of the bands correlated with the number of CCR5-positive cells in the fractions. These data confirmed that we had correctly separated CCR5-positive and -negative cells.
FIG. 2.
Representative CCR5 RNA analysis by RT-PCR showing the purity of the cell preparations. The size of the amplification products is 189 bp. Lanes 1 and 2 show amplification from 200,000 cells of a CCR5-negative cell preparation and 60,000 cells of a CCR5-positive preparation, respectively. CCR5-positive (98% purity) and -negative (96% purity) cells highly purified by FACS were mixed to make cell preparations with various percentages of CCR5-positive cells in lanes 4 to 8. RNA from 100,000 cells was analyzed in each of these control lanes. The numbers below the lane are intensities of the bands calculated using Gel-Pro software.
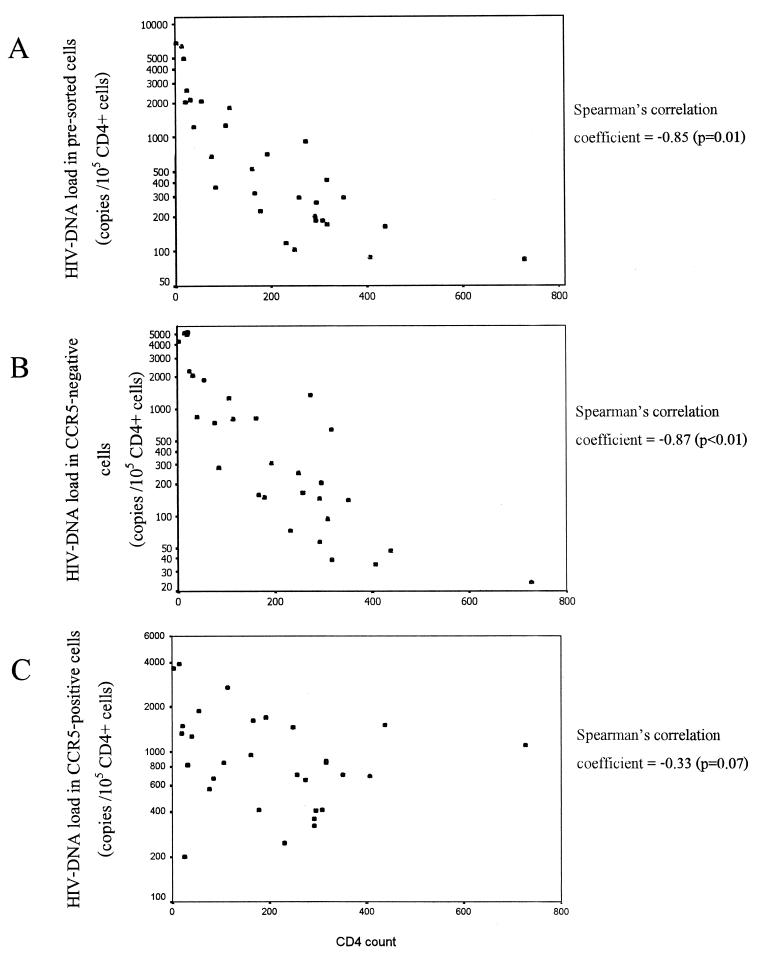
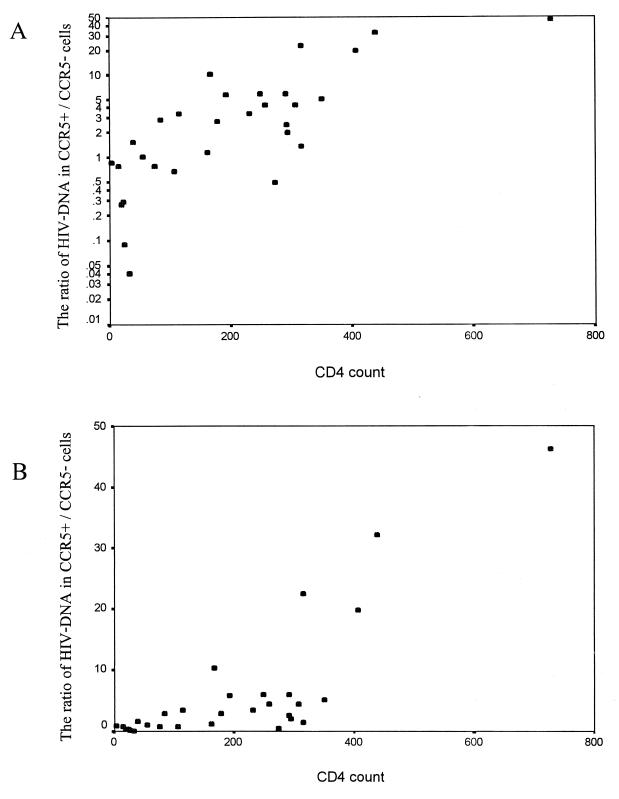
The HIV DNA load ranged from 85 to 6,734, 24 to 5,089, and 201 to 3,921 copies/105 CD4+ cells in unsorted nonadherent cells, CCR5-negative lymphocytes, and CCR5-positive lymphocytes, respectively. The variances of DNA load in unsorted and CCR5-negative cells were significantly higher than that of the CCR5-positive cells (F = 3.81 and 3.12, respectively; P < 0.01). The total HIV DNA load in unsorted cells and in the CCR5-negative population, but not the DNA load in the CCR5-positive population, showed a reverse correlation with the CD4 count (Fig. 3). The ratio of viral DNA between CCR5-positive and -negative cells ranged from 0.09 to 46.25 and correlated with the CD4 count (Pearson's correlation coefficient of 0.79, P < 0.01) (Fig. 4). At higher CD4 counts (>400 cells/mm3), CCR5-positive cells had a mean of 33-fold-higher HIV-1 DNA level than CCR5-negative cells. The ratio decreased sharply when the CD4 counts were <300 cells/mm3. The ratio was mostly still higher than 1 (3.3 ± 2.6) when the CD4 counts were moderately low (50 to 300 cells/mm3). At extremely low CD4 counts (<50 cells/mm3), the ratio was mostly <1 (0.09 to 1.51), and the CCR5-negative cells had a mean of 1.7-fold-higher HIV DNA level than the CCR5-positive cells.
FIG. 3.
Scatter plots showing the correlation between CD4 count and total HIV DNA load (in log scale) in presorted non adherent cells (A), HIV DNA load in a CCR5-negative population (B), and HIV DNA load in a CCR5-positive population (C). Nonadherent cells were separated into CCR5-positive and -negative populations by immunomagnetic separation, and the HIV DNA content was measured by a gag quantitative competitive PCR.
FIG. 4.
Scatter plot showing correlation between CD4 count and the ratio of the HIV DNA in a CCR5-positive to the HIV DNA in a CCR5-negative population in log scale (A) and in linear scale (B). The HIV DNA content was measured by a gag competitive PCR in the two subpopulations, which were separated by the immunomagnetic technique.
Because HIV DNA in the cells could be either active replicating or silent proviral DNA, the number of total HIV DNA in cells did not necessarily reflect the level of viral replication. To test whether there was any difference in the proportion of active replicating proviral DNA in CCR5-positive and -negative cells, we analyzed HIV RNA in separated cell fractions from six blood samples. Although the HIV RNA/HIV DNA ratio varied among blood samples, we found no difference in the ratio between CCR5-positive and -negative cells (Table 1).
TABLE 1.
HIV-1 DNA and RNA loads and the RNA/DNA ratio in CCR5-positive and -negative cells
| Sample | CD4 count (cells/mm3) | HIV-1 load (copies/105 CD4+ cells)
|
RNA/DNA ratio
|
||||
|---|---|---|---|---|---|---|---|
| CCR5 positive
|
CCR5 negative
|
CCR5 positive | CCR5 negative | ||||
| DNA | RNA | DNA | RNA | ||||
| 1 | 803 | 161 | 3,160 | 17 | 402 | 19.6 | 23.6 |
| 2 | 541 | 149 | 2,285 | 33 | 653 | 15.3 | 19.8 |
| 3 | 270 | 100 | 7,547 | 658 | 11,247 | 75.5 | 17.1 |
| 4 | 256 | 188 | 1,491 | 75 | 561 | 7.9 | 7.5 |
| 5 | 112 | 185 | 1,069 | 283 | 689 | 5.8 | 2.4 |
| 6 | 9 | 3,610 | 53,802 | 4,490 | 82,406 | 14.9 | 18.4 |
Sequences that are predictive of chemokine receptor usage.
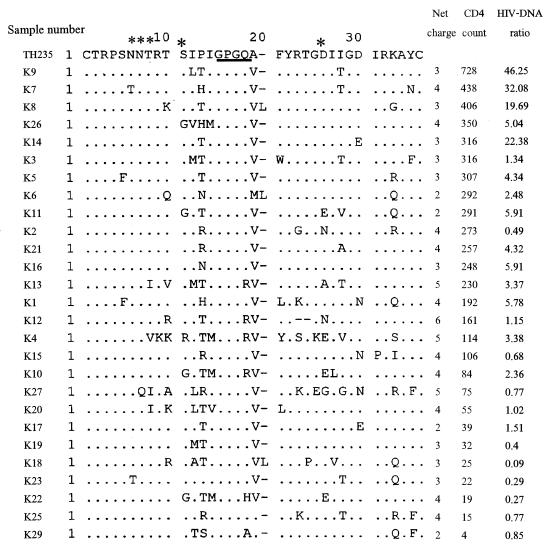
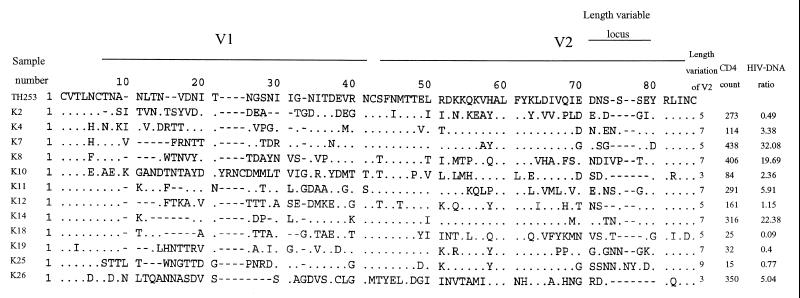
The decrease in the HIV DNA ratio in CCR5+ compared to CCR5− cells in individuals with a low CD4 count suggested that there was an expansion of the target cell population to CCR5-negative cells that express CXCR4 or other chemokine receptors during disease progression. This expansion of the target cell population might be driven by the viral phenotypic switching from the NSI R5 phenotype to the SI R5X4 or X4 phenotype. Earlier data showed that only Ca. 50% of HIV isolates from AIDS patients had the SI phenotype (17). In contrast, our data showed that there was a shift in the target cell population in all of the samples with a low CD4 count. This means that either all of our samples with a low CD4 count had SI viruses or there were other factors that induced the shift. To examine whether there was viral phenotypic switching along with the change in the HIV DNA ratio in the two cell populations, we studied the V3 loop sequences of the viruses in these samples. Amino acid sequences at certain positions in the V3 loop, as well as its net charge, are major determinants of the SI or NSI phenotype and the chemokine receptor usage and can predict the viral phenotype in the majority of HIV isolates (7, 18). V3 fragments were successfully amplified from 28 of 30 samples. The amino acid sequence of V3, the net charge, the CD4 count, and the HIV DNA ratio of each sample are shown in Fig. 5. All of the sequences clustered with subtype E in a phylogenetic analysis (data not shown). The characteristics that predict the SI phenotype for subtype E viruses include the GPGR or GPGH motif instead of the GPGQ motif at the tip of the loop, a positively charged amino acid at positions 11 and 25, the loss of an N-linked glycosylation site with substitution by positively charged amino acid, and a high net positive charge (20). Only one sample (K4) had two of these characteristics, i.e., GPGR and a positively charged amino acid (arginine) at position 11. Another three samples had the GPGR motif (K10, K12, and K13), and one had GPGH (K22). Another amino acid position that had been reported to be predictive of the SI phenotype for subtype E is position 13 (20). Five more sequences (K2, K15, K21, K25, and K27) had positively charged amino acids at this position. These 10 samples, which had a GPGR/H tip or a positively charged amino acid at position 11, 13, or 25 had relatively high net positively charges of 4 to 6 and had low to moderately low CD4 counts (15 to 273 cells/mm3) and HIV DNA in the CCR5+ cell/CCR5− cell ratio (0.27 to 4.32). Loss of the conserved N-linked glycosylation site was found in six sequences, of which three had other SI markers. However, these changes were not caused by substitutions with positively charged amino acid since that was shown to be a predictor of the SI phenotype. For the 18 sequences that have the GPGQ tip and did not have positively charged amino acid at position 11, 13, or 25, all had a net charge <5, 4 samples had a high HIV DNA in the CCR5+/CCR5− cell ratio (19.69 to 46.25); another 10 samples had a ratio of 1 to 6, and 4 samples had ratio of <1. Therefore, among 24 samples with a low ratio (<6), only 10 samples had V3 sequences that are compatible with CXCR4 usage. Although V1V2 is considered to be only a minor determinant, it is possible that the sample with a low ratio and NSI V3 loop might have an SI genetic determinant in V1V2. To test this hypothesis, we studied the V1V2 sequences of 12 samples (3 with high HIV DNA levels in the CCR5+/CCR5− cell ratio, 3 with a low ratio and SI V3, and 6 with a low ratio and NSI V3). As shown in Fig. 6, there was no significant difference in the characteristics that were reported to be associated with the SI or NSI phenotype, such as length of the hypervariable locus in the V2 loops and N-linked glycosylation sites, except for one sequence (K25) that had longer sequence at the length-variable locus in V2. This sample also had a SI-predictive V3 sequence.
FIG. 5.
V3 loop amino acid sequence alignment. The N-linked glycosylation site and amino acid positions 11 and 25 are marked by asterisks, and the tip of the V3 loop is underlined. The net charge, the CD4 count, and the ratio of HIV DNA in a CCR5-positive population to the HIV DNA in a CCR5-negative population are provided for each sequence. A reference subtype E sequence of TH253 is shown on the top.
FIG. 6.
V1V2 loop amino acid sequence alignment. The length of the hypervariable locus in V2 loop, the CD4 count, and the ratio of HIV DNA in CCR5-positive versus HIV DNA in CCR5-negative populations are provided for each sequence. A reference subtype E sequence of TH253 is shown on the top.
Because we have performed direct sequencing without prior cloning, there was a possibility that we might have overlooked minor variants in the quasispecies. We therefore sought to determine whether the samples that had a high viral DNA load in CCR5-negative cells and showed V3 NSI sequences contained any SI variants. To examine this, we selected the samples with HIV DNA in a CCR5+/CCR5− cell ratio of ≤1 and V3 NSI sequences for cloning and sequencing (K18, K19, K20, K23, and K29). For each sample, 10 clones were sequenced in the V3 region. Of these five samples, two showed NSI V3 sequences in all 10 clones (K18 and K29), another two showed three SI sequences (K19 and K20), and one showed seven SI sequences (K23). Therefore, even after cloning we could not find SI sequences in some of the samples with a high viral DNA load in CCR5-negative cells.
DISCUSSION
The CD4 count is a reliable marker for immune status and stages of disease progression in HIV-1 infection. Our results showed that the HIV DNA level in CCR5-positive lymphocytes did not correlate with disease progression. This suggested that the efficiency of CCR5 usage remained unchanged regardless of the viral phenotype or disease stages. This was in agreement of earlier data showing that most primary SI viruses are dual tropic in chemokine receptor usage and can still use CCR5 efficiently (15). Because the HIV-1 DNA in a CCR5-negative population increased markedly during disease progression, it is reasonable to conclude that the progression of infection might be driven mainly by the expansion of cell tropism and increased availability of target cells rather than by weakening of immune defense that allows more efficient spreading in the same target cell population. Our data showed that the major expansion in the target cell population occurred at a CD4 count of ca. 300 cells/mm3. This point might mark an important step in disease progression and the crashing of the immune system.
The HIV DNA pool in PBMC is known to contain significant portion of replication-incompetent, archival DNA. However, we showed that the HIV RNA/HIV DNA ratios in CCR5-positive and -negative cells were not different. This suggested that a similar proportion of viral DNA in the two cell populations was actively replicating. The observed shift of HIV DNA level in these cell populations was, therefore, likely to reflect the shift of The target cells for new infection and not the result of the differential accumulation of archival DNA between the two cell populations. The RNA data also argued against the possibility that HIV-induced cell killing might be different between CCR5-positive and -negative cells leading to the difference in HIV DNA level.
The decrease of the ratio between HIV-1 DNA in CCR5-positive and -negative lymphocytes might be due to both viral and host factors. A change in the viral chemokine receptor usage could result in the expansion of the target cell population to CCR5-negative cells. On the other hand, abnormal cellular activation might enhance the susceptibility of CCR5-negative cells in advanced HIV disease.
The presence of HIV DNA with NSI sequences in CCR5-negative cells was intriguing. This might suggest that our current phenotype prediction by V1V2 and V3 sequences is not accurate. Alternatively, the lymphocytes that appeared to be CCR5 negative by immunostaining might, in fact, express low level of CCR5. Moreover, the infection of the apparently CCR5-negatives cells might be due to the ability of some HIV strains to utilize low concentrations of CCR5 efficiently, as has been shown for an in vitro-selected variant of JRCSF (6). Another possibility is that the infected CCR5-negative cells might be CCR5 positive before infection but become CCR5-negative because of CCR5 downmodulation by HIV infection, as has been previously shown (4). This, however, did not explain the relative increase in HIV DNA in the CCR5-negative cells with the decline of CD4 count, unless the CCR5 downmodulation ability was strain dependent and increased with the disease progression.
Because only some of the viruses in late HIV disease are SI, whereas all of the subjects in our study showed low HIV DNA levels in CCR+/CCR5− cell ratios, this ratio may be useful as a prognostic marker for disease progression. The validity of this marker requires further studies in long-term cohorts.
ACKNOWLEDGMENTS
This work was supported by a research grant from the Fogarty International Center AIDS International Training and Research Program (AITRP).
We thank Max Essex for helpful comments and discussion. Reagent 2D7 anti-CCR5 monoclonal antibody (LeukoSite, Inc.) was obtained through the AIDS Research and Reference Reagent Program, Division of AIDS, NIAID, NIH.
REFERENCES
- 1.Auewarakul P, Sangsiriwut K, Pattanapanyasat K, Suwanagool S, Wasi C. Increase in activated CD4+ lymphocytes with CCR5 and CXCR4 in HIV type 1-infected persons. AIDS Res Hum Retrovir. 1999;15:1403–1404. doi: 10.1089/088922299310115. [DOI] [PubMed] [Google Scholar]
- 2.Bleul C C, Wu L, Hoxie J A, Springer T A, Mackay C R. The HIV coreceptors CXCR4 and CCR5 are differentially expressed and regulated on human T lymphocytes. Proc Natl Acad Sci USA. 1997;94:1925–1930. doi: 10.1073/pnas.94.5.1925. [DOI] [PMC free article] [PubMed] [Google Scholar]
- 3.Carrillo A, Ratner L. Cooperative effects of the human immunodeficiency virus type 1 envelope variable loops V1 and V3 in mediating infectivity for T cells. J Virol. 1996;70:1310–1316. doi: 10.1128/jvi.70.2.1310-1316.1996. [DOI] [PMC free article] [PubMed] [Google Scholar]
- 4.Chenine A L, Sattentau Q, Moulard M. Selective HIV-1-induced downmodulation of CD4 and coreceptors. Arch Virol. 2000;145:455–471. doi: 10.1007/s007050050039. [DOI] [PubMed] [Google Scholar]
- 5.Chou C-S, Ramilo O, Vitetta E S. Highly purified CD25− resting T cells cannot be infected de novo with HIV-1. Proc Natl Acad Sci USA. 1997;94:1361–1365. doi: 10.1073/pnas.94.4.1361. [DOI] [PMC free article] [PubMed] [Google Scholar]
- 6.Dejucq N, Simmons G, Clapham P R. Expanded tropism of primary human immunodeficiency virus type 1 R5 strains to CD4+ T-cell lines determined by the capacity to exploit low concentrations of CCR5. J Virol. 1999;73:7842–7847. doi: 10.1128/jvi.73.9.7842-7847.1999. [DOI] [PMC free article] [PubMed] [Google Scholar]
- 7.Fouchier R A M, Groenink M, Kootstra N A, Tersmette M, Huisman H G, Miedema F, Schuitemaker H. Phenotype-associated sequence variation in the third variable domain of the human immunodeficiency virus type 1 gp120 molecule. J Virol. 1992;66:3183–3187. doi: 10.1128/jvi.66.5.3183-3187.1992. [DOI] [PMC free article] [PubMed] [Google Scholar]
- 8.Groenink M, Fouchier R A M, Broersen S, Baker C H, Koot M, van't Wout A B, Huisman H G, Miedema F, Tersmette M, Schuitemaker H. Relation of phenotype evolution of HIV-1 to envelope V2 configuration. Science. 1993;260:1513–1516. doi: 10.1126/science.8502996. [DOI] [PubMed] [Google Scholar]
- 9.Huang Y, Paxton W A, Wolinsky S M, Neumann A U, Zhang L, He T, Kang S, Ceradini D, Jin Z, Yazdanbakhsh K, Kunstman K, Eirckson D, Dragon E, Landau N R, Phair J, Ho D D, Koup R A. The role of a mutant CCR5 allele in HIV-1 transmission and disease progression. Nat Med. 1996;2:1240–1243. doi: 10.1038/nm1196-1240. [DOI] [PubMed] [Google Scholar]
- 10.Koot M, Keet I P M, Vos A H V, de Goede R E Y, Roos M T L, Coutinho R A, Miedema F, Schellekens P T A, Tersmette M. Prognostic value of human immunodeficiency virus type 1 biological phenotype for rate of CD4+ cell depletion and progression to AIDS. Ann Intern Med. 1993;118:681–688. doi: 10.7326/0003-4819-118-9-199305010-00004. [DOI] [PubMed] [Google Scholar]
- 11.Koot M, Van Leeuwen R, de Goede R E Y, Keet I P, Danner S, Eeftinck Schattenkerk J K, Reiss P, Tersmette M, Lange J M, Schuitemaker H. Conversion rate towards a syncytium inducing (SI) phenotype during different stages of HIV infection and prognostic value of SI phenotype for survival after AIDS diagnosis. J Infect Dis. 1999;179:254–258. doi: 10.1086/314539. [DOI] [PubMed] [Google Scholar]
- 12.Menzo S, Bagnarelli P, Giacca M, Manzin A, Varaldo P E, Clementi M. Quantitation of viremia in human immunodeficiency virus infection by competitive reverse transcription and polymerase chain reaction. J Clin Microbiol. 1992;30:1752–1757. doi: 10.1128/jcm.30.7.1752-1757.1992. [DOI] [PMC free article] [PubMed] [Google Scholar]
- 13.Ostrowski M A, Chun T-W, Justement S J, Motola I, Spinelli M A, Adelsberger J, Ehler L A, Mizell S B, Hallahan C W, Fauci A S. Both memory and CD45RA+/CD62L+ naive CD4+ T cells are infected in human immunodeficiency virus type 1-infected individuals. J Virol. 1999;73:6430–6435. doi: 10.1128/jvi.73.8.6430-6435.1999. [DOI] [PMC free article] [PubMed] [Google Scholar]
- 14.Sanders M, Makgoba M, Dhse D. Human naïve and memory T cells. Immunol Today. 1998;9:195–199. doi: 10.1016/0167-5699(88)91212-1. [DOI] [PubMed] [Google Scholar]
- 15.Simmon G, Wilkinson D, Reeves J D, Dittmar M T, Beddows S, Weber J, Carnegie G, Desselberger U, Gray P W, Weiss R A, Clapham P R. Primary, syncytium-inducing human immunodeficiency virus type 1 isolates are dual-tropic and most can use either Lestr or CCR5 as coreceptors for viral entry. J Virol. 1996;70:8355–8360. doi: 10.1128/jvi.70.12.8355-8360.1996. [DOI] [PMC free article] [PubMed] [Google Scholar]
- 16.Tang S, Patterson B, Levy J A. Highly purified quiescent human peripheral blood CD4+ T cells are infectable by human immunodeficiency virus but do not release virus after activation. J Virol. 1995;69:5659–5665. doi: 10.1128/jvi.69.9.5659-5665.1995. [DOI] [PMC free article] [PubMed] [Google Scholar]
- 17.Termette M, De Goede R E Y, Al B J M, Winkel I N, Gruters R A, Cuypers H T, Huisman H G, Miedema F. Differential syncytium-inducing capacity of human immunodeficiency virus isolates: frequent detection of syncytium-inducing isolates in patients with acquired immunodeficiency syndrome (AIDS) and AIDS related complex. J Virol. 1988;62:2026–2032. doi: 10.1128/jvi.62.6.2026-2032.1988. [DOI] [PMC free article] [PubMed] [Google Scholar]
- 18.Xiao L, Owen S M, Goldman I, Lai A A, deJong J J, Goudsmit J, Lai R B. CCR5 coreceptor usage of non-syncytium-inducing primary HIV-1 is independent of phylogenetically distinct global HIV-1 isolates: delineation of consensus motif in the V3 domain that predicts CCR-5 usage. Virology. 1998;240:83–92. doi: 10.1006/viro.1997.8924. [DOI] [PubMed] [Google Scholar]
- 19.Yourno J, Conroy J A. Novel polymerase chain reaction method for detection of human immunodeficiency virus in dried blood spots on filter paper. J Clin Microbiol. 1992;30:2887–2892. doi: 10.1128/jcm.30.11.2887-2892.1992. [DOI] [PMC free article] [PubMed] [Google Scholar]
- 20.Yu X F, Wang Z, Beyrer C, Celentano D D, Khamboonruang C, Allen E, Nelson K. Phenotypic and genotypic characteristics of human immunodeficiency virus type 1 from patients with AIDS in northern Thailand. J Virol. 1995;69:4649–4655. doi: 10.1128/jvi.69.8.4649-4655.1995. [DOI] [PMC free article] [PubMed] [Google Scholar]


