Abstract
BACKGROUND:
We assessed agreement between center-of-pressure data from a laboratory force-platform and head position data from an HTC Vive head-mounted display (HMD) for the evaluation of standing postural control.
OBJECTIVES:
We investigated the impact of different statistical choices when assessing the relationship between two measurements. Specifically: 1) How does correlation and agreement statistics relate before and after logarithmic transformation? 2) Is there systemic or proportional bias between the force-platform and HMD measurements?
METHODS:
We tested 37 adults (26 controls, 11 with unilateral vestibular hypofunction) standing on foam, observing a static or dynamic visual scene projected from the HMD. We quantified anterior-posterior and medio-lateral sway via Directional Path, Root Mean Square Velocity, Variance, and Power Spectral Density (PSD) from a force-platform and the HMD.
RESULTS:
Intra-class correlations (ICCs) were moderate-to-good for the non-transformed data and good-to-excellent after logarithmic transformation for all outcomes except for PSD above 1 Hz. Correlations were higher than ICCs. Bland-Altman plots indicated proportional bias but not after logarithmic transformation.
CONCLUSIONS:
Both devices correlated linearly, and measure people’s postural responses but cannot be used interchangeably, mostly because they appear to diverge with larger sway as evident on Bland-Altman plots of non-transformed data. Agreement between devices was excellent for low frequency movement but poor for high frequency small corrective movements.
Keywords: Virtual Reality, Bland-Altman, Correlations, Postural Control, Balance
1. Introduction
Standing is a basic human function that healthy adults take for granted, yet it is a complex perceptual-motor process that requires sensation of position and motion from the sensory systems; processing of sensory information to determine orientation and movement; and selection of motor responses that maintain or bring the body into equilibrium (postural control) (1). Historically, laboratory and clinical assessments of postural control have diverged in terms of sensitivity and specificity, and by providing quantitative vs qualitative information. With technological advancements, the potential for clinical translation of instrumented assessment of standing balance has increased. The Covid-19 pandemic and associated immense growth in telerehabilitation underscores the need for objective, quantitative, accurate assessments of standing balance outside a laboratory setting.
Force-platforms are the gold standard to quantify postural sway via center of pressure (COP) oscillations in the mediolateral (ML) and anteroposterior (AP) directions during quiet stance (2). COP trajectories are known to be sensitive to changes in balance with aging and neurological disorders (3–5). Well-established metrics of postural control in multiple populations include COP path length (6) and sway velocity (7). These parameters, especially ML movement, reflect amount of movement and postural steadiness, and are predictive of fall risk, (8). COP variance is also commonly used to indicate postural stability in different populations (9). The components of the variance are derived via frequency analysis of the sway (power spectral density, PSD). PSD sheds light on the relative contribution of each sensory system (visual, vestibular, somatosensory) to the performance of a standing balance task (10,11).
Head-Mounted Displays (HMD) are portable, affordable devices that measure head position output while simultaneously providing visual and auditory input. Excellent agreement between head kinematics derived from high-end HMDs, namely the HTC Vive or Oculus Rift, and a motion capture system was found in healthy young adults (12). Most ICC values for directional path, acceleration in 6 degrees of freedom, and volume of translation movement were around 0.9 with several at 0.99, supporting its measurement accuracy (12). While HMDs have been proposed as ecologically valid to evaluate balance, only a handful of studies conducted a direct comparison between COP position derived from a force platform and head position derived from an HMD(13). Saldana et al. quantified velocity, amplitude, maximum displacement, average displacement, and area, and found that the Oculus Rift showed similar differences between tasks on an AMTI force-platform in 13 healthy older adults conditions as the platform (14). Marchetto and Wright quantified standard deviation, range, sway area, and velocity in 10 young adults and found excellent correlations (R = 0.82-0.96) between the Oculus Rift and a Wii Balance Board force-platform with no statistically significant differences between devices (15). Ashida and Fujimoto observed high cross correlations (above 0.8) between Oculus Rift and a Wii Balance Board signal in 17 healthy young adults (16). Lubetzky et al. reported cross correlations ranging between 0.66 and 0.78 for data derived from an HTC Vive and a Kistler force-platform in 23 healthy young adults. Cross correlations were overall higher in the AP vs. ML direction and lower with a counting task vs. without (17). These studies support the relationship between HMDs and force-platforms, yet several gaps remain. First, clinicians and researchers often use summary measures to indicate balance performance, such as the ones mentioned above, hence is necessary to evaluate how these summary measures compare to each other (beyond signal correlation such as provided by cross-correlation analysis). Second, agreement metrics should be used for validation rather than correlations. Finally, validation needs to take place over a wide range of performance to evaluate agreement over a diverse scale of the measurement.
When assessing how 2 measurements co-vary one may consider using correlations to determine this magnitude. A preferred approach to correlations is to assess the agreement between 2 measurements. While the correlation measures the strength of any linear relationship, agreement determines the magnitude of the concordance, measured through the intraclass correlation coefficient (ICC). Since correlations measure a more flexible relationship than the ICC (18), correlations are generally higher than agreement, potentially resulting in artificially confident conclusions. This is because the interest is in whether 1 measurement can replace the other can only be done if they are concordant.
A second important question is whether any systematic bias exists between 2 measurements across the range of possible values in addition to a global measure of agreement. Bland-Altman plots aim to establish whether agreement varies as a function of measurement values. These plots visualize systemic bias that may not be apparent through a single number summary such as a correlation coefficient or ICC. There may exist deviations between the 2 measures at a certain part of the range and not another (proportional bias) or a constant difference between the 2 measures across the entire range (fixed bias) which influences the interpretation of the results. For a meaningful Bland-Altman inquiry it is important to include a diverse range of abilities and performance in challenging enough balance tasks because separation between devices often occurs at higher movement (more sway). Importantly, previous papers looking at agreement, in general, used either small samples or ones that were homogenous with regards to the measures of interest.
When proportional bias is present, as indicated through a Bland-Altman plot, researchers may opt to apply a logarithmic transformation to each variable of interest (19,20). Doing so must consider the effect of the transformation in the context of the research question. Applying a logarithmic transformation inherently minimizes large values, thus removing the influence of outliers in either instrument on the agreement between them. While this approach is helpful when fitting statistical models that require an assumption of residuals’ normality (21), it is counterproductive when evaluating proportional bias, which tends to occur on larger values.
The purpose of this study was to evaluate agreement on balance outcomes calculated from COP data (from a laboratory force-platform) and head kinematics (from an HTC Vive headset). Specifically:
1) How are correlation and agreement statistics related both on the original response scale and after applying a logarithmic transformation?
2) xsIs there a fixed or proportional bias between the force-platform and HMD? Are these visible on a Bland-Altman plot either when the original response data are used or when a logarithmic transformation is applied?
2. Methods
2.1. Sample
We recruited a diverse sample of adults with or without a known balance problem. The study was approved by the Brany Institutional Review Board and all participants signed written informed consent. Participants (N=37) were recruited as a part of a larger study that assesses sensory integration for postural control (22). Participants were screened for normal or corrected to normal vision and normal protective sensation at the bottom of their feet and normal hearing. Some participants had unilateral vestibular hypofunction (N=11). They were recruited from the Ear Institute at Mount Sinai during a standard clinical evaluation and diagnosed by a vestibular physical therapist.
2.2. Protocol
Participants wore the HTC Vive Pro Eye (HTC, Taoyuan City, Taiwan) while standing on Airex foam (AIREX®, Sins, Switzerland) placed on top of a force-platform (Kistler, Winterthur, Switzerland). They stood hips-width apart keeping their arms by their side (Figure 1). They were asked to look straight ahead and do whatever felt natural to maintain their balance as a display of stars was projected for 60 seconds. The star scenes, described in detail in (11,12,17), were a subset of a longer protocol with 24 scenes presented in a random order, with a short break after 12 scenes. In order to provide a challenging balance task that would result in a wide range of performance, the stars were either static or dynamic, moving in the AP direction at 0.2 Hz frequency and 0.032 meters amplitude. Each scene repeated twice. This protocol has been shown to be sensitive to vestibular dysfunction (11,23).
Fig. 1:
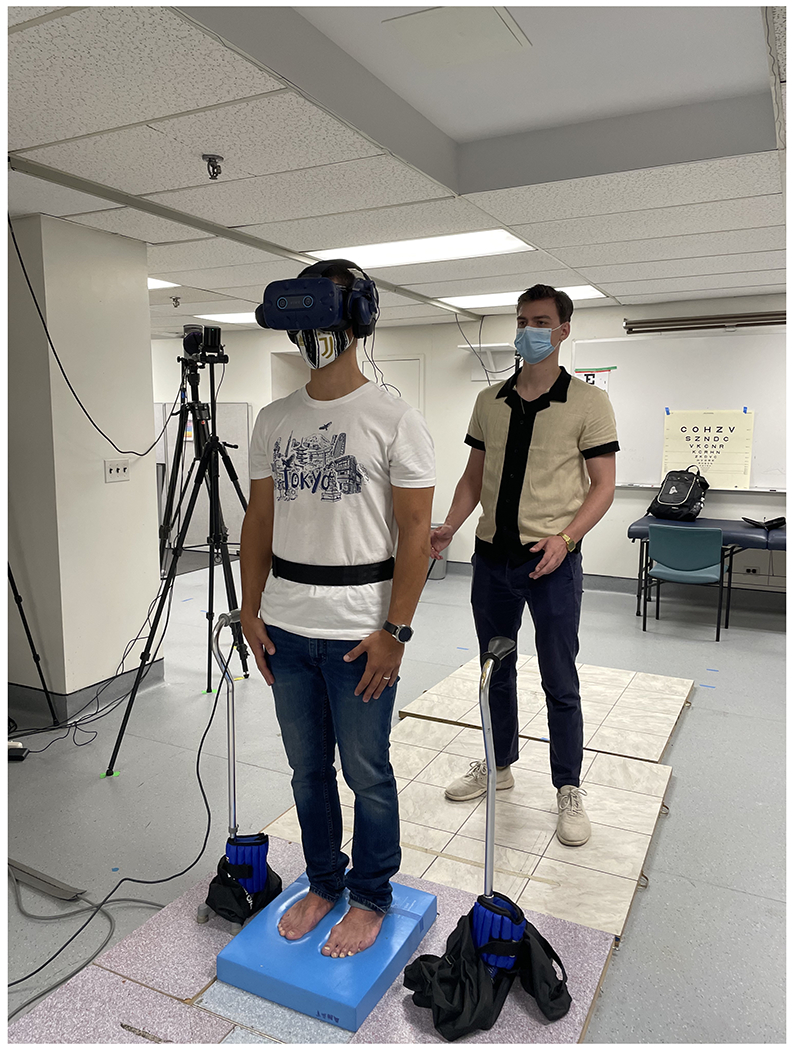
Experimental setup: A participant is standing on foam placed on top of a force-platform while wearing the HTC Vive headset.
2.3. Data Reduction and Outcome Measures
COP trajectories were recorded at 100 Hz. Head kinematics were recorded at 90 Hz by custom-made software written for the HTC Vive headset (12). We applied a low-pass 4th order Butterworth filter with a cutoff frequency at 10 Hz (24). Our past inquiries have shown that standing postural sway oscillations rarely surpass 2 Hz. Given that, this filter is highly conservative, and all relevant human data are maintained following processing (25). All data were processed, and the outcome measures were calculated in Matlab R2021a (Mathworks, Natick, MA):
Directional Path (DP, cm, AP and ML):
defined as total path length of the position curve in the ML or AP (26,27)
Root Mean Square Velocity (RMSV, cm/s, AP and ML):
defined as the difference in position between two consecutive data points divided by the average time interval. The velocity at each point is squared, summed, square rooted, and divided by the number of data points (28).
Power Spectral Density (PSD, cm2, AP and ML):
The power spectrum of raw COP or head time series was calculated via the Matlab function periodogram with a boxcar window. PSD 1, PSD 2, PSD 3, PSD 4 denote the sum of the power spectrum values across the four ranges of frequencies (in Hz): [0, 0.25], [0.25, 0.5], [0.5, 1], [1, 3]. The variance of the time series is the total sum of the power spectrum.
2.4. Statistical Analysis
We calculated descriptive statistics for all demographic data. For each measure of interest we calculated ICC3,1 and its 95% CI as a measure of agreement between the head and the force-platform separately for each visual condition (static/dynamic), on both the original response scale and after logarithmic transformation. An ICC below 0.50 was considered poor, between 0.50 and 0.75 moderate, between 0.75 and 0.90 good, and above 0.90 excellent (29). We calculated Pearson’s correlation, since the measures were linearly related, and its 95% CI for each measure and visual condition.
To assess fixed and proportional bias, we generated Bland–Altman plots (30,31) that show the relationship between the measurements obtained from the force-platform and the head as a function of the average of both measurements and the limits of this agreement. These plots allow for visual inspection of systematic differences between the head and force-platform measurements, specifically, fixed and proportional bias. We generated Bland-Altman plots for each measure, both on the original (non-transformed) response scale and with a logarithmic transformation for the outcome measure. We combine the static and dynamic visual conditions within the same plot in order to obtain a range of values (e.g., we see higher values for the dynamic conditions than the static condition and combining the data results in a wider spread of values).
All analyses were conducted in RStudio version 4.1.2. The complete dataset can be found at: https://data.mendeley.com/datasets/jw38kfc8fd/1
3. Results
Table 1 presents descriptive statistics. Our sample was heterogeneous in age, exercise habits, and balance confidence. Eleven presented with a clinical diagnosis of vestibular hypofunction.
Table 1.
Descriptive statistics: Sample and Outcome Measures
| Measure | Mean (SD) [Min - Max] or N (%) |
|---|---|
|
| |
| Age (years) | 52.0 (18.1) [22 - 78] |
|
| |
| Weight (Kg) | 70.76 (12.93) [47.17 – 99.79] |
|
| |
| Height (cm) | 170.69 (11.68) [152.4 – 198.12] |
|
| |
| Exercise per week (minutes) | 192.1 (181.5) [0 - 680] |
|
| |
| Activities Specific Balance Confidence Scale | 91.5 (11.2) [53.1 - 100] |
|
| |
| Race/ethnicity | |
| White | 20 (54.1%) |
| Black or African American | 2 (5.4%) |
| Asian American | 6 (16.2%) |
| Asian/Pacific Islander | 3 (8.1%) |
| Spanish/Hispanic | 2 (5.4%) |
| Indian | 1 (2.7%) |
| Middle Eastern | 2 (5.4%) |
| Pakistani | 1 (2.7%) |
|
| |
| Sex | |
| Male | 17 (45.9%) |
| Female | 20 (54.1%) |
|
| |
| Falls in the past year | |
| Yes | 6 (16.2%) |
| No | 31 (83.8%) |
|
| |
| Peripheral Vestibular Hypofunction | |
| Yes | 11 (29.7%) |
| No | 26 (70.3%) |
|
| |
| Directional Path AP Static (cm) | |
| FP | 113.25 (41.04) [68.96-267.47] |
| Head | 56.51 (15.03) [35.61-96.17] |
|
| |
| Directional Path AP Dynamic (cm) | |
| FP | 136.93 (45.34) [70.58-263.4] |
| Head | 70.53 (17.67) [37.9-114.35] |
|
| |
| Directional Path ML Static (cm) | |
| FP | 55.44 (16.84) [30.73-111.61] |
| Head | 36.77 (10.52) [19.52-69.49] |
|
| |
| Directional Path ML Dynamic (cm) | |
| FP | 60.08 (16.77) [33.64-115.62] |
| Head | 39.56 (11.25) [19.24-86.83] |
|
| |
| Root Mean Square Velocity AP Static (cm/s) | |
| FP | 2.72 (0.96) [1.67-6.18] |
| Head | 1.3 (0.34) [0.8-2.18] |
|
| |
| Root Mean Square Velocity AP Dynamic (cm/s) | |
| FP | 3.3 (1.07) [1.67-6] |
| Head | 1.63 (0.4) [0.93-2.58] |
|
| |
| Root Mean Square Velocity ML Static (cm/s) | |
| FP | 1.31 (0.4) [0.74-2.64] |
| Head | 0.85 (0.24) [0.46-1.64] |
|
| |
| Root Mean Square Velocity ML Dynamic (cm/s) | |
| FP | 1.43 (0.41) [0.78-2.81] |
| Head | 0.92 (0.26) [0.45-2] |
|
| |
| Power Spectral Density 1 AP Static (cm2) | |
| FP | 0.48 (0.31) [0.09-1.38] |
| Head | 1.2 (0.73) [0.27-3.25] |
|
| |
| Power Spectral Density 1 AP Dynamic (cm2) | |
| FP | 0.65 (0.38) [0.12-1.98] |
| Head | 1.52 (0.9) [0.38-5.21] |
|
| |
| Power Spectral Density 2 AP Static (cm2) | |
| FP | 0.12 (0.07) [0.02-0.39] |
| Head | 0.14 (0.09) [0.04-0.46] |
|
| |
| Power Spectral Density 2 AP Dynamic (cm2) | |
| FP | 0.19 (0.11) [0.03-0.51] |
| Head | 0.21 (0.13) [0.04-0.57] |
|
| |
| Power Spectral Density 3 AP Static (cm2) | |
| FP | 0.07 (0.04) [0.02-0.22] |
| Head | 0.03 (0.02) [0.01-0.09] |
|
| |
| Power Spectral Density 3 AP Dynamic (cm2) | |
| FP | 0.11 (0.06) [0.02-0.29] |
| Head | 0.04 (0.03) [0.01-0.13] |
|
| |
| Power Spectral Density 4 AP Static (cm2) | |
| FP | 0.05 (0.04) [0.01-0.17] |
| Head | 0.01 (0) [0-0.02] |
|
| |
| Power Spectral Density 4 AP Dynamic (cm2) | |
| FP | 0.07 (0.05) [0.01-0.22] |
| Head | 0.01 (0) [0-0.03] |
|
| |
| Power Spectral Density 1 ML Static (cm2) | |
| FP | 0.2 (0.12) [0.02-0.53] |
| Head | 0.42 (0.25) [0.09-1.34] |
|
| |
| Power Spectral Density 1 ML Dynamic (cm2) | |
| FP | 0.25 (0.2) [0.04-0.8] |
| Head | 0.52 (0.43) [0.06-2.09] |
|
| |
| Power Spectral Density 2 ML Static (cm2) | |
| FP | 0.07 (0.05) [0-0.27] |
| Head | 0.07 (0.05) [0.01-0.24] |
|
| |
| Power Spectral Density 2 ML Dynamic (cm2) | |
| FP | 0.08 (0.07) [0.01-0.54] |
| Head | 0.07 (0.07) [0.01-0.58] |
|
| |
| Power Spectral Density 3 ML Static (cm2) | |
| FP | 0.02 (0.01) [0-0.06] |
| Head | 0.01 (0.01) [0-0.03] |
|
| |
| Power Spectral Density 3 ML Dynamic (cm2) | |
| FP | 0.02 (0.02) [0-0.14] |
| Head | 0.01 (0.01) [0-0.04] |
|
| |
| Power Spectral Density 4 ML Static (cm2) | |
| FP | 0.01 (0.01) [0-0.03] |
| Head | 0 (0) [0-0.01] |
|
| |
| Power Spectral Density 4 ML Dynamic (cm2) | |
| FP | 0.01 (0.01) [0-0.03] |
| Head | 0 (0) [0-0.01] |
3.1. Intraclass Correlation Coefficients
Figure 2 displays the ICC values and 95% CIs for DP and RMSV on the original response scale (AP and ML). Figure 3 displays the same measures after the outcome was logarithmically transformed.
Fig. 2:
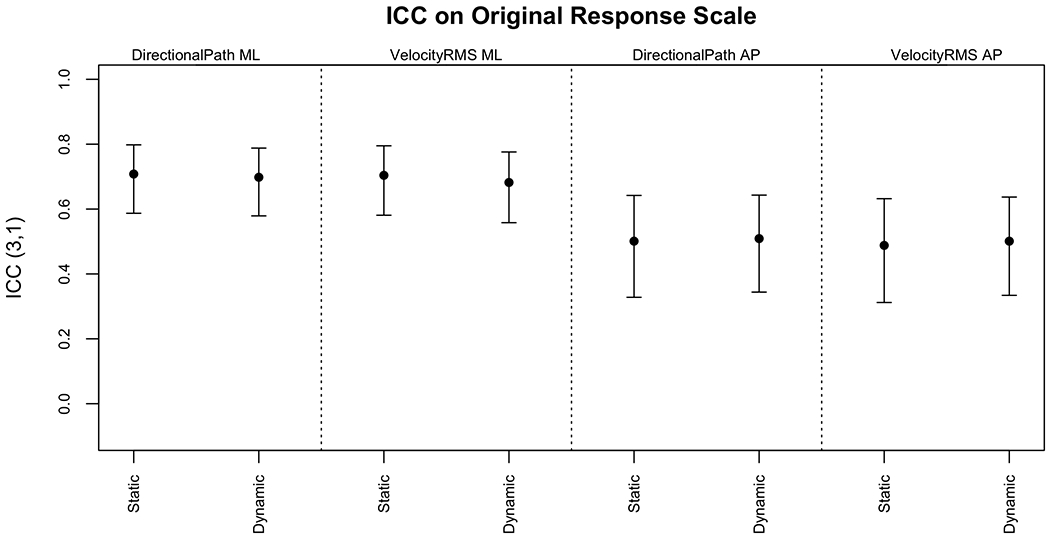
ICC3,1 and 95% CIs for DP and RMSV on the original response scale
Fig. 3:
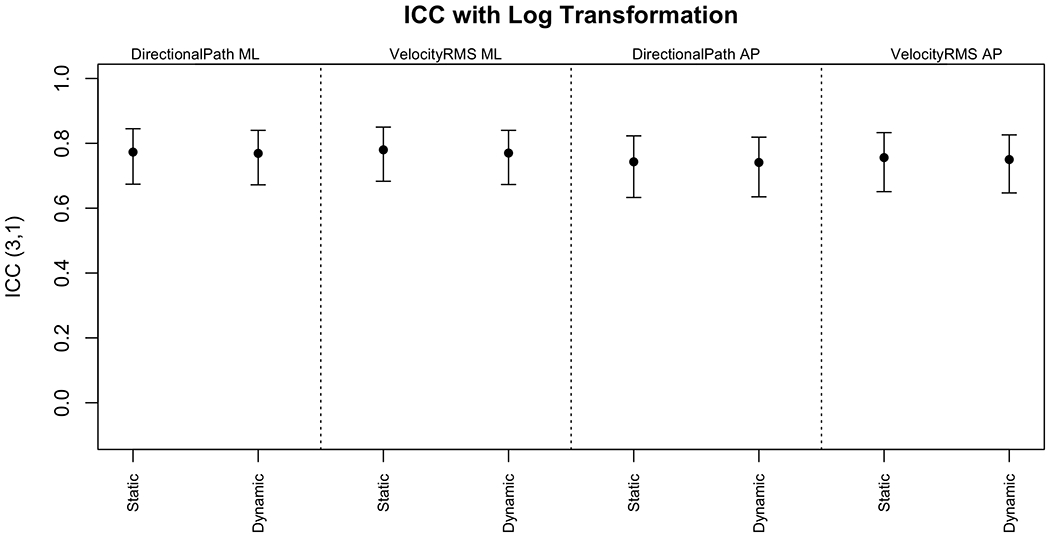
ICC3,1 and 95% CIs for DP and RMSV after log transformation
The ICCs were moderate on the original scale and good after logarithmic transformation. There was no evident difference between the agreements for the static versus dynamic scenes, despite more sway on the dynamic scenes. Figure 4 displays the ICC values and 95% CIs for the PSDs and variance on the original response scale. Figure 5 displays the same measures after the outcomes were logarithmically transformed.
Fig. 4:
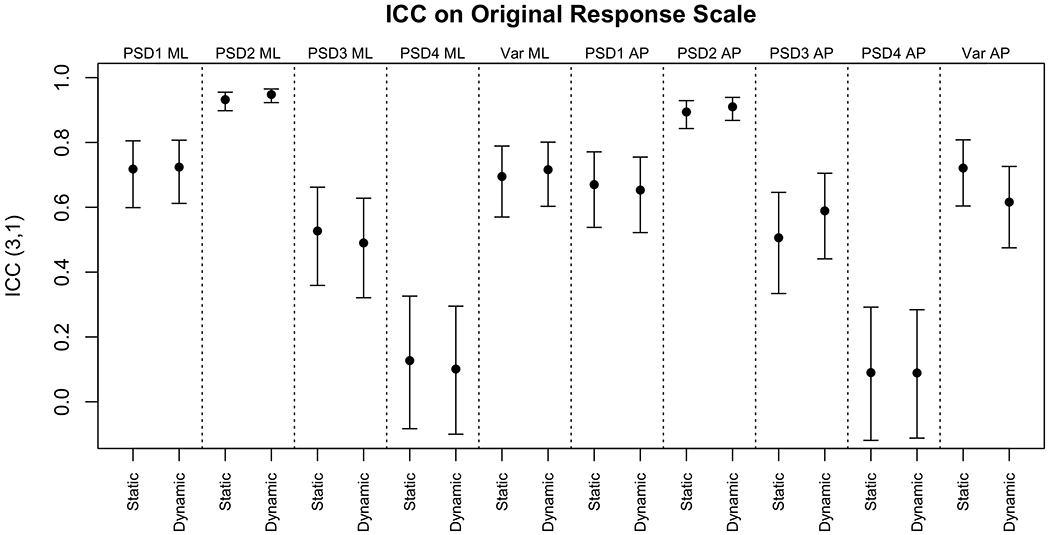
ICC3,1 and 95% CIs for PSD and variance on the original response scale
Fig. 5:
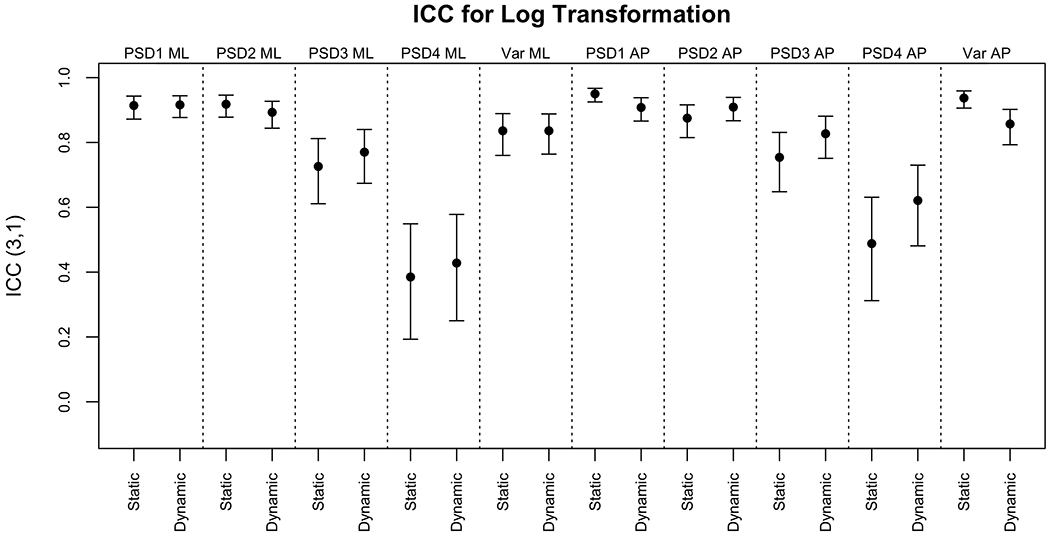
ICC3,1 and 95% CIs for PSD and variance after log transformation
All ICCs increased or did not change after a logarithmic transformation. The agreement between the two instruments was poor for PSD4 ML and PSD4 AP. All other ICCs were good to excellent when logarithmically transformed and moderate to excellent on the original response scale.
Appendices A–D present the numerical ICCs and correlations on both the original response scale and after logarithmic transformation. The correlation values are generally equal to or higher than the ICCs for the same measure. For example, the ICC on the static scene between the two measurements on the original response scale for DP AP was 0.501 (95% CI 0.328, 0.642) while the correlation was 0.776 (95% CI 0.654, 0.859).
3.2. Bland-Altman Plots
Figure 6 displays the Bland-Altman plots for DP and RMSV in ML and AP on the original response scale and after a logarithmic transformation. Before the logarithmic transformation, the Bland-Altman plots showed evidence of proportional and fixed bias, but after transformation, the proportional bias was no longer present.
Fig. 6:
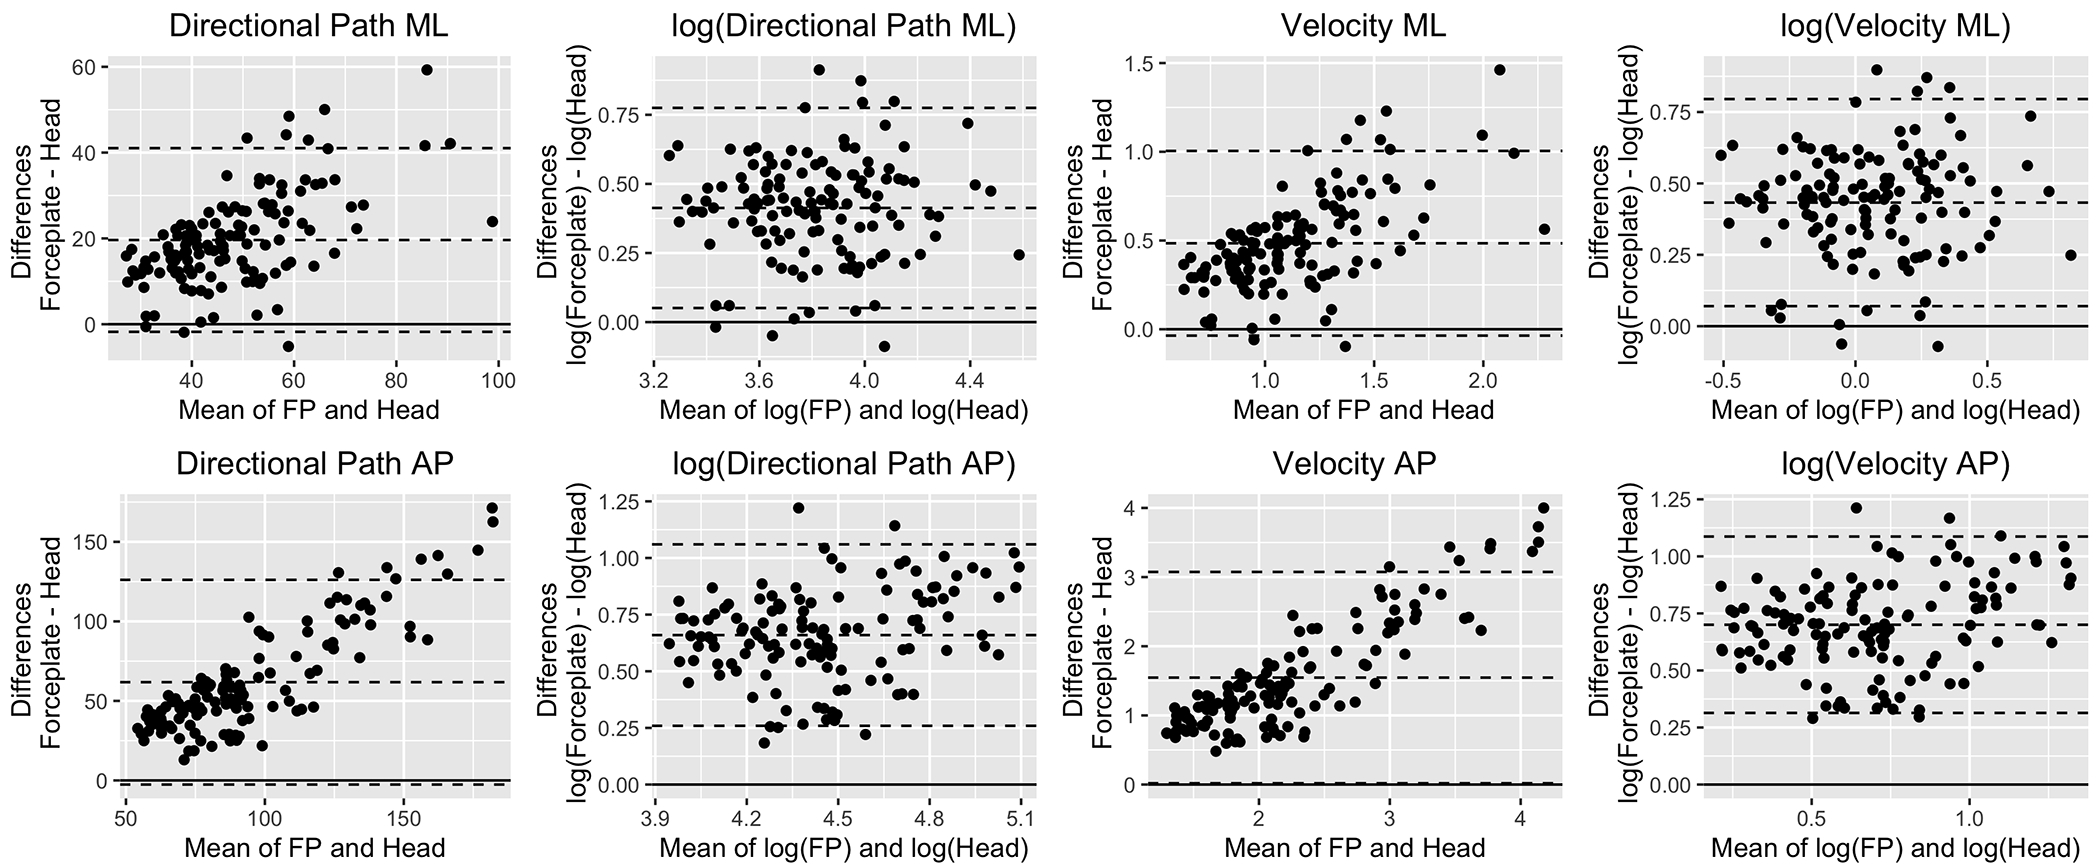
Bland-Altman plots for DP and RMSV on the original response scale and after log transformation. The Y axis shows the difference between forceplate and head values. The X axis shows the average between them. The middle dashed horizontal line displays the mean difference between the devices whereas the bottom and top horizontal lines indicate the lower and upper limits of agreement respectively. The solid line serves as a theoretical 0 difference reference.
Figure 7 displays the Bland-Altman plots for the PSD measures in both the ML and AP planes on the original response scale. All measures showed proportional and fixed bias. Appendix E shows the Bland-Altman plots for the same measures after the logarithmic transformation, where the proportional bias was removed and only a fixed bias remained.
Fig. 7:
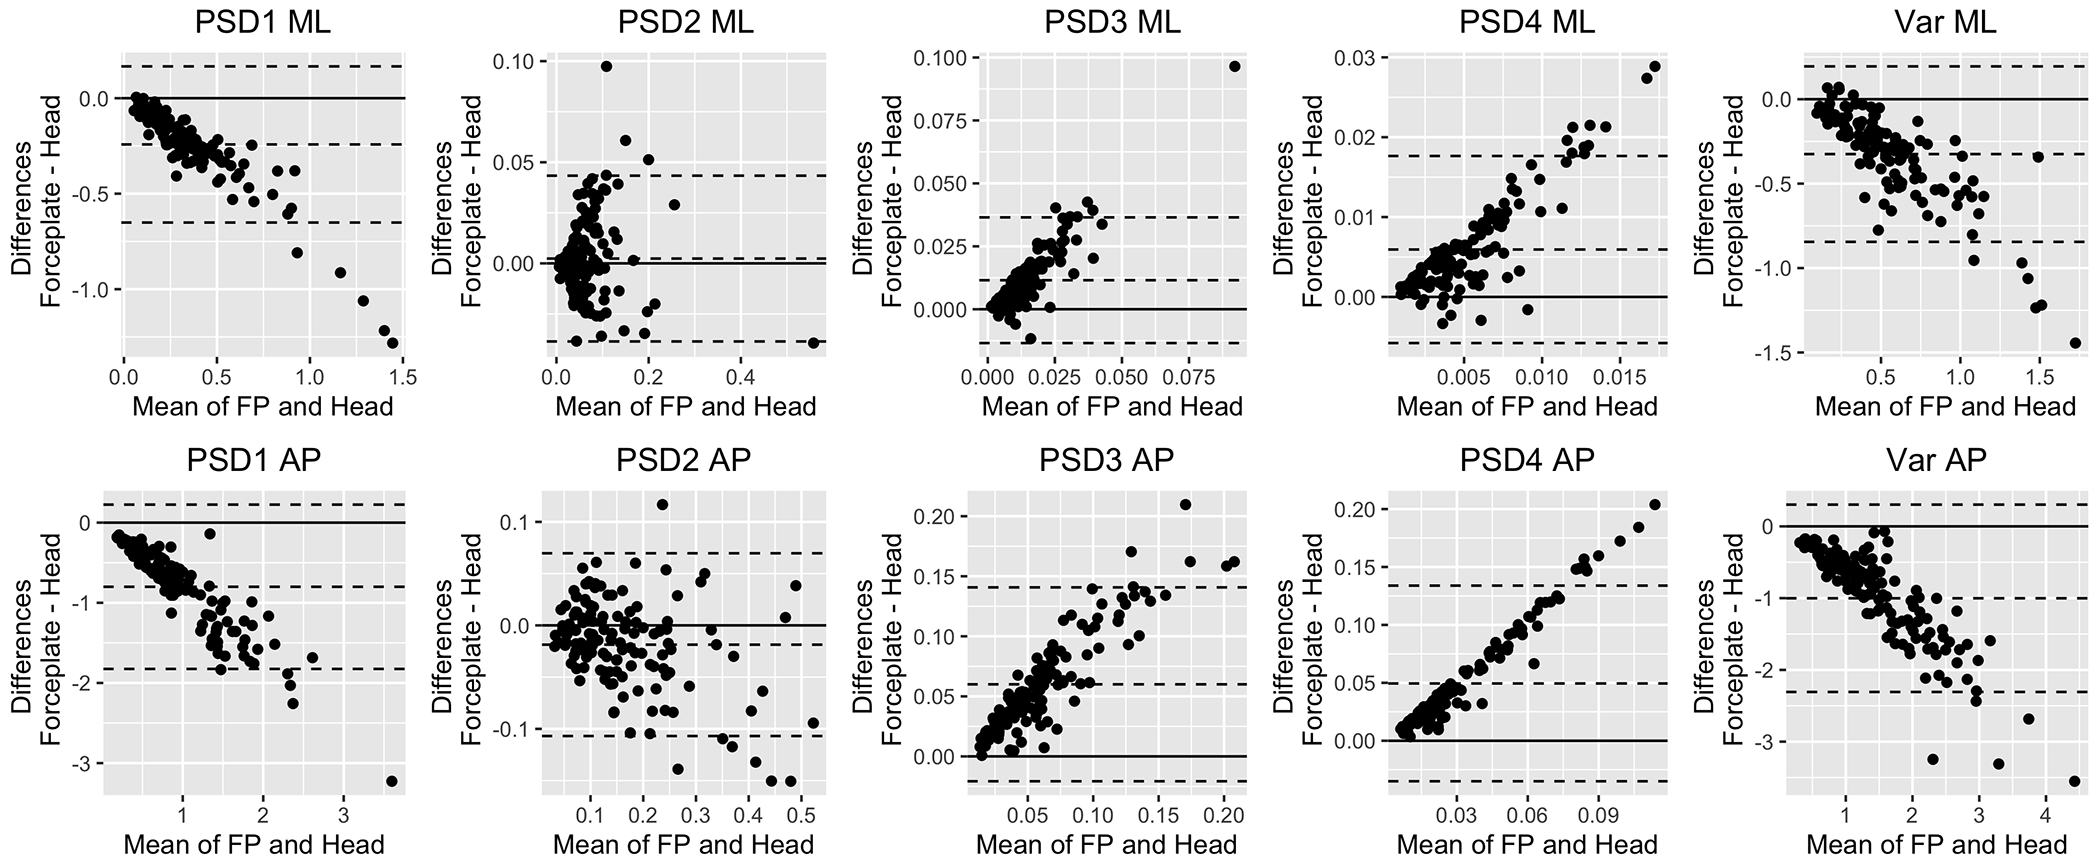
Bland-Altman Plots for PSD measures on the original response scale. The Y axis shows the difference between forceplate and head values. The X axis shows the average between them. The middle dashed horizontal line displays the mean difference between the devices whereas the bottom and top horizontal lines indicate the lower and upper limits of agreement respectively. The solid line serves as a theoretical 0 difference reference.
4. Discussion
We evaluated the agreement between COP data derived from a force-platform and head kinematics derived from the HTC Vive HMD in 37 adults with diverse balance abilities during a challenging balance task. ICCs showed overall moderate to good agreement on all outcome measures except for PSD4 which was typically improved following logarithmic transformation. As expected, correlations were generally higher than ICCs and overall were above 0.7 regardless of logarithmic transformation for all outcomes measures except for PSD4. Bland-Altman plots showed proportional bias (separation increasing on larger values) that was reduced with logarithmic transformations.
4.1. Correlation vs. Agreement
Correlation assesses any linear relationship between two measurements, whereas agreement requires measurements to be on the same scale. The gap between agreement and correlation can be large yet is bounded by 1. The higher the agreement is, the smaller the gap will be. Correlations may be artificially high and, therefore, should not be used to determine agreement between devices. Similar to Marchetto and Wright that evaluated correlations between the Oculus Rift and a Wii Balance Board force-platform, we observed high correlations (above 0.7) for all metrics(15). Beyond evaluating a laboratory-grade force-plate and a newer HMD, our inquiry also included older adults and adults with balance problems due to vestibular dysfunction. In addition, we investigated frequency-based metrics of postural sway. We found excellent correlations on low frequencies (PSD1 and Variance, primarily composed of PSD1) but poor correlations (and agreement) for PSD4.
4.2. Should we take a log or not?
Logarithmic transformations of postural data are used often to satisfy the assumptions of statistical models. Because taking a log shrinks large distances, this reduces the influence of outliers. Indeed, in the current work, ICCs increased for most measures after logarithmic transformation as compared to the original response scale. This is because disagreement between the two instruments was inherently higher on extreme values (i.e., proportional bias) and logarithmic transformations minimizes those. Researchers should consider how they interpret the scale of agreement when inspecting ICC values. We propose that Bland-Altman plots should be visualized on the scale of the raw data to evaluate the distance between the actual performance values.
4.3. What happens at high PSDs?
In a static continuous task, variance and low PSDs appear to be captured well by the head but higher PSDs reflect small corrective movements at the bottom of the feet (somatosensory activation). It has been suggested that the head cannot capture the same level of movement (17). Indeed, agreement and correlations were excellent for variance and lower PSDs, but poor for PSD4 (small and fast movements at frequencies above 1 Hz) suggesting that this outcome reflects different behaviors in the COP and the head.
4.4. Clinical implications
Can head sway derived from an HMD replace a laboratory force platform in the measurement of postural control? While previous studies showed high correlations between devices, primarily in healthy adults (14,15) our study investigated a wide range of performance and evaluated additional statistics indicating agreement that go beyond correlations. A wide range of performance is crucial for such an investigation because of the concern for a proportional bias that we indeed observed (higher separation between devices on larger amounts of sway) that we not reported before. Our findings suggest that HMDs can be used clinically for postural control assessment, but one cannot assume that the derived data will agree with COP values, particularly among those who present instability. In addition, given the portability of HMD and its ability to accurately detect changes in postural control, this technology carries the possibility for the creation of large datasets in community balance testing. Artificial intelligence and deep learning approaches may then prove to be useful for analysis of these large outside-of-laboratory datasets.
4.5. Limitations and Future Work
These results should not be generalized to other headsets (we used HTC Vive Pro) because of different tracking capabilities or other force-platforms, or to, for example, non-linear measures of balance. While we attempted to obtain a wide range of performance and believe that our data-driven approach can be generalized to other populations; others may choose to replicate it in future studies, specifically those that investigate the impact of different standing conditions e.g., eyes open vs. eyes closed) and populations (e.g., individuals with different balance disorders or age groups) on the agreement between the force-platform and HMD measurements.
4.6. Conclusions
Both devices (force-platforms, HTC Vive) correlate linearly, and both are viable to study postural control, but they cannot be used interchangeably. This is because we saw patterns indicating proportional bias in the plots, specifically, with higher sway the difference between devices grew. When validating new instruments, particularly with an aspiration to replace a gold-standard laboratory instrument with a portable one, correlations should not be used as a measure of agreement. ICCs are the correct statistic for measuring agreement, but do not inform regarding proportional bias. Validation should include Bland-Altman plots of response-scale data. The sample and tasks studied needs to be diverse in terms of balance ability so that any proportional bias present may be evident. Agreement between devices was excellent for variance and lower PSDs, but poor for small and fast movements at frequencies above 1 Hz suggesting that these COP oscillations cannot be captured well via the head.
Supplementary Material
Appendix B: Correlation values for DP and RMSV measures
Appendix A: ICC values for DP and RMSV measures
Appendix C: ICC values for PSD measures
Appendix D: Correlation values for PSD measures
Appendix E: Bland-Altman Plots for PSD measures after log transformation.
Acknowledgement
We thank all participants for taking the time to participate in our study. We thank Zhu Wang, PhD, NYU Courant, for the development of the applications and assistance with all technical aspects of the project. We thank Jennifer Kelly, Santosh Krishnamoorthy and Gene Fu at the New York Eye and Ear Infirmary of Mount Sinai for recruiting patients with vestibular hypofunction and for Katherine Scigliano for conducting vestibular testing. We also thank Brittani Morris, DPT, and Andrew Medlin, SPT, NYU Physical Therapy Department for their assistance with data collection.
Conflicts of Interest and Source of Funding:
The authors declare no financial and personal relationships with other people or organizations that could inappropriately influence this work. This study was funded by an R21DC018101 Early Career Researcher grant from the National Institute on Deafness and Other Communication Disorders (NIDCD). The sponsors had no role in the study design, collection, analysis and interpretation of data; in the writing of the manuscript; or in the decision to submit the manuscript for publication. The content is solely the responsibility of the authors and does not necessarily represent the official views of the National Institutes of Health.
List of Abbreviations:
- COP
Center-of-Pressure
- AP
Anterior-Posterior
- ML
Medio-lateral
- HMD
Head-Mounted Display
- PSD
Power Spectral Density
- ICC
Intra Class Correlation
Data Availability Statement:
The dataset used in this study is available at: https://data.mendeley.com/datasets/jw38kfc8fd/2
References
- 1.Redfern MS, Yardley L, Bronstein AM. Visual influences on balance. J Anxiety Disord. 2001. Apr;15(1–2):81–94. [DOI] [PubMed] [Google Scholar]
- 2.Walsh M, Church C, Hoffmeister A, Smith D, Haworth J. Validation of a Portable Force Plate for Evaluating Postural Sway. Percept Mot Ski. 2021. Feb 1;128(1):191–9. [DOI] [PubMed] [Google Scholar]
- 3.Hageman PA, Leibowitz JM, Blanke D. Age and gender effects on postural control measures. Arch Phys Med Rehabil. 1995. Oct 1;76(10):961–5. [DOI] [PubMed] [Google Scholar]
- 4.Lubetzky AV, Hujsak BD, Kelly JL, Fu G, Perlin K. Control Mechanisms of Static and Dynamic Balance in Adults With and Without Vestibular Dysfunction in Oculus Virtual Environments. PM R. 2018. Nov;10(11):1223–1236.e2. [DOI] [PubMed] [Google Scholar]
- 5.Niam S, Cheung W, Sullivan PE, Kent S, Gu X. Balance and physical impairments after stroke. Arch Phys Med Rehabil. 1999. Oct 1;80(10):1227–33. [DOI] [PubMed] [Google Scholar]
- 6.Paillard T, Noé F. Techniques and Methods for Testing the Postural Function in Healthy and Pathological Subjects. BioMed Res Int. 2015. Nov 12;2015:e891390. [DOI] [PMC free article] [PubMed] [Google Scholar]
- 7.Duarte M, Freitas SMSF. Revision of posturography based on force plate for balance evaluation. Rev Bras Fisioter. 2010. Jun;14(3):183–92. [PubMed] [Google Scholar]
- 8.Piirtola M, Era P. Force Platform Measurements as Predictors of Falls among Older People – A Review. Gerontology. 2006;52(1):1–16. [DOI] [PubMed] [Google Scholar]
- 9.König N, Taylor WR, Baumann CR, Wenderoth N, Singh NB. Revealing the quality of movement: a meta-analysis review to quantify the thresholds to pathological variability during standing and walking. Neurosci Biobehav Rev. 2016;68:111–9. [DOI] [PubMed] [Google Scholar]
- 10.Palmieri RM, Ingersoll CD, Stone MB, Krause BA. Center-of-Pressure Parameters Used in the Assessment of Postural Control. J Sport Rehabil. 2002. Feb 1;11(1):51–66. [Google Scholar]
- 11.Lubetzky AV, Harel D, Kelly J, Hujsak BD, Perlin K. Weighting and Reweighting of Visual Input via Head Mounted Display given Unilateral Peripheral Vestibular Dysfunction. Hum Mov Sci. 2019;Dec 68:102526. [DOI] [PubMed] [Google Scholar]
- 12.Lubetzky AV, Wang Z, Krasovsky T. Head mounted displays for capturing head kinematics in postural tasks. J Biomech. 2019;27(86):175–82. [DOI] [PubMed] [Google Scholar]
- 13.Soltani P, Andrade R. The Influence of Virtual Reality Head-Mounted Displays on Balance Outcomes and Training Paradigms: A Systematic Review. Front Sports Act Living. 2021;2:233. [DOI] [PMC free article] [PubMed] [Google Scholar]
- 14.Saldana SJ, Marsh AP, Rejeski WJ, Haberl JK, Wu P, Rosenthal S, et al. Assessing balance through the use of a low-cost head-mounted display in older adults: a pilot study. Clin Interv Aging. 2017;12:1363–70. [DOI] [PMC free article] [PubMed] [Google Scholar]
- 15.Marchetto J, Wright WG. The Validity of an Oculus Rift to Assess Postural Changes During Balance Tasks. Hum Factors. 2019;61(8):1340–52. [DOI] [PubMed] [Google Scholar]
- 16.Ashida H, Fujimoto K. Comparing measurements of head motion and centre of pressure for body sway induced by optic flow on a head-mounted display. Front Virtual Real [Internet]. 2022. [cited 2022 Dec 7];3. Available from: https://www.frontiersin.org/articles/10.3389/frvir.2022.1026718 [Google Scholar]
- 17.Lubetzky AV, Coker E, Arie L, Aharoni MMH, Krasovsky T. Postural Control under Cognitive Load: Evidence of Increased Automaticity Revealed by Center-of-Pressure and Head Kinematics. J Mot Behav. 2021. Dec 13;1–14. [DOI] [PubMed] [Google Scholar]
- 18.Ranganathan P, Pramesh CS, Aggarwal R. Common pitfalls in statistical analysis: Measures of agreement. Perspect Clin Res. 2017;8(4):187–91. [DOI] [PMC free article] [PubMed] [Google Scholar]
- 19.Euser AM, Dekker FW, le Cessie S. A practical approach to Bland-Altman plots and variation coefficients for log transformed variables. J Clin Epidemiol. 2008. Oct 1;61(10):978–82. [DOI] [PubMed] [Google Scholar]
- 20.Ludbrook J Confidence in Altman–Bland plots: A critical review of the method of differences. Clin Exp Pharmacol Physiol. 2010;37(2):143–9. [DOI] [PubMed] [Google Scholar]
- 21.Lubetzky AV, Kelly JL, Harel D, Roginska A, Hujsak BD, Wang Z, et al. Insight into postural control in unilateral sensorineural hearing loss and vestibular hypofunction. PLOS ONE. 2022. Oct 17;17(10):e0276251. [DOI] [PMC free article] [PubMed] [Google Scholar]
- 22.New York University. Sensory Integration of Auditory and Visual Cues in Diverse Contexts Given Age, Vestibular Hypofunction and Hearing Loss [Internet]. clinicaltrials.gov; 2022. Oct [cited 2022 Dec 18]. Report No.: NCT04479761. Available from: https://clinicaltrials.gov/ct2/show/NCT04479761
- 23.Lubetzky AV, Hujsak BD. A virtual reality head stability test for patients with vestibular dysfunction. J Vestib Res. 2018;28(5–6):393–400. [DOI] [PubMed] [Google Scholar]
- 24.Soames RW, Atha J. The spectral characteristics of postural sway behaviour. Eur J Appl Physiol. 1982. Aug 1;49(2):169–77. [DOI] [PubMed] [Google Scholar]
- 25.Lubetzky AV, Harel D, Lubetzky E. On the effects of signal processing on sample entropy for postural control. PloS One. 2018;13(3):e0193460. [DOI] [PMC free article] [PubMed] [Google Scholar]
- 26.Li Z, Liang YY, Wang L, Sheng J, Ma SJ. Reliability and validity of center of pressure measures for balance assessment in older adults. J Phys Ther Sci. 2016. Apr;28(4):1364–7. [DOI] [PMC free article] [PubMed] [Google Scholar]
- 27.Quatman-Yates CC, Lee A, Hugentobler JA, Kurowski BG, Myer GD, Riley MA. Test-retest consistency of a postural sway assessment protocol for adolescent athletes measured with a force plate. Int J Sports Phys Ther. 2013. Dec;8(6):741–8. [PMC free article] [PubMed] [Google Scholar]
- 28.Pau M, Kim S, Nussbaum MA. Does load carriage differentially alter postural sway in overweight vs. normal-weight schoolchildren? Gait Posture. 2012. Mar;35(3):378–82. [DOI] [PubMed] [Google Scholar]
- 29.Koo TK, Li MY. A Guideline of Selecting and Reporting Intraclass Correlation Coefficients for Reliability Research. J Chiropr Med. 2016. Jun;15(2):155–63. [DOI] [PMC free article] [PubMed] [Google Scholar]
- 30.Altman DG, Bland JM. Measurement in Medicine: The Analysis of Method Comparison Studies. J R Stat Soc Ser Stat. 1983;32(3):307–17. [Google Scholar]
- 31.Bland JM, Altman DG. Measuring agreement in method comparison studies. Stat Methods Med Res. 1999;8(2):135–60. [DOI] [PubMed] [Google Scholar]
Associated Data
This section collects any data citations, data availability statements, or supplementary materials included in this article.
Supplementary Materials
Appendix B: Correlation values for DP and RMSV measures
Appendix A: ICC values for DP and RMSV measures
Appendix C: ICC values for PSD measures
Appendix D: Correlation values for PSD measures
Appendix E: Bland-Altman Plots for PSD measures after log transformation.
Data Availability Statement
The dataset used in this study is available at: https://data.mendeley.com/datasets/jw38kfc8fd/2


