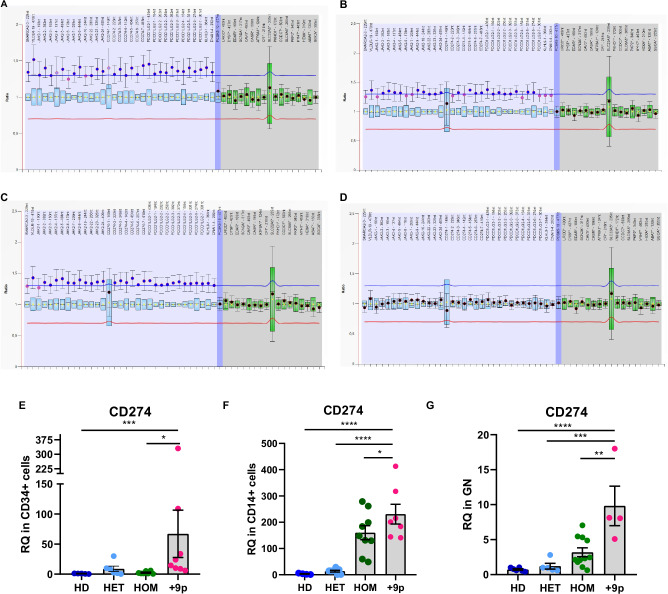
Fig. 2. Assessment of chromosome 9 trisomy and CD274 expression in hematopoietic cell subpopulations.
MLPA profiling of chromosome 9 copy number status in CD34+ cells (A), CD14+ cells (B), Granulocytes (C), or CD3+ cells (D) from patient #2. Labels on the horizontal axis list the genomic regions detected by MLPA probes, while on the vertical axis, the ratio of each probe signal between the patient and the reference samples is shown. The light blue region highlights the signal ratio of probe mapping on chromosome 9p, whereas the blue region represents the signal ratio of the probe mapping on chromosome 9q. The gray region highlights the signal ratio of reference probes. The horizontal lines represent the copy number thresholds beyond which an amplification (blue line) or a deletion (red line) is identified by Coffalyser.net software. Evaluation of CD274 expression at the transcriptional level in (E) CD34+ cells (n = 5 HD, n = 6 HET, n = 7 HOM, n = 8 + 9p), (F) CD14+ cells (n = 4 HD, n = 8 HET, n = 9 HOM, n = 7 + 9p) or (G) Granulocytes (n = 6 HD, n = 5 HET, n = 10 HOM, n = 5 + 9p) from JAK2-mutated MPN patients and healthy donors. Each barplot represents the relative quantity of CD274 mRNA quantified by means of qRT-PCR, whereas dots represent individual values. Results are presented as mean + SEM. Abbreviations: RQ = relative quantity; HD = healthy donors; HET = JAK2-mutated heterozygous patients; HOM = JAK2-mutated homozygous patients; +9p = JAK2-mutated patients with 9p trisomy. *p < 0.05; **p < 0.01; ***p < 0.001; ****p < 0.0001.

