

Abstract
Besides many efforts on the detection and quantification of reactive oxygen and nitrogen species (RONSs) in the aqueous media activated by the cold atmospheric plasma, to get a better insight into the dominant mechanism and reactive species in medical applications, a challenge still remains in monitoring the real-time evaluation of them. To this end, in the present work, relying on the photonic technology based on the time-resolved phosphorescence spectroscopy, real-time tracking of RONSs concentration in treated aqueous media is achieved by following the dissolved oxygen (DO) production/consumption. Using a photonic-based dissolved oxygen sensor, the dependence of real-time RONS concentration evaluation of plasma activated medium on plasma nozzle distance, non-thermal plasma jet exposure time, various culture media, and presence of cells is investigated. Analyzing the results, the activation parameters including the time of reaching maximum RONS concentration after treatment and defined activation parameter  of the treated media for each case is measured and compared together. Moreover, employing the scavengers related to two involved ROSs, the dominant chemical reactions as well as ROS contributed in the DMEM medium is determined. As a promising result, the obtained correlation between the real-time DO level and viability and toxicity of the cancer cells, MCF-7 breast cancer cells, could enable us to exploit the present photonic setup as an alternative technique for the biological assessment.
Supplementary Information
The online version contains supplementary material available at 10.1038/s41598-024-73585-4.
Keywords: Cold atmospheric plasma jet, Reactive oxygen-nitrogen species, Culture medium, Real-time oxygen sensing, Time-resolved spectroscopy, Extracellular dissolved oxygen
Subject terms: Fluorescent dyes, Chemical physics, Cancer therapy
Introduction
Plasma medicine is an emerging field that has exhibited tremendous potential in the last decade. With the promising prospect of new medical and biomedical treatment, direct cold atmospheric plasma (CAP) jet treatment and indirect ones corresponding to plasma-activated medium (PAM) are in the spotlight. Diverse studies have shown the effect of non-thermal plasma on the decontamination of microorganisms1–6, wound healing7–9, water purification10,11, dental treatment12–14, blood coagulation15 and also the selective killing of cancer cells through induction of apoptosis16–27. The CAP consists of electrons, ions, photons, electric and magnetic fields, free radicals, as well as RONS. The RONS such as 1O2 (singlet oxygen), atomic oxygen (O), H2O2 (hydrogen peroxide), OH· (hydroxyl radical), HO2· (hydroperoxyl radicals), O2·− (superoxide anions), O3 (ozone), NO2− (nitrite), NO3− (nitrate), ONOO− (peroxynitrite) and NO· (nitric oxide) transferred to liquids through secondary reactions are known as key factor associated with biological response of treated medium. The presence of RONS in balanced levels is necessary for apoptosis, immunity, and cell differentiation. Moreover, within a certain range, they exhibit anti-cancer selectivity through DNA damage, and failure of antioxidant defense without harming healthy cells28. However, the imbalance between their production rate and available antioxidants can damage many organelles and cellular processes and eventually disrupt the normal physiology of cells. Therefore, real-time monitoring of RONS concentration in the activated medium not only has a crucial role in the clinical implementation of plasma therapy but also in understanding the dominant species in each therapeutic process.
Until now, the common methods of colorimetric and fluorescence kits, electrochemical sensors, in-situ absorption spectroscopy, and electron paramagnetic resonance (EPR) were employed to measure the concentration of the RONS in the medium29. The kits and EPR methods, in addition to relatively high cost and lack of affordability, provide only the possibility of a single measurement of the concentration at a specific time and the electrochemical method suffers from repetitive calibration. In the present work, relying on photonic technology based on time-resolved phosphorescence spectroscopy, real-time measurement of RONS concentration in treated aqueous media was achieved. One of the main advantages of the employed method in this investigation is that, the time-resolved phosphorescence spectroscopy is immune to noises caused by photobleaching/quenching and background signals compared to the common intensity-based measurements which leads to accurate concentration measurements. In this method, by using an oxygen probe to measure the concentration of DO, as a key molecule in the production of RONS, the rate of RONS production/consumption in a medium was monitored. Basically, the proposed photonic-based oxygen sensor contains an indicator substance which its photoluminescence (PL) lifetime alters due to the reaction with the DO in the medium. The platinum porphyrin oxygen sensor is excited using a 30 ns pulsed LED light source. Thereafter, using a fast photodetector with a 60 ns rise time, the sensor PL lifetime was calculated in real-time using a one-term Levenberg–Marquardt algorithm. By reducing the concentration of the DO in the medium to produce the RONS, the PL lifetime of the oxygen sensor increases.
In this work, the proposed photonic technique for real-time tracking of RONS generation and consumption following argon CAP plasma jet delivery was assessed with three different biological media of Deionized water, Dulbecco’s Modified Eagle Medium (DMEM), DMEM + 10% Fetal bovine serum (FBS) treated with argon (Ar) CAP jet. In this perspective, various plasma parameters including the distance between the plasma nozzle and the treated medium surface, and the plasma exposure time on the concentration of the RONS species in three media were measured instantaneously. To determine the dominant ROS in the DMEM culture medium, two scavengers of sodium pyruvate (SP) and terephthalic acid (TA) were adopted to remove H2O2 and OH· species in the medium, respectively. Last but not least, besides evaluating the cell’s present role in extracellular RONS concentration in the treated cell-culture medium, the correlation between the real-time DO concentration curve and the proliferation and apoptosis of cells was found and confirmed by the MTT (3-(4,5-Dimethylthiazol-2-yl)-2,5-Diphenyltetrazolium Bromide) test.
Materials and methods
Plasma jet device
The CAP used in this work was based on the dielectric barrier discharge method. The components of this jet include a quartz dielectric with an inner diameter of 3 mm and an outer diameter of 5 mm. The inner electrode, which was surrounded by dielectric, was stainless steel and its diameter was 1.6 mm. The plasma jet consists of a 12 cm long, 7 mm inner diameter Teflon assembly merging the quartz capillary and the outer stainless steel grounded electrode, wrapped around this Teflon body. The RF power supply with a frequency of 13.56 MHz was purchased from Basafan. The power of the power supply was set to 35 W. To control the flow rate of the Ar carrier gas, a mass flowmeter by Breezens was used. The gas flow rate during the experiment was set to 4 SLM.
Chemicals
High glucose DMEM culture medium, DMEM/F12, Trypsin-EDTA, and penstrep were purchased from Bio Idea and FBS from DNA BioTech. TA scavenger was purchased from Merck and was used to remove hydroxyl radical oxygen species from DMEM. SP scavenger was obtained from Sigma Aldrich and was used to remove hydrogen peroxide from DMEM. Polydimethylsiloxane (PDMS) was purchased from Dow Corning and was employed to glue the oxygen sensor to the bottom of the wellplate due to its biocompatibility.
Preparation of the media
48-well plate was used for the experiment. First, the oxygen sensor was attached to the bottom of the well plate with a drop of PDMS and placed in an oven at a temperature of 80 °C for 2 h. The height of each plate well is 1.7 cm. In the well of the plate where the sensor was located either 1 mL of DI water or DMEM or DMEM + 10% FBS or DMEM containing 1 mg SP scavenger or DMEM containing TA scavenger was poured. 0.008 g of TA powder and 0.004 g of sodium hydroxide were dissolved in 1 mL of DI water to dissolve TA in the medium. The obtained solution was allowed to dissolve well for 1 h. 10 µL of the prepared solution was added to 1 mL of DMEM.
Optical spectroscopy
A 4-channel optical spectrometer Avantes model AVS-DESKTOP-USB2 was used to measure the optical spectrum of the Ar plasma jet, the absorption spectrum of the DMEM, and the absorption spectrum of the photonic sensor. It has a 2048 Pixels CCD linear array and a wavelength range of 197–1072 nm with a resolution of 0.19 nm.
Oxygen sensor
To prepare the oxygen-sensitive photonic sensor, platinum metal complex platinum (II)-5,10,15,20-tetrakis-(2,3,4,5,6-pentafluorphenyl)-porphyrin (PtTFPP) was purchased from Frontiers scientific. 10 mg of PtTFPP was combined with 2 mL of toluene and placed on the stirrer for 10 min until they were completely dissolved. To prepare the oxygen-permeable polymer matrix, 1 g of polystyrene (PS) granules were obtained from Tabriz Petrochemical, dissolved in 5 mL of toluene, and placed on the stirrer for 1 h until these two were well combined. Finally, both prepared compounds were mixed and stirred again for 10 min until the desired composite was obtained. 100 µL of the prepared composite was poured on a microscopic glass slide to form a 0.1 mm thick film. Then, the sensor was placed in a 53 L Memmert oven for 2 h at a temperature of 80 °C to remove the remaining toluene. Finally, using a biopsy punch with a diameter of 8 mm, the oxygen sensor was punched in the form of a disk. Both sides of all the sensors were coated with biocompatible PDMS hydrogel to prevent toxicity and ensure the biocompatibility of the sensors in the vicinity of the cells. Thus, 1 mL of precured PDMS and 100 µL initiator were thoroughly mixed and 10 µL of the mixture was injected on the sensor surface. Then, a 10 μm layer was created on each side of the sensor using a spin-coating machine with a spin speed of 2500 rpm for 5 min. Afterward, the sensors were placed in an oven for 2 h at a temperature of 80 ℃ finalize the preparation of the PDMS layers.
Time-resolved phosphorescence spectroscopy
A homemade oxygen meter was used to measure the concentration of DO in different biological media in real-time. The oxygen meter includes a blue pulsed LED light source. When the LED light excites the oxygen-sensitive film, the sensor emission in the red spectrum was collected using a 3 cm lens on a photodiode. The PtTFPP metal complex has absorption in the blue region, so a blue light source was used for its excitation. The PtTFPP oxygen-sensitive phosphorescent indicator was excited using a 460 nm LED excitation source. DOs in the medium penetrate the matrix and interact with the excited indicator molecules. Interaction between the indicator and oxygen (O2) molecules changes the PL lifetime of the indicator30. Thus, the excited indicator relaxes from the excited state to the ground state and emits light. Using an OSRAM SFH2704 silicon fast photodetector and the Levenberg–Marquardt algorithm, PL data was recorded every 2.9 s and is fitted with a one-term exponential function. In this system, a combination of two rail-to-rail amplifiers was used to amplify the PL signal. A 10-bit analog-to-digital signal converter ADS820 transfers the digital signals to the microprocessor and a computer finally processes this information. Corresponding PL lifetimes were calculated and displayed every 2.9 s.
Sensor calibration
The sensor was calibrated to make a correlation between the sensor PL lifetimes and the DO concentrations. For this work, a Clark electrochemical sensor was used, which shows the DO concentration in the medium in terms of ppm. To calibrate the Clark electrode, 1 g of sodium sulfate (Na2SO4) was dissolved in 100 mL of DI water, and then 0.001 g of cobalt chloride was added to the solution as a catalyst. Na2SO4 alone can remove the DO of the water, however cobalt chloride (CoCl2) accelerates this process. Clark electrode was held above the prepared salt solution very close to the surface to calibrate the upper level (100%) of DO concentration. Subsequently, it was placed inside the stirred solution to calibrate the lower level of DO (0%). With this process, the Clark electrode was calibrated. Therefore, to calibrate the optical oxygen sensor using the Clark electrode, first, the DO concentration inside a tank containing DI water was reduced to 0 ppm purging nitrogen (N2) gas. Then, the 0% DI water was pumped into the tank in the area of the oxygen sensor, and for every 0.1 ppm, the DO concentration and corresponding PL lifetime were recorded. Thus, the sensor calibration function was achieved for further applications. The calibration setup is depicted in Fig. 1.
Fig. 1.
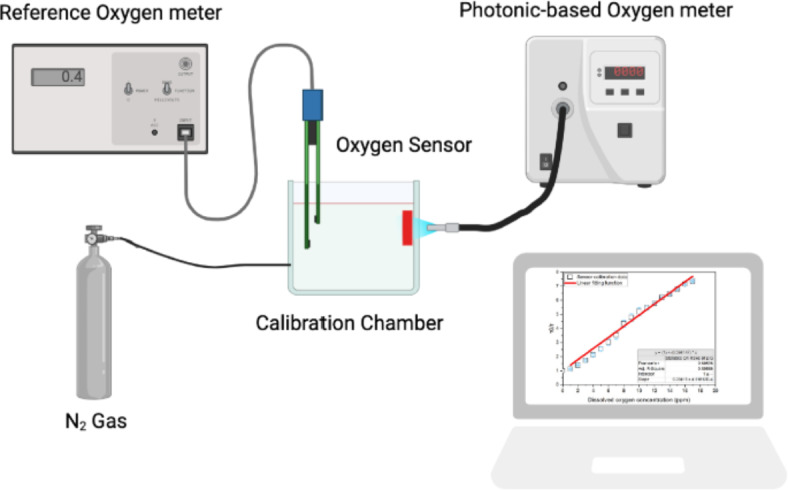
Photonic-based sensor calibration setup including reference oxygen sensor, photonics-based oxygen sensor, calibration gauge and N2 cylinder.
Temperature and humidity sensor
To measure the temperature and humidity of the surrounding environment before carrying out the experiment, the humidity and temperature sensor model DHT11 was used with an accuracy of 1 °C in temperature measurement and with an accuracy of 5% in humidity measurement. To measure the temperature of biological media treated with plasma, before and after the treatment, the DS18B20 temperature sensor made by Dallas Instrument was used.
MCF-7 cell culture
To cultivate this cell line, a complete culture medium containing DMEM/F 12, FBS, and penstrep was used, with FBS at a ratio of 10% to the complete culture medium and penstrep at a ratio of 0.5%. 5 mL of the prepared culture medium was poured into the T25 flask containing cells. The flask was placed inside the incubator with 95% humidity and 5% CO2 at the temperature of 37 ℃. 0.05% trypsin was used for passage of the cell line with 2000 rpm centrifugation.
MCF-7 cell line
The MCF cell line was purchased from IBRC. The cell line belongs to a 47-year-old woman.
Results and discussion
The flowchart of the present work is shown in Fig. 2. It is designed to study the dependence of RONS concentration in a plasma-activated medium on culture medium, plasma exposure time, nozzle distance, and cell presence, based on the real-time monitoring of DO concentration by the proposed photonic technique using optical oxygen sensor. The other parameters such as frequency (13.56 MHz) and power (35 W) of the power supply as well as gas flow (4 SLM) and gas type (Argon) were kept constant in the experiments. To this end, a schematic of the setup is shown in Fig. 3, including an Ar plasma jet powered by an RF power supply, optical oxygen sensor, and time-resolved phosphorescence spectroscopy and controller devices.
Fig. 2.

Work flowchart of CAP distance, exposure time and culture medium investigation based on time-resolved spectroscopy of a DO sensor.
Fig. 3.

CAP treatment setup.
Figure 4a illustrates the UV-NIR optical spectrum of the Ar plasma jet. Emission peaks corresponding to some gas-phase RONS appear in the UV spectrum and the excited Ar molecules in the near-infrared spectrum. The oxygen sensor is required to be calibrated to establish a relation between the PL lifetime and the DO concentration. Figure 4b shows the calibration data of the sensor fitted with the single-site Stern-Volmer function31. The ratio of the PL lifetime at zero oxygen ( ) over the lifetime (
 ) for a wide range of DO concentrations is depicted in this figure. By measuring the PL lifetime it is possible to calculate its corresponding DO concentration.
Fig. 4.

(a) Plasma gas phase radicals in the UV spectrum and excited molecules in the near-infrared spectrum. (b) Calibration function of the photonic-based oxygen sensor based on the Stern–Volmer equation.
A typical example of real-time DO concentration of plasma-activated DMEM medium following a 180 s long exposure at the distance of 7 mm from the plasma to the liquid surface is shown in Fig. 5. The DO concentration of the medium was monitored for 10 min before applying the plasma, approving the consistency of the DO level of the oxygen sensor, placed at the bottom of the well plate. It must be mentioned that as a control case applying only Ar without discharge has not considerable change on the DO level.
Fig. 5.

DO variation after CAP treatment for DMEM medium for 180 s exposure time in the 7 mm distance.
Immediately after the plasma treatment, the real-time DO concentration in the medium was recorded. When the concentration of DO in the medium is reduced, the rate of oxygen penetration into the PS matrix of the oxygen sensor is reduced consequently. As a result, there is less collisional interaction with the excited PtTFPP molecules which increases the PL lifetime. As shown in the figure, firstly after plasma treatment the PL lifetime of the sensor increased, which shows that the DO concentration in the medium is decreasing. Since the O2 molecule is one of the main elements in the production of RONS in the medium, consumption of DO is related to increasing of RONS in the medium. The RONSs exhibit a limited lifetime, thus after a while the DO concentration reaches a minimum and the curve behavior is reversed until it approximately returns to its original level. To estimate the activity of the medium during the various treatment conditions, an activation parameter of the medium ( ) was defined as the surface area between the DO curve and the zero DO level. The change in the treated medium temperature was also measured. The initial temperature of the surrounding environment and DMEM were measured as 26 °C and 25.62 °C, respectively. Instantly after applying the plasma, the temperature of the DMEM was measured as 24.31 °C. This reduction in the temperature is due to the evaporation caused by the surface layer of the liquid, the creation of a vortex, and the presence of a buoyancy force32,33. Moreover, in the treatment by CAP, there is some evaporation from the surface of the medium. The higher the gas flow rate, the higher the evaporation rate. In this experiment, the gas flow rate was 4 SLM and there was a significant percentage of evaporation.
Evaluation of real-time RONS concentration versus plasma exposure time
In the first step, the dependence of the real-time DO consumption and RONS production in the DMEM medium on the plasma exposure time was investigated. To this end, the exposure times of 30, 60, 90, and 180 s were examined to monitor the real-time changes in the DO level, where the distance between the plasma nozzle and the DMEM surface was fixed at 7 mm. According to Fig. 6a, increasing the exposure time of plasma from 30 s to 180 s, the level of DO decreases during and right after plasma treatment, indicating the increment of RONS production rate by exposure time in agreement With RONS transfer from the gas phase to the liquid sample. Moreover, increasing the evaporation of liquid by the exposure time, the OH· mainly formed from water vapor could cause the increment of the concentration of the RONS in the gas phase and also the liquid phase by enhancement of H2O2 level. The minimum DO concentration reduces from 3 ppm to 5.5 ppm over time.
Fig. 6.

(a) The effect of exposure time on the DO variation. (b) The effect of plasma distance on the DO variation.
According to Table 1, for the plasma exposure time of 30 s, the DO level of DMEM reached its minimum in 29.2 min after treatment, defined as tmin,DO. This parameter is not dependent on exposure time, where the values are approximately 27.3 min and 29.8 min for 60 s and 90 s, respectively. It is suspected that the measured almost constant minimum DO time reveals that a single mechanism is involved in all four experiments.
Table 1.
Resulting data for the effect of exposure time in DMEM medium at the distance of 7 mm.

The activation parameter,  , and the temperature of the culture medium before (Ti) and after (Tf) plasma treatment for various plasma exposure times are listed in the table. As can be seen,
  is raised by increasing the plasma treatment time. In addition, the effect of exposure time of 30 s, 60 s, 90 s, and 180 s for the DMEM at two other distances of 14 and 21 mm was investigated. Moreover, the effect of exposure time was studied for two media of DI water and DMEM + 10% FBS at 3 distances of 7, 14, and 21 mm and the results are provided in the supplementary file (Supplementary Figs. S1, S2, and S3).
Evaluation of real-time RONS concentration following DMEM exposure for different nozzle-sample gap distances
In the second stage, to evaluate the effect of plasma nozzle distance on the RONS generation/consumption in the DMEM, the real-time DO measurement was carried out for 180 s plasma treatment of DMEM at three distances of 7, 14, and 21 mm, presented in Fig. 6b. As can be found, by increasing the distance between the plasma nozzle and the treated surface from 7 to 21 mm, the  DO and as a result, the RONS generation in the medium decreases. This means that the concentration of RONS produced in the aqueous phase has an inverse relationship with the plasma distance. The greater the distance between the plasma nozzle and the surface, the lower its effect on the medium. At shorter distances, the species produced in the gas phase by the discharge have more opportunity to instantly reach the liquid phase and thereby perform repetitive chemical reactions. When the distance increases, these species in the gas phase do not have enough time to reach the liquid phase, so they dramatically disappear after a limited time and reduce the amount of RONS concentration in the medium. For 180 s plasma treatment, increasing the distance from 7 to 21 mm, the
  DO changes from 5 to 2.5 ppm. For DMEM in three treatment durations of 30, 60, and 90 s and two media of DI water and DMEM + 10% FBS in all four mentioned exposure times, the effect of plasma distance was measured and available in the supplementary file (Supplementary Figs. S4, S5, and S6).
Realtime RONS concentration measurement for different culture medium
In the third step, the effect of culture medium type on the real-time RONS production at the distance of 7 mm of nozzle from the treated surface and the plasma exposure time of 180 s was studied for three media including DI water as a basic medium, DMEM, and DMEM + 10% FBS. As a first output, one can clearly find that the maximum RONS be achieved for the DMEM rather than basic DI water, while it is reverse for the DMEM + 10% FBS due to the presence of albumin protein with antioxidant properties to trap RONS such as OH·34. On the other hand, comparing the tail of the graphs in Fig. 7a, the time it takes for DI water and DMEM + 10% FBS to recover the initial DO concentration level is shorter than DMEM. It shows the plasma-treated culture media remain longer active compared to basic ones and it is greater for DMEM in comparison with the DMEM + 10% FBS solution. This can be due to the presence of different types of amino acids, vitamins, glucose, and inorganic salts in high-glucose DMEM. Finally, the obtained activation parameters for three activated media have been reported in Table 2. As can be found,  is equal to 50,015 ppm.s for DMEM, which is more than DI water and DMEM+10% FBS with values of 20,341 ppm.s, and 25,314 ppm.s, respectively. More results for various plasma nozzle distances and plasma exposure times are available in the supplementary file (Supplementary Figs. S7, S8, and S9).
Fig. 7.

(a) The effect of different media on the DO variation for the exposure time of 180 s in the distance of 7 mm. (b) Change in DO concentration for all three media at the distance of 21 mm and the exposure time of 30 s. (c) application of SP, TA and simultaneous application of both in DMEM media.
Table 2.
The effect of different culture media at the distance of 7 mm and the exposure time of 180 s.

To examine the nozzle distance and exposure time effects on the activation of three media, the DO concentration of three media at the distance of 21 mm and the exposure time 30 s is documented in Fig. 7b. From this figure, the DO level is approximately equal for all three media of DI water, DMEM, and DMEM + 10% FBS. For this distance and treatment time, the RONS level in the medium was not considerable due to the relatively large distance to the treated surface and the short exposure time. In this sense, the species did not have sufficient time to transfer from the gaseous phase to the liquid ones. For this reason, in this timing, the dip of the diagram disappeared as is clear in the Fig. 7b. For 30 and 60 s treatment of DMEM + 10% FBS at the distance of 14 mm, and for 60s at the distance of 21 mm, the conditions were similar, where the corresponding graphs are available in the supplementary file (Supplementary Figs. S8a, b, S9a).
Realtime monitoring of dominant RONS in plasma-activated DMEM
In this section, to track the real-time concentration of the dominant species of RONS including OH· and H2O2 in activated DMEM, sodium pyruvate (SP) and terephthalic acid (TA) scavengers were employed separately and simultaneously for the treated DMEM by the plasma. Plasma nozzle distance and plasma exposure time of respectively 7 mm and 30 s were set constant during these experiments. In Fig. 7c, the pink triangles represent the DMEM + SP and the green circles show the DMEM + TA, whereas the red squares illustrate the DMEM in the absence of scavengers. Comparing the graphs, the considerably deeper dip corresponding to the DMEM in the absence of scavengers than the other two media including the scavengers shows the critical role of the OH· and H2O2 in the activity of the treated media. From the DO concentration graph of DMEM + TA, it can be observed that by removing the OH· in the medium, the DO level increases compared to DMEM. In agreement with the results, removing the OH· from the medium, the hydrogen atom (H) by the reaction cannot be created and so, regarding the reaction
  , the DO in the medium cannot be consumed. On the other hand, according to the reaction
  , if the OH· is removed from the medium, the O2 cannot be consumed to produce H2O2 as a more stable RONS in the medium. As a result, this can be another reason for the higher concentration of DO in the medium after the removal of the OH· compared to DMEM. It must be mentioned that, by removing the OH·, H2O2 remains in the medium and since it is a more stable RONS, the DO level does not increase significantly. By removing the H2O2, according to the reaction
  , the OH· cannot be consumed in the medium. Due to the reaction
 the concentration of DO inside the medium is significantly higher than DMEM and even than that of DMEM+TA. Comparing the dip corresponding to DMEM + TA and DMEM + SP with DMEM+TA+SP, one can find that with the removal of H2O2, unlike the removal of OH·, the RONS level in the medium is greatly reduced compared to DMEM, which likely indicates that H2O2 is a dominant species in the activated medium rather than its dominant precursor OH·. It could be found from the approximately same behavior of the DMEM+SP compared to the DMEM+TA+SP.
The activation parameters of the different conditions are gathered in Table 3. As can be seen, the  in DMEM is more than the other media, and then DMEM + TA has a larger
  than DMEM + SP + TA and DMEM + SP. Additionally, the results obtained for all three times of 30, 60, and 90 s at a distance of 7 mm and the simultaneous application of TA + SP for the exposure time of 90 s are available in the supplementary file (Supplementary Fig. S10).
Table 3.
The effect of simultaneous and discrete scavengers in DMEM on t min,  DO,
DO,  , Ti and Tf.

Real-time monitoring of RONS concentration in the culture medium containing cells
In the last step, using the optical method for real-time DO detection, the effects of cell presence, MCF-7 breast cancer cells in the present section, on the evaluation of extracellular RONS concentration after CAP treatment was investigated. The designed experiment is a response to raised questions about how the presence of cells influences the production/consumption of the extracellular RONS in the medium after the plasma treatment and whether there is a significant correlation between the real-time RONS evaluation with the viability or toxicity of the cells. For this aim, for two plasma exposure times of 90 s and 180 s at the nozzle distance of 7 mm, the role of the presence of cells inside the culture medium DMEM/F12 was examined on the DO concentration level of medium, or equivalently the extracellular RONS production/consumption. In Fig. 8a, b, the trend of the graph for the 90s and 180s exposure times in the culture medium containing cells is different from the medium in the absence of cells, where the black squares are related to the change in DO concentration in the absence of cells and the red circles are related to the medium containing cells. As can be seen, for 90 s treatment time, the presence of cells increased the concentration of DO in the medium compared to the sole culture medium. While, in the case of 180 s, the observation was opposite and the concentration of DO in the medium containing cells was lower than in the culture medium in the absence of cells. To find the reason and probable correlation between the DO concentration evaluation and the toxicity of the cells, 24 h MTT tests were performed for both conditions at the same time. Interestingly, Fig. 8c reveals that for the case of the 90 s plasma treatment, the cells entered into their apoptotic phase while, for the case of 180 s, the cells entered the proliferation phase. One can conclude that by entering the cells into the proliferation phase, they consume DO and produce RONS and this is why the DO graph is lower than solely culture medium for 180 s treatment time. On the other hand, for the 90 s exposure time, the cells enter into apoptosis probably by consuming the low level of RONS generated by plasma exposure. These results could raise the idea of using real-time measurement of the DO level as a replacement for biological assays like MTT on qualitative or even quantitative cell toxicity and proliferation assessments.
Fig. 8.
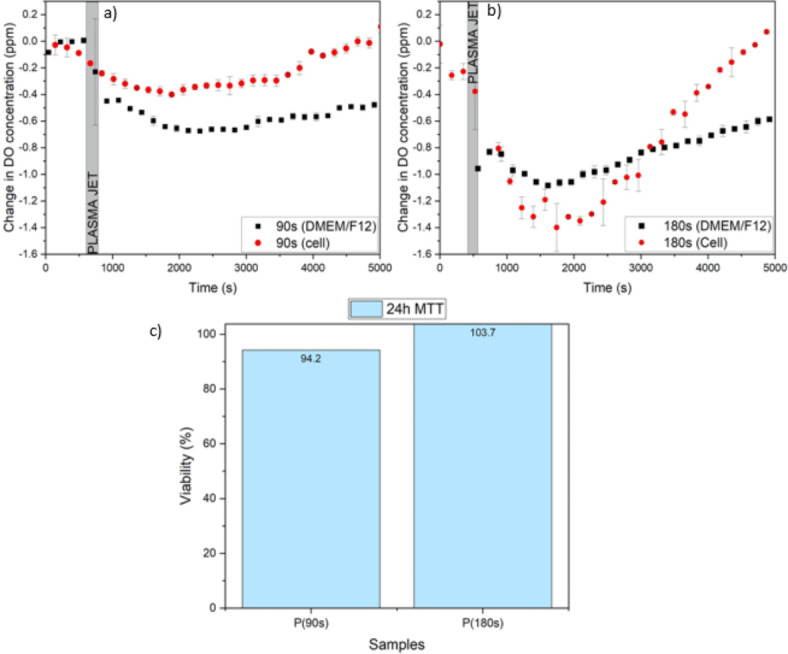
(a) Change in Do concentration for DMEM/F12 medium with and without cells after 90 s plasma treatment. (b) Change in Do concentration for DMEM/F12 medium with and without cells after 180 s plasma treatment. (c) Cell viability after 90 s and 180 s plasma treatment for 24 h treatment.
Conclusions
In this work, the dependence of real-time RONS concentration evaluation of plasma-activated medium on plasma nozzle distance, non-thermal plasma jet exposure time, various culture media, and presence of cells were investigated based on the time-resolved phosphorescence spectroscopy of an oxygen sensor. For this purpose, calibrating the photoluminescence lifetime curves as the output of the oxygen sensor to DO concentration graphs, related to the RONS concentration, the real-time evaluation of the RONSs for four treated media of DI water, DMEM, DMEM + FBS, and DMEM/F12 in the presence and absence of MCF-7 breast cancer cells were compared under the various of therapeutic conditions including 30 s,60 s, 90 s, and 180 s of plasma exposure times and three nozzle distances of 7, 14, and 21 mm. Analyzing the results, the activation parameters including the time of reaching maximum RONS after treatment and defined activation parameter  of the treated media for each case were achieved and compared together. Additionally, by adding SP and TA scavengers, the dominant chemical reactions as well as ROS produced in the DMEM medium with DO consumption were identified.
It was observed that the real-time RONS concentration level corresponded to the DO level in all three activated media of DI water, DMEM, and DMEM + 10% FBS increases by plasma exposure time and decreases by the plasma nozzle distance. Moreover, comparing the defined activation parameter for all three media, it was greater for activated DMEM than the basic medium of DI water due to DMEM’s nutritious ingredients while it was the opposite for activated DMEM + 10% FBS due to the involved antioxidant properties of albumin protein in this medium. In all experiments, the temperature of the medium treated with plasma was reduced due to surface evaporation caused by the formation of a vortex and the presence of a buoyancy force. Last but not least, it was shown that the presence of the cancer cells in the proliferation phase causes to settle the DO concentration curve to be lower than the sole culture medium as a basic one while, it was reversed for the case at the apoptosis phase. It seems the obtained correlation between the DO level and viability and toxicity of the cells could enable us to exploit the present photonic technique as a replacement for the biological assays in this regard like the MTT test.
At the end, the sensitivity of the employed photonic-based diagnostic in this study could likely be optimized for specific biological applications. Selecting a dedicated light illumination source and optical setup together with enhancing the phosphorescence detection device sensitivity for challenging conditions should lead to the broad-range applicability of the method.
Electronic supplementary material
Below is the link to the electronic supplementary material.
Acknowledgements
I gratefully acknowledge the input and friendship of many colleagues in doing this multidisciplinary field research; of many close associates, Dr. Elahe Amini and Amin zamani-boroujeni. This work was funded by Iran National Science Foundation (INSF), grant no. 4020795.
Author contributions
D.T. and F.K.M.H. performed experimental work. D.T. performed sensor fabrication, optical setup, and cold plasma jet treatments. D.T. and F.K. M.H. carried out cellular assay preparation, data collection, and visualization. D.T., E.H., and K.H. prepared the draft of the manuscript. E.H., E.R., K.H., and H.M. performed supervision, conceptualization, investigation, methodology، validation, and proofing. K.H. performed data analysis. All authors read and approved the final version of the paper.
Data availability
Data is provided within the manuscript or supplementary information files.
Declarations
Competing interests
The authors declare no competing interests.
Footnotes
Publisher’s note
Springer Nature remains neutral with regard to jurisdictional claims in published maps and institutional affiliations.
References
- 1.Nicol, M. J. et al. Antibacterial effects of low-temperature plasma generated by atmospheric-pressure plasma jet are mediated by reactive oxygen species. Sci. Rep.10, 3066. 10.1038/s41598-020-59652-6 (2020). [DOI] [PMC free article] [PubMed] [Google Scholar]
- 2.Shaw, P. et al. Bacterial inactivation by plasma treated water enhanced by reactive nitrogen species. Sci. Rep.8, 11268. 10.1038/s41598-018-29549-6 (2018). [DOI] [PMC free article] [PubMed] [Google Scholar]
- 3.Hoon Park, J. et al. A comparative study for the inactivation of multidrug resistance bacteria using dielectric barrier discharge and nano-second pulsed plasma. Sci. Rep.5, 13849. 10.1038/srep13849 (2015). [DOI] [PMC free article] [PubMed] [Google Scholar]
- 4.Liao, X. et al. Inactivation mechanisms of non-thermal plasma on microbes: a review. Food Control, 75 83–91 (2017). 10.1016/j.foodcont.2016.12.021
- 5.Maho, T. et al. Appl. Sci.11 9598, 10.3390/app11209598. (2021). [Google Scholar]
- 6.Trebulová, K., Krčma, F., Kozáková, Z. & Matoušková, P. Impact of microwave plasma torch on the yeast Candida Glabrata. Appl. Sci.10, 5538. 10.3390/app10165538 (2020). [Google Scholar]
- 7.Kubinova, S. et al. Non-thermal air plasma promotes the healing of acute skin wounds in rats. Sci. Rep.7, 45183. 10.1038/srep45183 (2017). [DOI] [PMC free article] [PubMed] [Google Scholar]
- 8.Metelmann, H. R., Von Woedtke, T. & Weltmann, K. D. Comprehensive Clinical Plasma Medicine: Cold Physical Plasma for Medical Application (Springer, 2018).
- 9.Boeckmann, L. et al. Cold atmospheric pressure plasma in wound healing and cancer treatment. Appl. Sci.10, 6898. 10.3390/app10196898 (2020). [Google Scholar]
- 10.Barjasteh, A. et al. Recent progress in applications of non-thermal plasma for water purification, bio-sterilization, and decontamination. Appl. Sci.11, 3372. 10.3390/app11083372 (2021). [Google Scholar]
- 11.Zhou, R. et al. Cold atmospheric plasma activated water as a prospective disinfectant: the crucial role of peroxynitrite. Green Chem.20, 5276–5284. 10.1039/C8GC02800A (2018). [Google Scholar]
- 12.Hoffmann, C., Berganza, C. & Zhang, J. Cold atmospheric plasma: methods of production and application in dentistry and oncology. Med. Gas Res.3, 1–15. 10.1186/2045-9912-3-21 (2013). [DOI] [PMC free article] [PubMed] [Google Scholar]
- 13.Aline, C. et al. Koga-Ito, Applications of cold atmospheric pressure plasma in dentistry. Appl. Sci.11, 1975 (2021). 10.3390/app11051975
- 14.Li, H. P. et al. Translational plasma stomatology: applications of cold atmospheric plasmas in dentistry and their extension. High. Voltage. 2, 188–199. 10.1049/hve.2017.0066 (2017). [Google Scholar]
- 15.Kalghatgi, S., Friedman, G., Fridman, A. & Clyne, A. M. Endothelial cell proliferation is enhanced by low dose non-thermal plasma through fibroblast growth factor-2 release. Ann. Biomed. Eng.38, 748–757. 10.1007/s10439-009-9868-x (2010). [DOI] [PubMed] [Google Scholar]
- 16.Bauer, G., Sersenová, D., Graves, D. B. & Machala, Z. Cold atmospheric plasma and plasma-activated medium trigger RONS-based tumor cell apoptosis. Sci. Rep.9, 14210. 10.1038/s41598-019-50291-0 (2019). [DOI] [PMC free article] [PubMed] [Google Scholar]
- 17.Vandamme, M. et al. Antitumor effect of plasma treatment on U87 glioma xenografts: preliminary results. Plasma Processes Polym.7, 264–273. 10.1002/ppap.200900080 (2010). [Google Scholar]
- 18.Keidar, M. et al. Cold plasma selectivity and the possibility of a paradigm shift in cancer therapy. Br. J. Cancer. 105, 1295–1301. 10.1038/bjc.2011.386 (2011). [DOI] [PMC free article] [PubMed] [Google Scholar]
- 19.Rasouli, M. et al. Plasma-activated medium induces apoptosis in chemotherapy-resistant ovarian cancer cells: high selectivity and synergy with carboplatin. Plasma Processes Polym.18, 2100074. 10.1002/ppap.202100074 (2021). [Google Scholar]
- 20.Liu, Y. et al. Selective effects of non-thermal atmospheric plasma on triple-negative breast normal and carcinoma cells through different cell signaling pathways. Sci. Rep.7, 7980. 10.1038/s41598-017-08792-3 (2017). [DOI] [PMC free article] [PubMed] [Google Scholar]
- 21.Van Boxem, W. et al. Anti-cancer capacity of plasma-treated PBS: Effect of chemical composition on cancer cell cytotoxicity. Sci. Rep.7, 16478. 10.1038/s41598-017-16758-8 (2017). [DOI] [PMC free article] [PubMed] [Google Scholar]
- 22.Kaushik, N. et al. Responses of solid tumor cells in DMEM to reactive oxygen species generated by non-thermal plasma and chemically induced ROS systems. Sci. Rep.5, 8587. 10.1038/srep08587 (2015). [DOI] [PMC free article] [PubMed] [Google Scholar]
- 23.Tornin, J. et al. Pyruvate plays a main role in the antitumoral selectivity of cold atmospheric plasma in osteosarcoma. Sci. Rep.9, 10681. 10.1038/s41598-019-47128-1 (2019). [DOI] [PMC free article] [PubMed] [Google Scholar]
- 24.Lin, A. et al. Non-thermal plasma as a unique delivery system of short‐lived reactive oxygen and nitrogen species for immunogenic cell death in melanoma cells. Adv. Sci.6, 1802062. 10.1002/advs.201802062 (2019). [DOI] [PMC free article] [PubMed] [Google Scholar]
- 25.Lee, S., Lee, H., Bae, H., Choi, E. H. & Kim, S. J. Epigenetic silencing of miR-19a-3p by cold atmospheric plasma contributes to proliferation inhibition of the MCF-7 breast cancer cell. Sci. Rep.6, 30005. 10.1038/srep30005 (2016). [DOI] [PMC free article] [PubMed] [Google Scholar]
- 26.Kim, S. J. & Chung, T. H. Cold atmospheric plasma jet-generated RONS and their selective effects on normal and carcinoma cells. Sci. Rep. 20332 (2016). 10.1038/srep20332 [DOI] [PMC free article] [PubMed]
- 27.Machala, Z., Tarabová, B., Sersenová, D., Janda, M. & Hensel, K. Chemical and antibacterial effects of plasma activated water: correlation with gaseous and aqueous reactive oxygen and nitrogen species, plasma sources and air flow conditions. J. Phys. D. 52, 034002. 10.1088/1361-6463/aae807 (2018). [Google Scholar]
- 28.Xu,, G. M., Liu, J. R., Wu, Y. M., Shi, X. M. & Zhang, G. J. Low-temperature atmospheric pressure Helium plasma jet damages malignant melanoma cells by inducing oxidative stress. IEEE Trans. Plasma Sci.46, 2805–2813. 10.1109/TPS.2018.2856122 (2018). [Google Scholar]
- 29.Griendling, K. K. et al. Measurement of reactive oxygen species, reactive nitrogen species, and redox-dependent signaling in the cardiovascular system: a scientific statement from the American Heart Association. Circul. Res.19, 39–75. 10.1161/RES.0000000000000110 (2016). [DOI] [PMC free article] [PubMed] [Google Scholar]
- 30.Wang, X. F. & Herman, B. Fluorescence Lifetime Spectroscopy and Imaging, Principles and Applications in Biomedical Diagnostics (Wiley, 2014).
- 31.Heydari, E., Bagheri, P. & Zare-Behtash, H. Photonic-based time-resolved multipulse oxygen sensor. IEEE Sens.22, 12746–12753. 10.1109/JSEN.2022.3177426 (2022). [Google Scholar]
- 32.Stancampiano, A., Bocanegra, P. E., Dozias, S., Pouvesle, J. M. & Robert, E. Plasma Sources Sci. Technol.30 015002, 10.1088/1361-6595/abcc50. (2021). [Google Scholar]
- 33.Mitsugi, F., Kusumegi, S., Nishida, K. & Kawasaki, T. IEEE Trans. Plasma Sci.44 1–6, 10.1088/1361-6595/abcc50. (2020). [Google Scholar]
- 34.Rödder, K. et al. Activation of murine immune cells upon co-culture with plasma-treated B16F10 melanoma cells. Appl. Sci.9, 660. 10.3390/app9040660 (2019). [Google Scholar]
Associated Data
This section collects any data citations, data availability statements, or supplementary materials included in this article.
Supplementary Materials
Data Availability Statement
Data is provided within the manuscript or supplementary information files.