

Abstract
Dengue is a rapidly spreading mosquito‐borne infectious disease that is sensitive to climate factors and poses a major public health concern worldwide. We analyzed dengue incidence trends and the relationship between annual mean minimum temperatures (AMMTs) and dengue incidence rates from 1990 to 2019 in 122 countries using the Global Burden of Disease and TerraClimate data sets. We also projected global dengue incidence rates under different carbon emission scenarios using temperature data from the Coupled Model Intercomparison Project Phase 6 (CMIP6) data set. Our results reveal a significant increase in global dengue cases from 1990 to 2019 and a positive correlation between temperature and dengue incidence. The association between AMMT and dengue incidence strengthened at temperatures exceeding 21°C. Central and eastern sub‐Saharan Africa, as well as Oceania, were identified as the regions most sensitive to dengue; males and individuals aged 15–19 or 70–84 years were the most susceptible to dengue under rising temperatures. Our projections suggest that global dengue incidence will substantially increase by 2050 and 2100. By 2100, regions including Africa, the Arabian Peninsula, the southern United States, southern China, and island countries in the Pacific and Indian Oceans are projected to become year‐round dengue‐endemic under a high‐emission climate scenario. Our findings underscore the importance of implementing effective measures to mitigate the impact of climate change on dengue transmission. Identifying high‐risk areas and susceptible populations, along with understanding the projected expansion of dengue‐endemic regions, will provide valuable guidance for targeted interventions to address this growing global health challenge in the face of changing climatic conditions.
Keywords: climate change, temperature, Global Burden of Disease Study, dengue
Key Points
Global warming significantly contributed to dengue incidence
Central and eastern sub‐Saharan Africa, Oceania, males, aged 15–19 and 70–84 years were susceptible to dengue under global warming
Substantial increases in global dengue incidence by 2050 and 2100
1. Introduction
Dengue is a viral disease that is caused by four distinct serotypes of the dengue virus and is transmitted to humans by mosquitoes of the Aedes genus (Guzman & Harris, 2015; Messina et al., 2019). The principal vectors, Aedes aegypti and Aedes albopictus, exhibit a marked propensity for human association and are well adapted to human habitats. In addition to transmitting dengue, Aedes mosquitoes are vectors for chikungunya, yellow fever, Zika virus, and other pathogens (Bhatt et al., 2013; Mordecai et al., 2017). Infection with the dengue virus precipitates an array of manifestations in humans, encompassing no symptoms, mild influenza‐like symptoms, episodes of high fever and vomiting, and hemorrhagic complications. Some cases may involve life‐threatening symptoms involving circulatory insufficiency that can result in hypovolemic shock or dengue shock syndrome (World Health Organization [WHO], 2009).
Dengue incidence has surged increased globally in the past 50 years due to the rapid spread of the virus. Before 1970, dengue was endemic to only nine countries; In the 2010s, dengue was endemic to more than 100 countries across Africa, the Americas, Asia, and Oceania (WHO, 2012). The global incidence of dengue has increased 30‐fold over the past 50 years, with more than 50% of the global population now at risk of dengue infection (Ebi & Nealon, 2016). In 2019, an estimated 57 million new cases of dengue were reported worldwide, corresponding to a global incidence of 735 new cases per 100,000 persons (Global Burden of Disease Study [GBD], 2019). The true incidence of dengue is frequently underestimated because only approximately one in five individuals infected with the virus exhibits clinical symptoms and receives a subsequent diagnosis of dengue (Ebi & Nealon, 2016). Dengue is the second most prevalent mosquito‐borne viral disease after malaria. Effective antiviral drugs for dengue have not yet been developed. Control efforts have primarily been focused on vector control and virus surveillance (Cucunawangsih & Lugito, 2017; WHO, 2012). However, dengue has evolved from an episodic disease to a public health challenge. Dengue has notable social and economic effects because of its widespread presence, increasing case numbers, and severity (Guzman & Harris, 2015).
Global warming will have severe and irreversible effects on human societies and ecosystems in the future (Chen et al., 2023) and will lead to increased transmission of vector‐borne infectious diseases (Iwamura et al., 2020; Liu‐Helmersson et al., 2019; Watts et al., 2015). The global mean temperature will increase by 0.28–4.78°C by 2100. Even if attempts are made to mitigate greenhouse gas emissions, the global mean temperature will increase by at least 1.5°C (Stocker et al., 2014). Dengue is sensitive to climate. The geographic prevalence of dengue is influenced by climatic, socioeconomic, and demographic variables. Climatic factors, especially temperature, most strongly drive the complex dynamics of dengue vectors and viral load (Brugueras et al., 2020; Khan et al., 2020; Morin et al., 2013). Dengue mosquito behavior, vectorial competence, and in vitro incubation periods are significantly influenced by temperature. Temperature fluctuations in the range 15–35°C have complex direct and indirect influences on the life cycle, growth efficiency, blood‐feeding frequency, extrinsic incubation duration, reproductive and mortality rates, and overall population dynamics of Aedes mosquitoes (Chien & Yu, 2014; Morin et al., 2013). Replication and maturation of the dengue virus are also influenced by temperature (Butterworth et al., 2017; Li et al., 2020; Parham et al., 2015). A study in India revealed that between 1998 and 2018, the window during which dengue transmission risk is highest lengthened by 2 months because of climate change, leading to a marked increase in susceptibility (Kakarla et al., 2020). High temperatures due to climatic events, such as El Niño, have led to greater numbers of dengue outbreaks in nonendemic areas (Thai et al., 2010; Wu et al., 2016). Evidence indicates that dengue is likely to continue to spread worldwide due to rising global temperatures. Regions already affected by dengue will experience more frequent and intense outbreaks, leading to increased human infection and potentially more severe clinical manifestations (Li et al., 2020; Mordecai et al., 2017).
Global warming is causing dengue to spread to new areas and become more prevalent. Mitigating the effects of global warming would reduce dengue incidence and transmission. Most studies on this topic have focused on specific countries or regions. Global research into the association between temperature and dengue incidence is lacking. Studies regarding the effects of global warming on dengue incidence in susceptible populations are warranted. Additionally, global dengue incidence trends should be analyzed, and future dengue distribution projections should be developed. Therefore, the present study investigated the association between global warming and global dengue incidence to address this escalating health challenge.
2. Data and Methods
2.1. Data Sources
The GBD study is a comprehensive study that quantifies the global health effects of hundreds of diseases, injuries, and risk factors (GBD, 2019). GBD data are extracted from various sources, including censuses; household surveys; civil registration and vital statistics; disease registries; health service databases; and other sources that contain air pollution, satellite imaging, and disease notification data (Murray et al., 2020; Vos et al., 2020). The data set covers epidemiological information related to 369 diseases and injuries across 204 countries and territories from 1990 to 2019. The present study obtained age‐standardized data from the GBD on the dengue incidence rates for 122 countries from 1990 to 2019. Sex and age subgroup analyses were performed. The included countries were categorized into regions for comparative analysis. The International Classification of Diseases, Tenth Revision, code for dengue is A90.X01. Using the International Classification of Diseases, Tenth Revision enables consistent reporting and analysis of dengue cases across regions.
TerraClimate is a globally gridded data set of monthly climate information with a high spatial resolution (1/24°, 4 km) for terrestrial surfaces from 1958 to the present (Abatzoglou et al., 2018). The TerraClimate data set is used in global ecological and hydrological studies and is particularly useful for studies that require high spatial resolution climate data for different periods. The present study obtained high‐resolution data on global monthly minimum near‐surface air temperatures from 1990 to 2019 from this data set. Using shapefiles of each country's first‐level administrative areas, we extracted the monthly minimum temperatures in each country from TerraClimate raster data. The monthly minimum temperatures from 1990 to 2019 were averaged to obtain the annual mean minimum temperature (AMMT), with these temperatures matched with the annual dengue incidence in the GBD data set.
The present study investigated the association between AMMTs and dengue incidence rates and projected future global dengue incidence rates and geographical distribution patterns. Minimum temperature has been reported to have a greater influence on vector development and dengue risk than maximum and mean temperatures do, and minimum temperature can be used to predict dengue incidence (Chien & Yu, 2014; Khan et al., 2020; Li et al., 2020; Sang et al., 2015). AMMT represents the temperature floor in a region. This variable is particularly indicative of whether the temperature in a given region remains consistently high throughout a year.
The socio‐demographic index (SDI) serves as a composite measure of social and economic development at the country level and is derived from measures of income per capita, the educational attainment of the population aged 15 years or older, and the fertility rate of women aged younger than 25 years (Fitzmaurice et al., 2017). The SDI is computed as the mean of these three rescaled components and is expressed on a scale ranging from 0 to 1. Higher SDI scores indicate more advanced levels of socioeconomic development within a region. An SDI score of 1.0 signifies that a region has the highest level of educational attainment, the highest log income per capita, and the lowest fertility rate (Sharma et al., 2022). The GBD study classifies countries and regions into five levels on the basis of the SDI: low SDI regions (0.000–0.455), low‐middle SDI regions (0.455–0.608), middle SDI regions (0.608–0.690), high‐middle SDI regions (0.690–0.805), and high SDI regions (0.805–1.000). This classification is presented in a document called “SDI Reference Quintiles” (https://ghdx.healthdata.org/record/ihme‐data/gbd‐2019‐socio‐demographic‐index‐sdi‐1950‐2019; accessed on 1 September 2023). The SDI is a time‐varying indicator. For example, one country was classified as having a middle SDI in 1990 and a high SDI in 2019. The present study used the SDI scores for 2019 to represent the economic development status of each investigated country. The incorporation of the SDI in this study facilitated the grouping of countries with similar development statuses, providing valuable insights into the associations between socioeconomic development and various health outcomes.
We used a similar approach (masking using shapefiles of each country) to extract monthly minimum near‐surface air temperature data from the Coupled Model Intercomparison Project Phase 6 data set, which contains past, present, and future climate data in a multimodal framework (Eyring et al., 2016). Three widely employed representative climate models (ACCESS‐CM2, IPSL‐CM6A‐LR, and MIROC6), each having the same resolution (250 km), were selected for interpolated averaging. We generated AMMT data for two specific shared socioeconomic pathways (SSPs), namely SSP245 and SSP585, which represent distinct levels of global warming corresponding to medium and high carbon emission scenarios, respectively. These scenarios enabled us to explore the effects of temperature change on the dengue incidence under different carbon emission scenarios.
2.2. Statistical Methods
Our analysis was conducted in three steps. First, generalized additive models (GAMs) were employed to establish the exposure–response association of dengue incidence with AMMT, and SDI scores across 122 countries for the period 1990–2019. Generalized additive models are used to identify nonlinear associations between predictor and dependent variables through smooth splines to obtain a smooth curve and are widely used for association analysis and prediction (He et al., 2023; Wood & Augustin, 2002). This study used natural spline functions for curve fitting in the GAMs. The curve for the AMMT–dengue incidence relationship exclusively used AMMT as the predictor variable. Similarly, the curve for the SDI score–dengue incidence relationship exclusively used SDI scores as the predictor variable. The goodness of fit of the curves was assessed using the R 2 value, which quantifies the proportion of the variance in the dependent variable that is explained by the predictor variable. Additionally, the statistical significance of curve fitting was determined by testing the null hypothesis that the predictor variable has no effect on the dependent variable, with significance indicated by a P value of <0.05. In the present study, our results revealed a temperature threshold of 21°C, beyond which the dengue incidence significantly increased with temperature variables. This threshold was determined by performing an in‐depth analysis of the AMMT–dengue incidence relationship for the period 1990–2019. By plotting and comparing the 30‐year curves of AMMT and dengue incidence, we discovered significant trends throughout this period (P < 0.05). At temperatures of <21°C, the rise in AMMT resulted in a smaller change in dengue incidence.
However, beyond this threshold, a distinct increase in dengue incidence was observed, with a pronounced upward trend as AMMT increased (Figure 3e). This empirical observation guided our selection of the 21°C threshold, indicating a critical point at which temperature becomes a significant driver of dengue transmission. Therefore, areas with AMMTs exceeding 21°C were defined as dengue‐endemic regions. The 21°C threshold was used to identify areas at high risk of dengue and to predict future dengue incidence. This threshold enabled us to identify areas that will be more prone to dengue outbreaks as temperatures increases and to develop more effective temperature monitoring and early warning systems.
Figure 3.
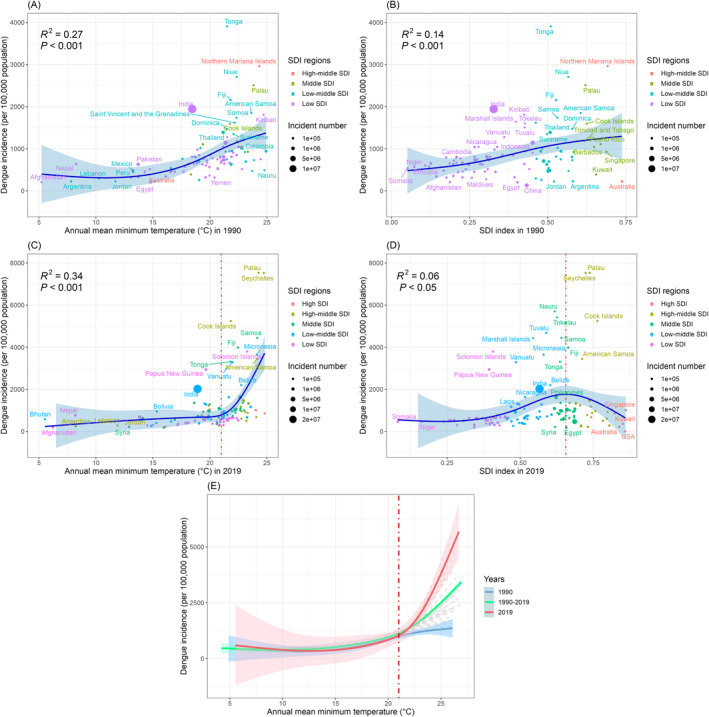
Influence of annual mean minimum temperature and socio‐demographic index (SDI) score on dengue incidence in 122 countries from 1990 to 2019. (R 2 quantifies extent to which effect on dengue incidence could be explained by this factor). The dashed red lines in panels (c and e) indicate the threshold of the effect of annual mean minimum temperature (21°C) on dengue incidence. The dashed red line in panel (d) indicates the threshold of the effect of SDI score (0.66) on dengue incidence.
In the second step of our analysis, generalized linear models were used to investigate the effects of temperature variables on dengue incidence across different subgroups, namely 10 regional subgroups, 20 age subgroups, and 2 sex subgroups, with only AMMT included as the explanatory variable. Relative risk (RR) was assessed to evaluate the influence of AMMT on the risk of dengue within each subgroup. RR values of more than 1.0 indicated that an increase in the temperature variables correlated with an increase in the risk of dengue. This step provided critical insights into whether changes in the AMMT in specific regions and populations led to a change in dengue incidence.
In the third step, we interpolated and averaged future temperature data from the Coupled Model Intercomparison Project Phase 6 data set by using three climate models (ACCESS‐CM2, IPSL‐CM6A‐LR, and MIROC6) with the same resolution. We removed oceans from the model to obtain data on land surface temperature variables. Future dengue incidence was predicted by feeding the AMMTs from the CMIP6 data into the GAM model. We limited our projection to regions with AMMTs of >21°C (dengue‐endemic regions) because these are the regions most susceptible to dengue as the AMMT changes. Employing the exposure–response association between dengue incidence and AMMTs derived from the GAM in 2019, we made predictions regarding future dengue‐endemic regions and projected dengue incidence within these regions for the years 2050 and 2100 in two carbon emission scenarios (SSP245 and SSP585), which represent specific SSPs under medium‐term and long‐term climate change effects, respectively.
3. Results
In 1990, India had the most dengue cases (more than 10 million), followed by Indonesia, China, and Brazil, each with more than 1 million cases (Figure 1a). In 2019, India was still the country with the most dengue cases, followed by China, Indonesia, Brazil, the Philippines, Pakistan, Bangladesh, Nigeria, and Vietnam, each with more than 1 million cases (Figure 1b). Notably, these countries all have large populations. The six countries with the highest incidence rates in 1990 were Tonga, the Northern Mariana Islands, Niue, Palau, Fiji, and India (Figure 1c), and those in 2019 were Niue, the Northern Mariana Islands, Kiribati, Palau, Seychelles, and Nauru (Figure 1d). These countries are primarily island countries situated in the Pacific Ocean.
Figure 1.
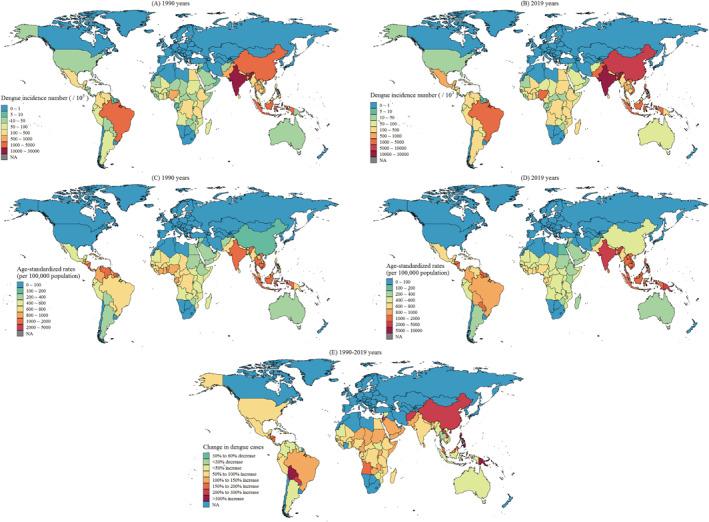
Spatial distribution of dengue incidence (per 100,000 persons) and number of cases in each country worldwide in (a and c) 1990 and (b and d) 2019 and (e) change in number of dengue cases from 1990 to 2019.
The incidence of dengue cases significantly increased from 1990 to 2019 in most countries. The number of dengue outbreaks doubled in Seychelles, Nauru, Kiribati, the Solomon Islands, the Philippines, and China. Additionally, the dengue prevalence substantially increased in several countries that initially had low prevalence rates, namely Papua New Guinea and Vanuatu in Oceania; Belize in Central America; Bolivia and Paraguay in South America; and Laos, Afghanistan, and Jordan in Asia (Figure 1e). These results indicate that countries that experienced large increases in dengue incidence during the study period were generally those in subtropical regions at high latitudes, with the most notable changes occurring in China, Afghanistan, and Jordan in the northern hemisphere and in Bolivia, Paraguay, and Papua New Guinea in the southern hemisphere.
Most countries experienced increases in both AMMT and dengue incidence during the study period. Central sub‐Saharan Africa, southern sub‐Saharan Africa, eastern sub‐Saharan Africa, Southeast Asia, and the Middle East experienced substantial temperature increases. By contrast, western sub‐Saharan Africa, South Asia, and Latin America experienced moderate temperature increases. The countries that experienced the greatest increases in dengue incidence were primarily island countries situated in the Pacific or Indian Ocean. Declines in dengue incidence were observed in island countries in the Caribbean Sea, whereas nearby continental countries in Central America experienced notable increases in dengue incidence. A comparison between eastern and western sub‐Saharan Africa revealed a greater temperature increase in eastern sub‐Saharan Africa that was accompanied by a greater increase in dengue incidence (Figure 2).
Figure 2.
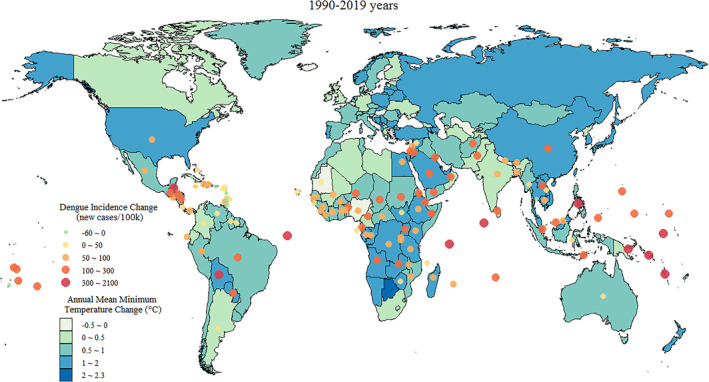
Global distribution of AMMT (with five intervals ranging from −0.5 to 2.3°C) and local dengue incidence (color‐scaled dots, ranging from −60 to 2100 new cases per 100,000 persons) in each country from 1990 to 2019.
A positive correlation was noted between dengue incidence and AMMT in 1990 and in 2019. In 1990, temperature was positively correlated with dengue incidence, with the incidence rate being high in countries with high temperatures. The highest incidence was approximately 4,000 cases per 100,000 persons. This trend was evident in several island countries in the Pacific Ocean, including Tonga, Niue, Palau, and the Northern Mariana Islands (Figure 3a). In 2019, the effect of AMMT on dengue incidence was stronger at temperatures of >21°C. Temperature positively correlated with the dengue incidence in Palau, Seychelles, Samoa, and the Cook Islands, with the highest incidence being approximately 8,000 cases per 100,000 persons (Figure 3c). The explanatory power of AMMT in relation to dengue incidence increased from 27% (R 2 = 0.27) in 1990 to 34% (R 2 = 0.34) in 2019, indicating that the association between temperature and dengue incidence was stronger in 2019 than in 1990.
SDI score was significantly positively correlated with dengue incidence in 1990 (Figure 3b). In 2019, dengue incidence was highest in middle SDI regions (SDI score 0.66). In low‐ and low‐middle‐SDI regions, dengue incidence was positively correlated with SDI score, whereas in high‐middle‐ and high‐SDI regions, dengue incidence was inversely correlated with SDI score (Figure 3d). The explanatory power of SDI score in relation to dengue incidence decreased from 14% (R 2 = 0.14) in 1990 to 6% (R 2 = 0.06) in 2019, indicating that the association between SDI score and dengue incidence was weaker in 2019 than in 1990. Curve fittings of AMMT versus dengue incidence from 1990 to 2019 are presented in Figure 3e. The temperature of 21°C is a crucial threshold for the effect of temperature on dengue incidence. When the AMMT was <21°C, temperature increases slightly contributed to dengue incidence rate increases each year from 1990 to 2019. However, when the AMMT was >21°C, the association between temperature and dengue incidence was weaker (Figure 3e).
The increase in dengue incidence attributable to increasing temperature was most significant for Central sub‐Saharan Africa. In this region, for each 1°C increase in AMMT, the dengue risk increased by 10.5% (RR: 1.105; 95% confidence interval [CI]: 1.069–1.142; P < 0.001). Oceania and Eastern sub‐Saharan Africa also experienced substantial increases in dengue risk attributable to increasing temperature. In Oceania, a 1°C increase in AMMT was associated with a 6.8% increase in dengue risk (RR: 1.068; 95% CI: 1.042–1.095; P < 0.001), and in eastern sub‐Saharan Africa, the associated increase in dengue incidence was 6.9% (RR: 1.069; 95% CI: 1.062–1.076; P < 0.001; Figure 4).
Figure 4.

Influence of annual mean minimum temperature on dengue incidence from 1990 to 2019 in 10 dengue‐endemic regions.
AMMT significantly contributed to dengue risk in all age and sex subgroups (RR > 1.0; Figure 5). The effect of temperature on dengue risk was slightly stronger for male than for female individuals. Each 1°C increase in AMMT was associated with a 16.5% increase in dengue incidence for male individuals (RR, 1.165; 95% CI: 1.155–1.174; P < 0.001) and a 15.7% increase in dengue incidence for female individuals (RR, 1.157; 95% CI: 1.148–1.167; P < 0.001). The effect of temperature on dengue risk was strongest for individuals aged 15–19 or 75–79 years, with the RR exceeding 1.18 in these age groups. By contrast, the RRs were lowest among individuals aged 45–54 years or ≥95 years (1.139 [95% CI: 1.130–1.148; P < 0.001] and 1.078 [95% CI: 1.071–1.086; P < 0.001], respectively). Furthermore, the association between temperature and dengue incidence exhibited age‐dependent variations. Among individuals aged 0–19 years, the influence of temperature on dengue risk was positively correlated with age. Among individuals aged 20–54 years, the influence of temperature on dengue risk was inversely correlated with age. Among individuals aged 55–79 years, the association between temperature and dengue risk became stronger as age increased. Last, among individuals aged ≥80 years, the association between temperature and dengue risk became weaker as age increased.
Figure 5.
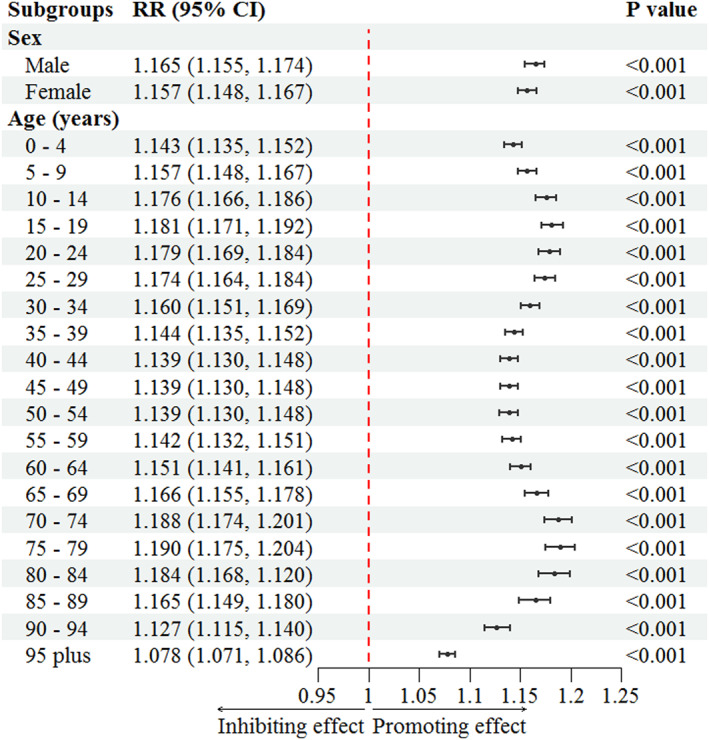
Influence of annual mean minimum temperature on dengue incidence across age and sex subgroups in 122 countries from 1990 to 2019.
Temperature increase significantly contributed to an increase in dengue incidence when the AMMT was greater than 21°C. Regions characterized by AMMTs exceeding 21°C were identified as dengue‐endemic regions that were sensitive to temperature increase. Future dengue‐endemic regions and dengue incidence were predicted on the basis of the association between AMMT and dengue incidence in 2019.
In the SSP245 carbon emissions scenario, the global dengue incidence by 2050 will remain modest. Most dengue‐endemic regions are expected to have incidences ranging from 0 to 4,500 cases per 100,000 persons. The extent of dengue epidemics will be limited, with the major endemic regions encompassing western and eastern sub‐Saharan Africa, the Central American region, Eastern Latin America, most of India, the Southern Arabian Peninsula, the vast majority of Pacific Island countries, and a small northern part of Australia (Figure 6a). By 2100, the global incidence of dengue is projected to undergo a significant increase. The majority of regions are expected to exhibit dengue incidences ranging from 0 to 6,000 cases per 100,000 persons, with certain areas experiencing peak incidences of 6,000 to 7,500 cases per 100,000 persons. Dengue‐epidemic regions are anticipated to emerge in higher latitudes in both the northern and southern hemispheres. New dengue‐endemic regions are anticipated to emerge in the interior regions of Australia, the Arabian Peninsula, and Pakistan. Central and southern sub‐Saharan Africa are expected to experience higher numbers of dengue cases (Figure 6b).
Figure 6.

Regional distribution of dengue incidence associated with temperature increase across different carbon emission scenarios (SSP245 and SSP585) in 2050s and 2100s.
Under the SSP585 carbon emission scenario, a substantial increase in global dengue incidence is projected to occur by 2050. Some regions are expected to experience peak dengue incidences exceeding 9,000 cases per 100,000 persons. The regions with the highest incidences will primarily be located in the tropical coastal regions of continents and island countries. Overall, the epidemiological range will surpass that of the SSP245 scenario by 2100. Dengue is expected to spread widely from tropical regions to higher latitudes, with endemic regions expanding along the coastlines of Africa and South America and penetrating deeper inland. Dengue‐endemic regions are expected to emerge in the southern parts of China and the United States (Figure 6c). By 2100, the high‐latitude spread of dengue is predicted to become more pronounced, with African countries, with the exception of South Africa, becoming entirely dengue endemic. Additionally, the Arabian Peninsula, northern and central Australia, the southern parts of the United States and China, and all island countries in the Pacific and Indian Oceans are expected to become dengue endemic (Figure 6d).
4. Discussion
The study findings indicate that global warming was a significant contributing factor to the observed changes in dengue incidences between 1990 and 2019. A significantly positive correlation between AMMT and dengue incidence was observed, with a crucial threshold identified at 21°C. A comprehensive study regarding the effect of meteorological variables on dengue incidence demonstrated that dengue incidence increased when the minimum temperature was higher than 20°C (Chien & Yu, 2014), which is consistent with the temperature threshold identified in our study. A meta‐analysis investigated the influence of ambient temperature on dengue incidence and demonstrated that variables including weekly resolution, minimum temperature, whether a climate is subtropical, and whether a country had a high‐income level were pivotal determinants of an elevated risk of dengue transmission (Li et al., 2020).
Global warming exerts an influence on the ecology of dengue through its effects on the behavior of vectors, the progression of the infectious agent, and the interactions between Aedes mosquitoes and humans (Chien & Yu, 2014; Morin et al., 2013; Wu et al., 2016). Higher ambient temperatures result in greater precipitation because they induce evaporation of moisture from surfaces and transpiration of moisture from plants, which leads to greater availability of conducive habitats for mosquitoes (Barrera et al., 2011). This increased habitat availability enhances the survival of immature mosquitoes and the propagation of adult mosquitoes (Ebi & Nealon, 2016). Higher temperatures also accelerate the mosquito lifecycle, increase their survival rate, improve conditions for the replication of the dengue virus within infected mosquitoes, and increase such mosquitoes' reproductive activity (Morin et al., 2013). A swifter mosquito development cycle combined with increased longevity hastens mosquito reproduction, which increases their numbers. An increase in the mosquito population would heighten the risk of dengue transmission because more mosquitoes would be feeding on blood (Scott & Takken, 2012). Furthermore, accelerated replication of the virus within mosquitoes would shorten the period of virus maturation, subsequently enhancing dengue transmission (Butterworth et al., 2017; Li et al., 2020; Parham et al., 2015). Moreover, enhanced survival in adult mosquitoes would lead to an increased amount of virus replication (Ebi & Nealon, 2016). The convergence of these effects reinforces the intricate dynamics that facilitate the transmission of dengue.
We studied dengue‐vulnerable areas and populations and demonstrated that the risk of dengue infection was most affected by rising temperatures in central sub‐Saharan Africa, eastern sub‐Saharan Africa, and Oceania. Pacific Island countries in Oceania have become highly susceptible to the effects of climate change, particularly with regard to dengue (WHO, 2012). Sewage treatment in island countries is inadequate, with some areas having poor sewage treatment facilities and inappropriate wastewater facilities, which serve as breeding grounds for mosquitoes (Cairncross & Feachem, 2018). The effects of climate change are more pronounced in island countries, where the thermoregulatory effect of the ocean on the land results in higher near‐surface temperatures. Higher temperatures promote evaporation of water from the ocean, leading to heavy rainfall and precipitation. Higher temperatures and more frequent precipitation create ideal environmental conditions for mosquito breeding and consequently exacerbate the spread of dengue (Chien & Yu, 2014; Li et al., 2020).
The risk of dengue infection is strongest in male individuals and individuals aged 15–19 or 70–84 years. The effect of rising temperature on dengue risk is stronger for male individuals than female individuals. This phenomenon is likely due to differences in behavioral habits between male and female individuals. Male individuals tend to work outdoors for longer than do female individuals, and the outdoor activities of male individuals often extend into the dusk and nighttime periods, which are precisely when mosquitoes are most active (Anker & Arima, 2011). This increased outdoor exposure results in male individuals being more susceptible to mosquito bites. Teenagers are more vulnerable to mosquito bites than are infants and children because teenagers have more exposed skin than do infants and children. Additionally, teenagers are more independent than are infants and children and therefore spend more time outdoors, often venturing into areas where dengue is prevalent (Lim et al., 2021). The immune systems of teenagers are not completely developed; therefore, teenagers may have difficulty combating viruses (Iwamura et al., 2020). These factors increase the dengue risk among teenagers. Older adults are often less mobile than the general population, making them more susceptible to mosquito bites. Additionally, the aging process leads to a decline in the immune system's effectiveness, making older people less resilient to viruses (Bunker et al., 2016). Furthermore, specific chronic health conditions that older adults often have, such as diabetes and high blood pressure, could further compromise their resistance to viral infections (Prince et al., 2015). Therefore, teenagers and older adults are more sensitive than other age groups are to dengue under conditions of global warming. In the present study, among the individuals aged >84 years, dengue risk decreased with age. This trend could be attributed to the substantial aging of the population in high‐income developed regions. Developed regions have better health‐care systems and epidemic prevention systems compared with those of low‐income and middle‐income regions (Li et al., 2020). A large proportion of the individuals aged >84 years in the present study resided in developed regions.
Human activities influence the spread of dengue. In the present study, a significantly positive correlation between SDI score and dengue incidence was observed in 1990. In 2019, the highest dengue incidence was identified in middle SDI regions, which are generally experiencing rapid population growth, uncontrolled urbanization, and uncontrolled industrialization. Uncontrolled industrialization and urbanization lead to a substantial population influx into urban areas that is driven by population growth and migration. Dense urban populations and high fertility rates ensure sufficient hosts for mosquitoes, and population migration expands the geographic spread of dengue (Attaway et al., 2016; Gubler, 2011). Health‐care infrastructure tends not to improve quickly enough during periods of rapid industrialization. In addition, lower educational attainment contributes to limited public awareness regarding mosquito‐borne infections, fostering a tendency to not employ preventive measures (Sanna & Hsieh, 2017). In our analysis, the studied countries experienced extensive phases of urbanization and industrialization in 1990. Higher SDI scores corresponded to more pronounced urbanization and industrialization, which contributed to elevated dengue incidences. By 2019, select regions with elevated SDI scores had attained a certain level of socioeconomic advancement. These regions were no longer undergoing notable amounts of urban expansion. Previous studies have indicated that fewer dengue cases occurring in high SDI regions could be attributed to several factors, including heightened emphasis on environmental preservation and governance, targeted initiatives to eradicate mosquitoes in cities, augmented levels of medical care provision, enhanced public awareness regarding mosquito‐borne illnesses, and the establishment of intercity networks dedicated to the prevention and control of dengue outbreaks (Li et al., 2020; Sanna & Hsieh, 2017).
The projections in the current study made on the basis of different SSPs indicate a substantial rise in global dengue incidence by 2050 and 2100, with dengue‐endemic regions expanding to higher latitudes, affecting regions across Africa, the Arabian Peninsula, Australia, the southern United States, southern China, and island countries in the Pacific and Indian Oceans. Under future climatic conditions, an extended season of mosquito activity is expected in many regions. Nevertheless, cooler winter temperatures in the temperate regions of China and the United States are likely to prevent year‐round transmission of the dengue virus, and thus, year‐round epidemiological regions are likely to remain within the southern parts of China and the United States. The projection by Butterworth et al. (2017) aligned with those of the current study, indicating that increases in dengue transmission would be limited to the southernmost regions of the contiguous United States in the 2100s. Further insight from mechanistic modeling by Mordecai et al. (2017) reaffirmed that tropical and subtropical regions are susceptible to extended seasonal or year‐round transmission but that transmission in temperate areas remains confined to a maximum of 3 months annually, even in the presence of vectors. These brief windows of transmission curtail the potential for significant epidemics following the introduction of dengue in temperate locales. An analysis by Kakarla et al. (2020) further supported the findings of our study in their projection of the distribution of dengue risk in India. In their study, the coastal states of India were found to be at risk of dengue throughout the year. This result is consistent with our projections that dengue‐endemic areas would spread along tropical and subtropical coastlines. This finding can be attributed to the moderating effect of the ocean on coastal land temperatures, which cause winter temperatures in coastal areas to be higher than those in inland areas.
The spread of dengue is influenced by the survival and reproduction of Aedes mosquitoes within new geographical domains. A. aegypti mosquitoes are the predominant intermediary host for the dengue virus; therefore, predictions of the distribution of A. aegypti mosquitoes indirectly indicate the potential geographic incidence of dengue. An investigation of the expected distribution of A. aegypti indicated that the world's suitability for their proliferation increased by approximately 1.5% per decade from 1950 to 2000. This trend is projected to intensify to 3.2%–4.4% per decade by 2050. The advancement of their invasion fronts in several regions, including North America and China, is estimated to accelerate from 2 to 6 km annually by 2050 (Iwamura et al., 2020). A projection regarding the distribution of A. aegypti in Europe indicated that under a high carbon emission scenario (RCP8.5), extensive portions of southern Europe face a risk of A. aegypti invasion by the end of the 21st century (Liu‐Helmersson et al., 2019). A climatic suitability evaluation of A. albopictus and A. aegypti revealed that suitable habitats for both species will expand northward under future climate models. Substantial portions of the United States and some regions in southern Canada are expected to become suitable habitats for Aedes species by 2100. This expansion heightens the potential for Aedes‐borne arbovirus transmission, increasing the risk of diseases such as dengue (Khan et al., 2020).
This study has several limitations. Climate change contributes considerably to the expansion of Aedes mosquito ranges and their active periods, facilitating the spread of dengue. We focused on establishing a connection between temperature changes and dengue incidence; our investigation did not analyze the intermediary process of virus replication within mosquitoes and its subsequent transmission to humans. Future research should investigate alterations in the global distribution range, activity periods, and abundance of Aedes mosquitoes within the framework of climate change. In addition, the GBD data set contains only high‐administrative‐level country data; the data set lacks provincial‐, state‐, and district‐level data. The employment of yearly time intervals in dengue data affects the selection of corresponding minimum temperatures. A temperature parameter with greater temporal resolution would provide a more nuanced understanding of the extrinsic incubation period of dengue infection in humans (Li et al., 2020). Additionally, this study used dengue incidence data from the GBD data set without accounting for differences in dengue detection capabilities between countries and regions. The study also did not account for the exclusion of asymptomatic patients. Moreover, as the average of 12‐month mean minimum temperatures, the AMMT could not be used to study seasonal variations in dengue transmission. Classifying regions as dengue endemic in this study (regions with AMMTs greater than 21°C) could reliably predict the incidence of dengue in tropical and subtropical regions characterized by consistently high temperatures; however, such classification was less effective at predicting the incidence of dengue in temperate regions with cold winters. Although some of these temperate regions may experience seasonal dengue epidemics, they could not be classified as dengue‐endemic regions because of their low winter temperatures (Butterworth et al., 2017; Mordecai et al., 2017). The transmission of dengue is a complex process influenced by multiple factors. Our study primarily focused on temperature, yet dengue transmission is affected by a range of environmental and social factors, including precipitation, altitude, land use pattern, population density, and human mobility (Li et al., 2020). In future research, we intend to integrate environmental factors such as temperature, humidity, and precipitation by using Markov chain modeling to assess the environmental suitability of specific dengue vectors and estimate potential areas of dengue transmission. We plan to investigate the mechanisms of dengue transmission within specific populations to analyze the role of socioeconomic factors, such as human mobility in the spread of dengue. Furthermore, we plan to use more sophisticated models that combine multiple factors (i.e., temperature, humidity, precipitation, population density, human mobility, and urbanization level) to predict the dynamics of dengue transmission. In‐depth studies on specific high‐risk areas will be conducted to understand the special factors and modes of transmission in those areas and develop targeted prevention and control measures. Finally, we will develop strategies to mitigate the effects of climate change on dengue transmission.
5. Conclusion
Our study revealed a persistent increase in dengue incidences and cases globally from 1990 to 2019. Global warming emerged as a significant contributing factor to the changes in dengue incidences by establishing a positive correlation between AMMT and dengue incidence. Regions with pronounced temperature increases, such as central sub‐Saharan Africa, eastern sub‐Saharan Africa, and Oceania, exhibited substantial increases in dengue risk. Male individuals and individuals aged 15–19 or 70–84 years demonstrated higher vulnerability to dengue related to rising temperatures. Our study projected a substantial increase in global dengue incidence by 2050 and 2100. Dengue‐endemic regions are expected to expand, reaching higher latitudes around the world. African countries, with the exception of South Africa, are projected to become dengue endemic under high carbon emission scenarios by 2100, as are the Arabian Peninsula, Australia, the southern United States, southern China, and most island countries in the Pacific and Indian Oceans. This study highlights the need to implement effective measures to mitigate the effects of climate change on dengue transmission. The identification of high‐risk areas and the projected expansion of dengue‐endemic regions could provide guidance for targeted efforts to prevent and control dengue outbreaks under changing climatic conditions.
Conflict of Interest
The authors declare no conflicts of interest relevant to this study.
Acknowledgments
Computing resources were supported by Supercomputing Center of Lanzhou University. This work was supported by grants from the National Natural Science Foundation of China (Grants 41975141, 423751774) and Natural Science Foundation of Gansu (Grant 23JRRA1079). This research is also supported by the Fundamental Research Funds for the Central Universities (No. lzujbky‐2024‐it36).
Feng, F. , Ma, Y. , Qin, P. , Zhao, Y. , Liu, Z. , Wang, W. , & Cheng, B. (2024). Temperature‐driven dengue transmission in a changing climate: Patterns, trends, and future projections. GeoHealth, 8, e2024GH001059. 10.1029/2024GH001059
Fengliu Feng and Yuxia Ma contributed equally to this work.
Data Availability Statement
TerraClimate is downloaded from https://www.climatologylab.org/terraclimate.html. CMIP6 data outputs are publicly available from the CMIP6 data portal (https://esgf‐node.llnl.gov/search/cmip6/). GBD data is available from open‐access websites at http://ghdx.healthdata.org/gbd‐results‐tool.
References
- Abatzoglou, J. T. , Dobrowski, S. Z. , Parks, S. A. , & Hegewisch, K. C. (2018). TerraClimate, a high‐resolution global dataset of monthly climate and climatic water balance from 1958–2015. Scientific Data, 5(1), 1–12. 10.1038/sdata.2017.191 [DOI] [PMC free article] [PubMed] [Google Scholar]
- Anker, M. , & Arima, Y. (2011). Male–female differences in the number of reported incident dengue fever cases in six Asian countries. Western Pacific Surveillance and Response Journal: WPSAR, 2(2), 17. 10.5365/wpsar.2011.2.1.002 [DOI] [PMC free article] [PubMed] [Google Scholar]
- Attaway, D. F. , Jacobsen, K. H. , Falconer, A. , Manca, G. , & Waters, N. M. (2016). Risk analysis for dengue suitability in Africa using the ArcGIS predictive analysis tools (PA tools). Acta Tropica, 158, 248–257. 10.1016/j.actatropica.2016.02.018 [DOI] [PubMed] [Google Scholar]
- Barrera, R. , Amador, M. , & MacKay, A. J. (2011). Population dynamics of Aedes aegypti and dengue as influenced by weather and human behavior in San Juan, Puerto Rico. PLoS Neglected Tropical Diseases, 5(12), e1378. 10.1371/journal.pntd.0001378 [DOI] [PMC free article] [PubMed] [Google Scholar]
- Bhatt, S. , Gething, P. W. , Brady, O. J. , Messina, J. P. , Farlow, A. W. , Moyes, C. L. , et al. (2013). The global distribution and burden of dengue. Nature, 496(7446), 504–507. 10.1038/nature12060 [DOI] [PMC free article] [PubMed] [Google Scholar]
- Brugueras, S. , Fernández‐Martínez, B. , Martínez‐de la Puente, J. , Figuerola, J. , Porro, T. M. , Rius, C. , et al. (2020). Environmental drivers, climate change and emergent diseases transmitted by mosquitoes and their vectors in southern Europe: A systematic review. Environmental Research, 191, 110038. 10.1016/j.envres.2020.110038 [DOI] [PubMed] [Google Scholar]
- Bunker, A. , Wildenhain, J. , Vandenbergh, A. , Henschke, N. , Rocklöv, J. , Hajat, S. , & Sauerborn, R. (2016). Effects of air temperature on climate‐sensitive mortality and morbidity outcomes in the elderly; a systematic review and meta‐analysis of epidemiological evidence. EBioMedicine, 6, 258–268. 10.1016/j.ebiom.2016.02.034 [DOI] [PMC free article] [PubMed] [Google Scholar]
- Butterworth, M. K. , Morin, C. W. , & Comrie, A. C. (2017). An analysis of the potential impact of climate change on dengue transmission in the southeastern United States. Environmental Health Perspectives, 125(4), 579–585. 10.1289/EHP218 [DOI] [PMC free article] [PubMed] [Google Scholar]
- Cairncross, S. , & Feachem, R. (2018). Environmental health engineering in the tropics: Water, sanitation and disease control. Routledge. [Google Scholar]
- Chen, J. , Jiao, Z. , Liang, Z. , Ma, J. , Xu, M. , Biswal, S. , et al. (2023). Association between temperature variability and global meningitis incidence. Environment International, 171, 107649. 10.1016/j.envint.2022.107649 [DOI] [PubMed] [Google Scholar]
- Chien, L. C. , & Yu, H. L. (2014). Impact of meteorological factors on the spatiotemporal patterns of dengue fever incidence. Environment International, 73, 46–56. 10.1016/j.envint.2014.06.018 [DOI] [PubMed] [Google Scholar]
- Cucunawangsih, & Lugito, N. P. H. (2017). Trends of dengue disease epidemiology. Virology: Research and Treatment, 8, 1178122X17695836. 10.1177/1178122x17695836 [DOI] [PMC free article] [PubMed] [Google Scholar]
- Ebi, K. L. , & Nealon, J. (2016). Dengue in a changing climate. Environmental Research, 151, 115–123. 10.1016/j.envres.2016.07.026 [DOI] [PubMed] [Google Scholar]
- Eyring, V. , Bony, S. , Meehl, G. A. , Senior, C. A. , Stevens, B. , Stouffer, R. J. , & Taylor, K. E. (2016). Overview of the Coupled Model Intercomparison Project Phase 6 (CMIP6) experimental design and organization. Geoscientific Model Development, 9(5), 1937–1958. 10.5194/gmd-9-1937-2016 [DOI] [Google Scholar]
- Fitzmaurice, C. , Allen, C. , Barber, R. M. , Barregard, L. , Bhutta, Z. A. , Brenner, H. , et al. (2017). Global, regional, and national cancer incidence, mortality, years of life lost, years lived with disability, and disability‐adjusted life‐years for 32 cancer groups, 1990 to 2015: A systematic analysis for the Global Burden of Disease Study. JAMA Oncology, 3(4), 524–548. 10.1001/jamaoncol.2016.5688 [DOI] [PMC free article] [PubMed] [Google Scholar]
- GBD . (2019). Global Burden of Disease Collaborative Network, Global Burden of Disease Study 2019 (GBD 2019) Results. Institute for Health Metrics and Evaluation (IHME). Retrieved from https://vizhub.healthdata.org/gbd‐results/ [Google Scholar]
- Gubler, D. J. (2011). Dengue, urbanization and globalization: The unholy trinity of the 21st century. Tropical Medicine and Health, 39(4SUPPLEMENT), S3–S11. 10.2149/tmh.2011-s05 [DOI] [PMC free article] [PubMed] [Google Scholar]
- Guzman, M. G. , & Harris, E. (2015). Dengue. The Lancet, 385(9966), 453–465. 10.1016/s0140-6736(14)60572-9 [DOI] [PubMed] [Google Scholar]
- He, L. , Liu, C. , Shan, X. , Zhang, L. , Zheng, L. , Yu, Y. , et al. (2023). Impact of high temperature on road injury mortality in a changing climate, 1990–2019: A global analysis. Science of the Total Environment, 857, 159369. 10.1016/j.scitotenv.2022.159369 [DOI] [PubMed] [Google Scholar]
- Iwamura, T. , Guzman‐Holst, A. , & Murray, K. A. (2020). Accelerating invasion potential of disease vector Aedes aegypti under climate change. Nature Communications, 11(1), 2130. 10.1038/s41467-020-16010-4 [DOI] [PMC free article] [PubMed] [Google Scholar]
- Kakarla, S. G. , Bhimala, K. R. , Kadiri, M. R. , Kumaraswamy, S. , & Mutheneni, S. R. (2020). Dengue situation in India: Suitability and transmission potential model for present and projected climate change scenarios. Science of the Total Environment, 739, 140336. 10.1016/j.scitotenv.2020.140336 [DOI] [PubMed] [Google Scholar]
- Khan, S. U. , Ogden, N. H. , Fazil, A. A. , Gachon, P. H. , Dueymes, G. U. , Greer, A. L. , & Ng, V. (2020). Current and projected distributions of Aedes aegypti and Ae. albopictus in Canada and the US. Environmental Health Perspectives, 128(5), 057007. 10.1289/ehp5899 [DOI] [PMC free article] [PubMed] [Google Scholar]
- Li, Y. , Dou, Q. , Lu, Y. , Xiang, H. , Yu, X. , & Liu, S. (2020). Effects of ambient temperature and precipitation on the risk of dengue fever: A systematic review and updated meta‐analysis. Environmental Research, 191, 110043. 10.1016/j.envres.2020.110043 [DOI] [PubMed] [Google Scholar]
- Lim, J. K. , Chanthavanich, P. , Limkittikul, K. , Lee, J. S. , Sirivichayakul, C. , Lee, K. S. , et al. (2021). Clinical and epidemiologic characteristics associated with dengue fever in 2011–2016 in Bang Phae district, Ratchaburi province, Thailand. PLoS Neglected Tropical Diseases, 15(6), e0009513. 10.1371/journal.pntd.0009513 [DOI] [PMC free article] [PubMed] [Google Scholar]
- Liu‐Helmersson, J. , Rocklöv, J. , Sewe, M. , & Brännström, Å. (2019). Climate change may enable Aedes aegypti infestation in major European cities by 2100. Environmental Research, 172, 693–699. 10.1016/j.envres.2019.02.026 [DOI] [PubMed] [Google Scholar]
- Messina, J. P. , Brady, O. J. , Golding, N. , Kraemer, M. U. G. , Wint, G. R. W. , Ray, S. E. , et al. (2019). The current and future global distribution and population at risk of dengue. Nature Microbiology, 4(9), 1508–1515. 10.1038/s41564-019-0476-8 [DOI] [PMC free article] [PubMed] [Google Scholar]
- Mordecai, E. A. , Cohen, J. M. , Evans, M. V. , Gudapati, P. , Johnson, L. R. , Lippi, C. A. , et al. (2017). Detecting the impact of temperature on transmission of Zika, dengue, and chikungunya using mechanistic models. PLoS Neglected Tropical Diseases, 11(4), e0005568. 10.1371/journal.pntd.0005568 [DOI] [PMC free article] [PubMed] [Google Scholar]
- Morin, C. W. , Comrie, A. C. , & Ernst, K. (2013). Climate and dengue transmission: Evidence and implications. Environmental Health Perspectives, 121(11–12), 1264–1272. 10.1289/ehp.1306556 [DOI] [PMC free article] [PubMed] [Google Scholar]
- Murray, C. J. L. , Aravkin, A. Y. , Zheng, P. , Abbafati, C. , Abbas, K. M. , Abbasi‐Kangevari, M. , et al. (2020). Global burden of 87 risk factors in 204 countries and territories, 1990–2019: A systematic analysis for the Global Burden of Disease Study 2019. The Lancet, 396(10258), 1223–1249. 10.1016/s0140-6736(20)30752-2 [DOI] [PMC free article] [PubMed] [Google Scholar]
- Parham, P. E. , Waldock, J. , Christophides, G. K. , Hemming, D. , Agusto, F. , Evans, K. J. , et al. (2015). Climate, environmental and socio‐economic change: Weighing up the balance in vector‐borne disease transmission. Philosophical Transactions of the Royal Society B: Biological Sciences, 370(1665), 20130551. 10.1098/rstb.2013.0551 [DOI] [PMC free article] [PubMed] [Google Scholar]
- Prince, M. J. , Wu, F. , Guo, Y. , Gutierrez Robledo, L. M. , O'Donnell, M. , Sullivan, R. , & Yusuf, S. (2015). The burden of disease in older people and implications for health policy and practice. The Lancet, 385(9967), 549–562. 10.1016/s0140-6736(14)61347-7 [DOI] [PubMed] [Google Scholar]
- Sang, S. , Gu, S. , Bi, P. , Yang, W. , Yang, Z. , Xu, L. , et al. (2015). Predicting unprecedented dengue outbreak using imported cases and climatic factors in Guangzhou, 2014. PLoS Neglected Tropical Diseases, 9(5), e0003808. 10.1371/journal.pntd.0003808 [DOI] [PMC free article] [PubMed] [Google Scholar]
- Sanna, M. , & Hsieh, Y. H. (2017). Ascertaining the impact of public rapid transit system on spread of dengue in urban settings. Science of the Total Environment, 598, 1151–1159. 10.1016/j.scitotenv.2017.04.050 [DOI] [PMC free article] [PubMed] [Google Scholar]
- Scott, T. W. , & Takken, W. (2012). Feeding strategies of anthropophilic mosquitoes result in increased risk of pathogen transmission. Trends in Parasitology, 28(3), 114–121. 10.1016/j.pt.2012.01.001 [DOI] [PubMed] [Google Scholar]
- Sharma, R. , Abbasi‐Kangevari, M. , Abd‐Rabu, R. , Abidi, H. , Abu‐Gharbieh, E. , Acuna, J. M. , et al. (2022). Global, regional, and national burden of colorectal cancer and its risk factors, 1990–2019: A systematic analysis for the Global Burden of Disease Study 2019. The Lancet Gastroenterology & Hepatology, 7(7), 627–647. 10.1016/s2468-1253(22)00044-9 [DOI] [PMC free article] [PubMed] [Google Scholar]
- Stocker, T. F. , Qin, D. , Plattner, G.‐K. , Tignor, M. M. B. , Allen, S. K. , Boschung, J. , et al. (2014). Climate Change 2013: The physical science basis. Contribution of working group I to the fifth assessment report of IPCC the intergovernmental panel on climate change.
- Thai, K. T. D. , Cazelles, B. , Nguyen, N. V. , Vo, L. T. , Boni, M. F. , Farrar, J. , et al. (2010). Dengue dynamics in Binh Thuan province, southern Vietnam: Periodicity, synchronicity and climate variability. PLoS Neglected Tropical Diseases, 4(7), e747. 10.1371/journal.pntd.0000747 [DOI] [PMC free article] [PubMed] [Google Scholar]
- Vos, T. , Lim, S. S. , Abbafati, C. , Abbas, K. M. , Abbasi, M. , Abbasifard, M. , et al. (2020). Global burden of 369 diseases and injuries in 204 countries and territories, 1990–2019: A systematic analysis for the Global Burden of Disease Study 2019. The Lancet, 396(10258), 1204–1222. 10.1016/s0140-6736(20)30925-9 [DOI] [PMC free article] [PubMed] [Google Scholar]
- Watts, N. , Adger, W. N. , Agnolucci, P. , Blackstock, J. , Byass, P. , Cai, W. , et al. (2015). Health and climate change: Policy responses to protect public health. The Lancet, 386(10006), 1861–1914. 10.1016/s0140-6736(15)60854-6 [DOI] [PubMed] [Google Scholar]
- Wood, S. N. , & Augustin, N. H. (2002). GAMs with integrated model selection using penalized regression splines and applications to environmental modelling. Ecological Modelling, 157(2–3), 157–177. 10.1016/s0304-3800(02)00193-x [DOI] [Google Scholar]
- World Health Organization . (2012). Global strategy for dengue prevention and control 2012–2020.
- World Health Organization . (2009). Dengue: Guidelines for diagnosis, treatment, prevention and control. World Health Organization. https://iris.who.int/handle/10665/44188 [PubMed] [Google Scholar]
- Wu, X. , Lu, Y. , Zhou, S. , Chen, L. , & Xu, B. (2016). Impact of climate change on human infectious diseases: Empirical evidence and human adaptation. Environment International, 86, 14–23. 10.1016/j.envint.2015.09.007 [DOI] [PubMed] [Google Scholar]
Associated Data
This section collects any data citations, data availability statements, or supplementary materials included in this article.
Data Availability Statement
TerraClimate is downloaded from https://www.climatologylab.org/terraclimate.html. CMIP6 data outputs are publicly available from the CMIP6 data portal (https://esgf‐node.llnl.gov/search/cmip6/). GBD data is available from open‐access websites at http://ghdx.healthdata.org/gbd‐results‐tool.