Abstract
Naumure Multipurpose Project (NMP) featuring a 169 m high Concrete Face Rock Filled Dam (CFRD) is the proposed reservoir project in the West Rapti River with an installed capacity of 218.34 MW. Most of the rivers in Nepal carry significant sediment loads that will consequently catalyze reservoir sedimentation. This phenomenon prevails as the primary factor in reducing reservoirs useful life, making ineffective for both flood control and hydroelectricity generation. Ultimately, such process of sedimentation has adverse impacts on projects economic feasibility and long-term sustainability. Therefore, the objective of this research was to examine the expected sediment deposition pattern in the NMP reservoir throughout its operational period by employing 1D HEC-RAS model to simulate the sedimentation process. The model was simulated for 10, 20, 30, 40 and 50 years. Yang’s equation as a sediment transport function, Active layer as a bed sorting method and Toffaleti as a fall velocity method were best suited for the river reach. The delta deposition was formed between 11 km and 22 km upstream of the dam region in the Jhimruk river, with the sediment deposition depth reaching peaks of about 23 m, 38 m, 39 m, 41 m and 49 m in 10, 20, 30, 40 and 50 years, respectively. Similarly, the delta deposition was formed between 13 km and 33 km upstream of dam region in the Madi river, with the sediment deposition depth reaching peaks of about 47 m, 62 m, 60 m, 68 m and 75 m in 10, 20, 30, 40 and 50 years respectively. Headcutting of delta deposition occurred between 20 and 30 year due to high flood during low stage of reservoir. Furthermore, the study revealed that about 6.22%, 11.61%, 15.94%, 22.96% and 25.65% of the storage capacity of NMP reservoir will be depleted in 10, 20, 30, 40 and 50 years respectively.
Keywords: Naumure Multipurpose Project (NMP), Sedimentation, HEC-RAS, Delta, Headcutting
Subject terms: Environmental impact, Hydrology
Introduction
Sedimentation behind reservoirs, leading to a loss of storage capacity, has emerged as a significant concern globally1. While natural river systems maintain a balance between sediment influx and outflow2, the construction of dams disrupts this equilibrium, resulting in reduced flow velocities and increased sediment accumulation3–5. This alteration in hydrological patterns and sediment transport downstream of dams has far-reaching consequences, including decreased nutrient delivery and accelerated erosion6–8. Consequently, reservoirs are often managed with a limited lifespan due to sediment trapping, emphasizing the urgency of evaluating sedimentation rates for sustainable water management9. Sediment-filled reservoirs could be more vulnerable to seismic activity because the deposited sediment is denser than water and could press harder on the dam during shaking10. The reservoir’s usable storage capacity is eliminated by sediment deposition, rendering it unusable for flood control or water supply. If the reservoir’s flood storage determines the spillway capacity, sedimentation may make the dam dangerous if this flood storage is lost. In addition, sediment retention in reservoirs serves as a substantial carbon sink11,12. Moreover, it causes abrasion of hydromechanical equipment of hydropower, which shortens their lifespan. Thus, research on reservoir sedimentation is essential to determine capacity loss, the reservoir’s useful life, and the impact of dam operations on the reservoir’s deposition pattern.
Global reservoirs currently hold approximately 8,000 km3 of cumulative storage capacity, which is over double the amount of yearly river runoff worldwide13. But reservoirs face a significant challenge, with an estimated annual siltation rate of approximately 0.5-1%, potentially halving their capacity by 2100 AD14–16. In addition, the global yearly loss of reservoir storage due to sedimentation exceeds the increase in capacity from the construction of new reservoirs14,17. Sedimentation rates might differ significantly between reservoirs because of a variety of influencing factors18,19, including rainfall, erosion rates, catchment characteristics, and reservoir operation plans20. Furthermore, the sediment transport rates are impacted by climate change and human activity along the river21.
Nepal, abundant in hydro-resources with a theoretical potential of 83,000 MW22, experiences a seasonal imbalance in power generation, necessitating electricity imports during the winter months23. To address this, Nepal has embarked on numerous storage projects, such as the Kulekhani reservoir commissioned in 1982 and ongoing projects like Tanahau Storage Hydropower and others24. However, the Kulekhani Reservoir has already experienced significant capacity loss, indicating the pressing need for effective sediment management strategies25. In Himalayan nations like Nepal, monsoon storms contribute to a substantial portion of runoff and sediment load, intensifying sedimentation challenges16. In spite of possessing significant hydropower potential, Nepal is still characterized as young and tectonically active region, featuring immature and delicate geology, steep terrain, fragile rock formation, and heavy seasonal rainfall resulting to sediment laden rivers26. Consequently, sedimentation poses a significant threat to hydropower development and reservoir sustainability.
Anticipating how much sediment a reservoir can trap is critical for making explicit economic forecasts for a planned dam. However, estimating sedimentation rates is a difficult task because unlike streamflow data, gathering sediment flow information is much more expensive and difficult. Eventually, there is a scarcity of reliable sediment data carried by rivers worldwide27. Therefore, researchers globally have employed diverse methodologies and techniques like laboratory analysis, surveys, physical experimentation and numerical models to delve deeper into the sedimentation process. Numerous studies have investigated reservoir sedimentation dynamics using advanced numerical models. For instance, Campos28 developed a three-dimensional model for sedimentation in Brazil’s Itaipu Reservoir, while Elsersawy29 utilized a GIS-based decision support system to study sedimentation effects on reservoirs. Similarly, Mamede30 coupled numerical models to assess sediment trap efficiency in the Barasona Reservoir, and J. Anh31 created a model to simulate sedimentation and flushing in the Xiaolangdi Reservoir. Furthermore, Issa et al.32 estimated Mosul Dam Reservoir lifespan using bathymetric surveys, demonstrating the diverse methodologies employed in sedimentation studies.
The present study addresses sedimentation modeling in the Naumure Reservoir during a 50-year operating period utilizing the Hydrological Engineering Center’s River Analysis System (HEC-RAS) model. HEC-RAS is a versatile hydraulic modeling tool that can simulate flow profiles, sedimentation processes, and water quality dynamics33,34. The one-dimensional modeling approach offered by HEC-RAS is favored for its simplicity, computational efficiency, and widespread use in engineering practices35,36. For long-term modeling, the majority of sediment transport models in a long river reach are typically one-dimensional37. Additionally, HEC-RAS’s open-source nature contributes to its popularity among researchers38.
In this study, HEC-RAS version 6.2 is employed to perform quasi-unsteady flow hydraulic calculations, facilitating the assessment of sediment transport dynamics and deposition using the Exner Equation39,40. By employing advanced numerical modeling techniques, this research aims to provide insights into sedimentation processes and contribute to effective reservoir management strategies. This study further aims to contribute to the understanding of reservoir sedimentation dynamics and inform sustainable water management practices, particularly in regions like Nepal with high hydropower potential and sedimentation challenges.
Study area
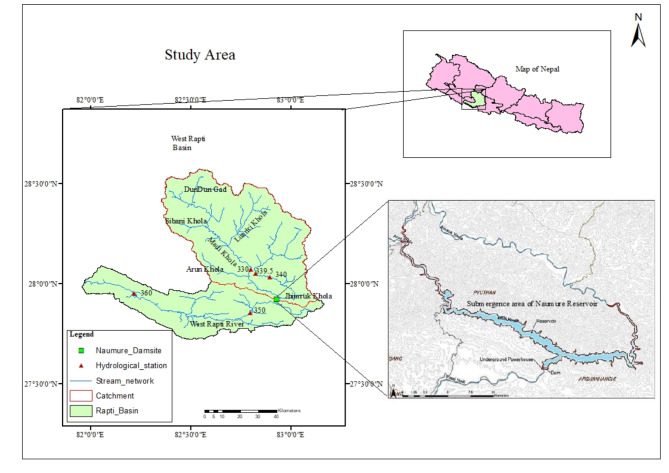
The proposed Naumure Multipurpose Project, located in the Pyuthan district of Lumbini Province within the West Rapti River Basin as shown in Fig. 1, spans the Siwaliks and Midland groups, intersected by the Main Boundary Thrust [ 41]. The proposed Concrete Face Rock Fill Dam (CFRD) at the West Rapti River is approximately located at 27° 55′ 33″ N latitude and 82° 50′ 00″ E longitude, about 3 km downstream from junction of the Madi and the Jhimruk Rivers41. The entire catchment area covers about 3414 km2, delineated using STRM 30 m DEM in QGIS. The dam will stand 169 m high, with its reservoir reaching a maximum water level of 524 masl. The reservoir’s gross storage capacity is approximately 1066.85 Mm3, with a submergence area of 18.03 km241. Unlike snow-fed rivers, the West Rapti Basin relies primarily on monsoon rainfall and groundwater for its runoff42. The average annual precipitation for the West Rapti River Basin is 1372 mm with average flow of 109 m3/s. The lower section of the watershed experiences hot and humid weather, while the middle and upper parts have temperate weather. The project area includes both the Lesser Himalayan Zone with shale, slate, phyllite, quartzite, limestone, and dolomite and the Sub-Himalayan Zone with sandstone, siltstone, and mudstone. The geological study in the reservoir area shows rocks are heavily folded43.
Fig. 1.
Map of study area showing the location of Naumure dam site and submergence area.
Data collection
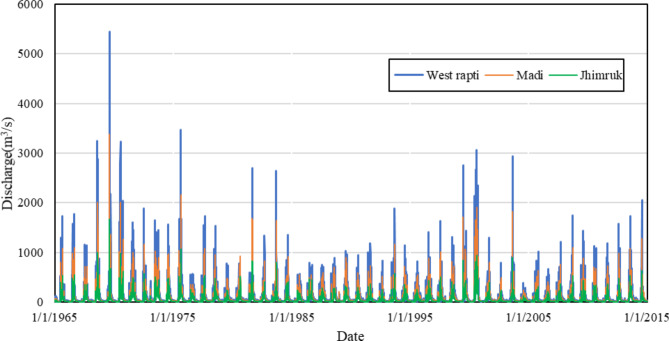
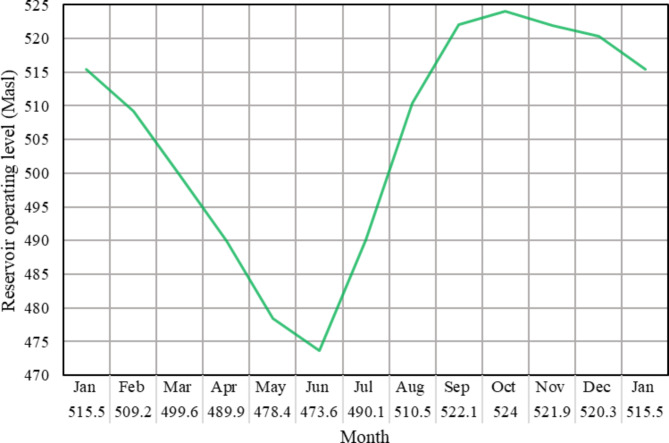
Geometry data, sediment data, and quasi-unsteady flow data are essential for simulating the West Rapti River for sedimentation. The DEM file with a resolution of 30 m × 30 m was obtained from the USGS shuttle radar topography mission, defining the topography of the study area. Hydrographical survey data of reservoir submergence area was obtained from Department of Electricity Development (DOED), Nepal41. Daily flow series data was collected for quasi-unsteady flow modeling from gauged stations 330 (Madi), 339.5 (Jhimruk), 340 (Jhimruk), and 350 (West Rapti) are shown in Fig. 2. For the stage series data, a reservoir operating rule curve for Naumure reservoir developed by K.C.42 using HEC-ResSim was used, which is as shown in Fig. 3. This considers seasonal reservoir water level fluctuations, considering the future impacts of climate change on reservoir levels with maximum reservoir operating level of 524 m and minimum operating level of 473 m. The sediment load data was obtained from Department of Hydrology and Meteorology, Nepal. Since the West Rapti River basin shares proximity with the Karnali River basin, bed gradation data and the gradation of sediment load of the Karnali River, which are shown in the Tables 1 and 2 respectively, were employed for the simulation process because the real bed gradation and gradation of sediment load of the West Rapti River were not accessible.
Fig. 2.
Daily inflow hydrograph for different river of West River.
Fig. 3.
Reservoir operating rule curve for Naumure reservoir42.
Table 2.
Gradation of sediment load data of Karnali River used for simulation process45.
| Sediment particles (mm) | Percentage finer |
|---|---|
| 0.004 | 3 |
| 0.008 | 9 |
| 0.016 | 17 |
| 0.032 | 33 |
| 0.0625 | 50 |
| 0.125 | 76 |
| 0.25 | 88 |
| 0.5 | 99 |
| 1 | 100 |
Table 1.
Bed gradation of Karnali River used for simulation process44.
| Bed material diameter (mm) | Percentage finer |
|---|---|
| 0.5 | 10 |
| 1 | 15 |
| 2 | 20 |
| 4 | 25 |
| 8 | 30 |
| 16 | 35 |
| 32 | 45 |
| 64 | 50 |
| 128 | 75 |
| 256 | 90 |
| 512 | 100 |
Methodology
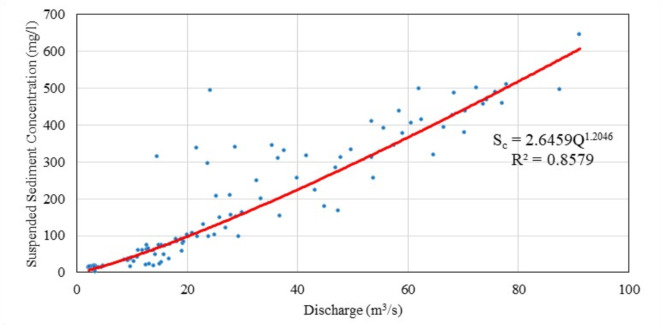
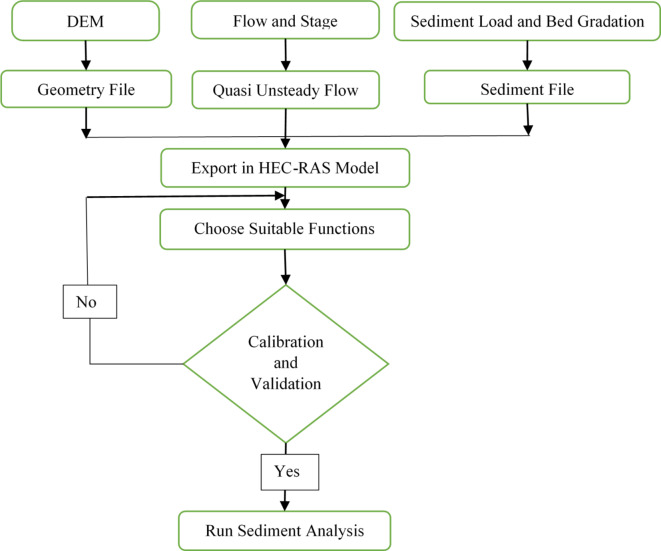
The geometry file for the study area was extracted using the HEC-GeoRAS mapper tool of HEC-RAS 6.2, incorporating basin geometry, river networks, and elevation data. By extracting an indispensable parameter for the modeling process, HEC-RAS was made simpler to put into application through integration with GIS technology46. Using HEC-GeoRAS bank lines, flow pathways, and cross-sections have been obtained from the DEM and manual adjustment was done to the cross-section beneath the water level of river based on the hydrographical survey data that was obtained from DOED41. Quasi-unsteady flow modeling combined discrete steady flow profiles with a continuous hydrograph to streamline hydrodynamics47. Boundary conditions are essential for every hydrodynamic model 48. Daily flow series data of Jhimruk and Madi River, as shown in Fig. 2 served as the upstream boundary condition, while stage series as illustrated in Fig. 3 have been used for downstream boundary condition at the dam axis. For the upstream boundary condition of the sediment file, suspended sediment rating for Jhimruk River as shown in Fig. 4 was considered for both Jhimruk and Madi reach due to unavailability of sediment data for Madi River. Bed particles played a crucial role in sedimentation and scouring, which are difficult to measure49, with bed load considered to be 20% of suspended load23. The maximum erodible depth of 17 m below the original invert of the channel and bank station of the channel were set as the movable bed limits for specifying the control volume for sediment transport. The primary features of sediment analysis are the associated hydraulic parameters: flow, bed gradient, stream area, stages, sediment loads, shear stresses, and variation in mass change50. Calibration of input parameters was performed by comparing measured values at hydrometeorological stations with simulated data and adjusting the parameters to ensure close agreement. The calibrated model was then validated by comparing the simulated values obtained from the model with the data generated from the sediment rating curve for the West Rapti River. The two most well-known metrics for evaluating a model, the coefficient of determination (R2) and percent bias (PBIAS)51 were used for model performance evaluation. The result of the model’s coefficient of determination is capable of being used to characterize the degree to which observed data deviates from the model. The PBIAS calculates the tendency of variance in the observed data as a lower or greater value based on an average value52. The sedimentation simulation was carried out using the same optimal parameters following model calibration and validation. The steps incorporating the pre-model setup and post sediment simulation process are shown in the methodological chart in Fig. 5 below.
Fig. 4.
Suspended sediment rating curve for Jhimruk River.
Fig. 5.
Methodology flowchart.
Results and discussion
Due to site complications, limited technology and negligence, the sediment measurement at the Jhimruk and West Rapti stations were conducted inconsistently. The suspended sediment data collected at those stations were found to be erratic. Hence, screening was done for the high and extremely low data to make the rating curve more effective. The suspended sediment concentration data was produced using the suspended sediment rating curve equation provided by Campbell & Bauder53:
 |
Where Sc is the suspended sediment concentration in mg/l, Q is the stream flow in m3/s, and a and b are the coefficients of the rating curve.
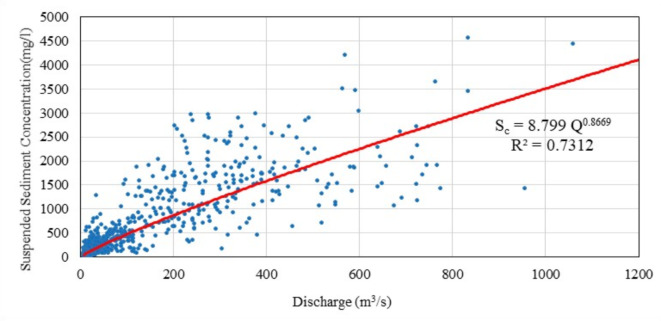
The rating curve equations developed using the Ordinary Least squares (OLS) method for the West Rapti River and the Jhimruk River are Sc= 8.799 Q0.8669 with R2 = 0.7312 and Sc= 2.6459 Q1.2046 with R2 = 0.8579, respectively. OLS is the most popular and widely used approach for deriving the suspended sediment rating curve54.
Figures 6 and 4 represent the suspended sediment rating curves of West Rapti and Jhimruk station.
Fig. 6.
Suspended sediment rating curve for West Rapti River.
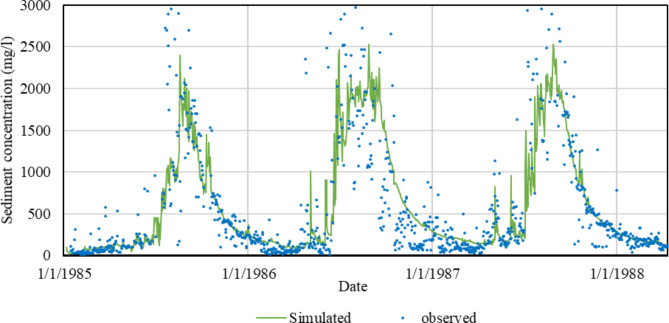
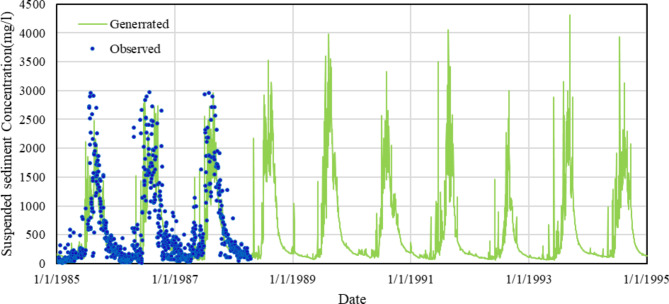
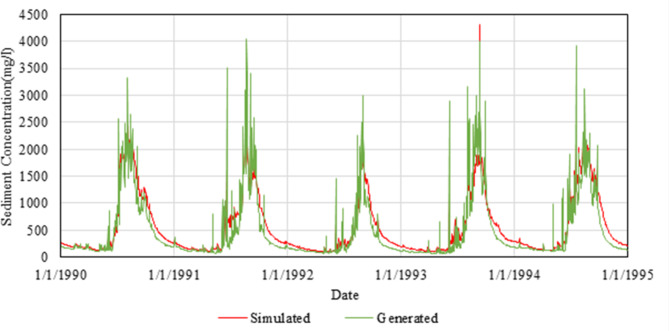
The calibration and validation of the HEC-RAS model for the West Rapti River utilized the flow Series data for the Jhimruk and Madi reaches as upstream boundary conditions. Unlike for reservoir deposition, where a dam was placed in the model for analyzing sediment deposition patterns, the calibration and validation were done in the absence of a dam. Normal depth was used as the downstream boundary condition at dam axis to simulate the river sediment flow at normal condition without reservoir pondage. The calibration for the HEC-RAS model includes choosing the best Manning’s value, sediment transport function, bed sorting method and fall velocity method. The optimal Manning’s value obtained for the left and right banks was 0.035 and for the main channel, it was 0.03. The observed and simulated sediment concentration data at dam axis for calibration at different simulation times from 1985 to 1988 are illustrated in Fig. 7. The coefficient of determination (R2) obtained for the calibration is 0.795, indicating the best model fit for the flow simulations. The suspended sediment rating curve equation of the West Rapti River, shown in Fig. 6, was employed to generate sediment concentration data for the period from 1985 to 1995, which was compared with observed sediment concentration data at West Rapti River, as depicted in Fig. 8. The R2 value obtained was 0.77, indicating that the generated sediment concentration data were suitable for model validation. The maximum sediment generated for the West Rapti River is 4049.32 mg/l, whereas the minimum sediment concentration generated is 65.42 mg/l on August 22, 1991 and June 7, 1992 respectively. The validation of the model was done for the simulation period from 1990 to 1995 between the model simulated sediment concentration data and sediment concentration data generated from the suspended sediment rating curve for the West Rapti River at dam axis, which is demonstrated in Fig. 9. The obtained coefficient of determination (R2) is 0.94, which validates the model setup for further sediment simulation. Additionally, PBIAS values, which are 9.8% and 13.38% for calibration and validation, respectively, suggest very strong model performance. The calibration and validation showed that the Yang function as the load transport equation, Active layer as the bed sorting method and Toffaleti as the fall velocity method were best suited for the West Rapti River.
Fig. 7.
Simulated vs. observed sediment concentration for calibration.
Fig. 8.
Measured and generated sediment concentration for West Rapti River.
Fig. 9.
Simulated vs. generated sediment concentration for validation.
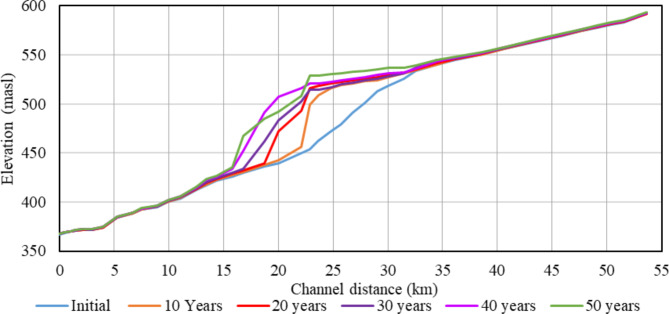
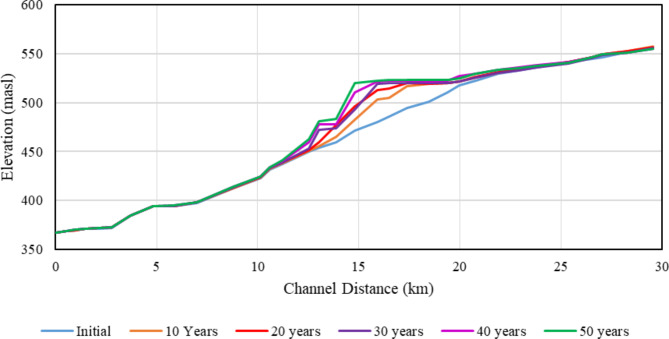
After the calibration and validation of the model, the model was further used for simulation for 50 years. The model output shows the pattern of bed changes and the areas of river channels that follow erosion or deposition. The change in bed level along the river channel due to sedimentation was assessed for a period of 10, 20, 30, 40 and 50 years. Figure 10 shows the sediment deposition along the longitudinal section of Madi and West Rapti River from the dam axis and Fig. 11 shows the sediment deposition along the longitudinal section of Jhimruk and West Rapti River from the dam axis. When a river enters the reservoir submergence region, its velocity drastically drops, and sediment loads begin to accumulate. Sediments suspended in the moving water upstream settle out and deposit on the reservoir bed due to this reduction in flow velocity. Delta deposits were formed by the rapid deposition of the bed load and a coarse fraction of the suspended load, whereas fine particles with slower fall velocities were carried further into the reservoir. Delta deposition at the reservoir started to grow in the downstream direction over a period of time. As the delta advances downstream, the topset and foreset deposits prograde over previously deposited bottomset beds of finer sediments. Delta deposition is reliant on both the reservoir’s minimum operating level and the reservoir’s FSL. Since the reservoir minimum operating level is 473 m and the FSL is 524 m, the area at bed level surrounding these elevations forms a delta zone. From the longitudinal profile sections, the delta deposition for the Madi River propagates from 13 km to 33 km upstream of the dam axis. Additionally, it is seen that the aggradation in the channel extends a distance upwards from the reservoir pool. The highest depths of delta deposition at the Madi River for 10, 20, 30, 40 and 50 years are about 47 m, 62 m, 60 m, 68 m and 75 m respectively, from the river’s bed surface. During the period between 20 and 30 years, a large volume of sediment previously deposited at the pivotal point was eroded and transported downstream of the reservoir due to the high flood during the low stages of the reservoir, which is known as headcutting. The depth of sediment deposition is reduced by 1 m as a result of headcutting, from 20 years to 30 years. A similar scenario of headcutting was seen during the course of the storm in 1993 in Kulekhani Reservoir, where massive delta deposits were eroded and moved downstream towards reservoir during drawdown in next monsoon period55.
Fig. 10.
Longitudinal sediment deposition pattern at Madi River.
Fig. 11.
Longitudinal sediment deposition pattern at Jhimruk River.
Similarly, for the Jhimruk River, the delta deposition extends from 11 km to 22 km upstream along the dam axis. The highest depths of delta deposition at the Madi River for 10, 20, 30, 40 and 50 years are about 23 m, 38 m, 39 m, 41 m and 49 m respectively, from the river’s bed surface. Due to the different reservoir operating levels, another delta deposition was formed just below the downstream minimum operating water level of 473 m after 20 years of simulation. Deep reservoirs that have been used at different levels over time might generate deltas at distinct water levels. Variations in water levels can result in the deposition of sediment in particular regions, which can lead to the construction of deltas1.
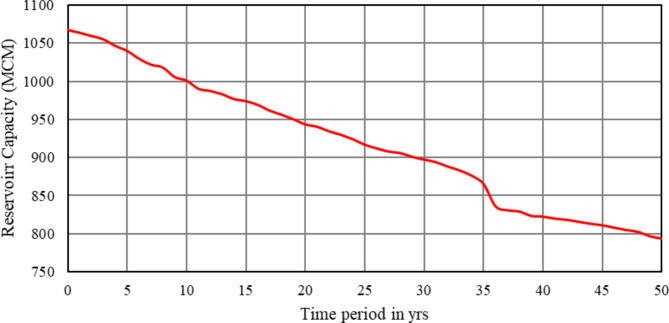
The trend of reservoir storage capacity loss over the 50-year period is illustrated in Fig. 12. The result revels a yearly loss of reservoir capacity by 0.51%. The sedimentation rate increased during the simulation period of 35 to 36 years, which is due to extreme precipitation during that year with an annual discharge of 317 m3/s that resulted in significant sedimentation in the reservoir, reducing reservoir capacity by 2.719% in that year. This implies that reservoir volume declines under continuous climate change and land use change can be understood and predicted using this anticipated time-varying siltation rate and pattern. The cumulative sediment deposition in the reservoir after 10, 20, 30, 40 and 50 years of simulation are 6.22 Mm3, 11.61 Mm3, 15.94 Mm3, 22.96 Mm3 and 25.65 Mm3 respectively. Due to the sedimentation in the reservoir over the course of 10, 20, 30, 40 and 50 years, the storage loss of the reservoir are 6.22%, 11.61%, 15.94%, 22.96% and 25.65% respectively.
Fig. 12.
Reservoir capacity loss over the span of 50 years.
The measured suspended sediment data are not sufficient and continuous. This does not depict the proper sediment model of the river for the study. So, for the precise evaluation of a reservoir’s usable life, steady measurement of sediment concentration is necessary. Combined management at watershed- level and reservoir level should be considered for the reservoir’s long-term sustainability with respect to sedimentation56. The stream discharge and sedimentation in the watersheds are impacted by land use changes and climate change57. Therefore, the sedimentation forecast should be addressed with future changes in climate in order to provide the project’s designers and legislators with concepts for effective sediment control throughout the construction to operation phases.
Conclusions
The West Rapti River, situated in the mid-western region of Nepal, is recognized as a dynamic river because of its extremely erosive characteristics, increasing its capacity to carry large amounts of sediment load into the river. So, extensive research is required to comprehensively acquire the probability of sedimentation occurring in the NMP reservoir project. To fulfill the objective proposed for our research project, we employed 1D HEC-RAS numerical model for simulation of sediment transport and deposition over a 50-year time period within the reservoir, enabling a thorough analysis of long-term sediment dynamics. According to the findings, about 25.65% of the NMP reservoir’s storage capacity is expected to be lost over a span of 50 years, which will be 25.65 Mm3 of reservoir storage volume. Furthermore, the model was calibrated and validated by using Manning’s roughness coefficient, various transport functions, and the fall velocity method incorporated in the HEC-RAS model. The calibration was done for the years 1985–1988 between the model simulated sediment data and the observed sediment data at the hydrological station. The calibration yielded a coefficient of determination (R2) of 0.795 and a PBIAS of 9.8%, indicating that the model performed well for calibrating deposited sediments. The calibrated model was then validated for the years 1990–1995 between the model simulated sediment data and the sediment data generated from the rating curve of the West Rapti River. The validation yielded a coefficient of determination (R2) of 0.94 and a PBIAS of 13.38%, indicating that the model performed well for validation as well.
This study was limited by the unavailability of flow and sediment data, as well as the erroneousness of the data that were accessible. Similarly, the influence of climate change was another factor that was omitted in the study. Therefore, considering climate change impact during the project implementation phase will certainly replicate the trend of sediment deposition in the NMP reservoir and will help in the best sediment management practices during the project operational phase. It is recommended to set up flow and sediment measurement stations in the river and its tributaries along with regular measurement and monitoring by trained personnel, to access the required data readily with high accuracy. This will help to aggrandize the project outcomes in future works.
Author contributions
All authors contributed equally to this work. They were involved in all aspects of the research including conceptualization, methodology, investigation, formal analysis, writing, review, and editing.
Data availability
The datasets generated during and/or analyzed during the current study are available from the corresponding author on reasonable request.
Declarations
Competing interests
The authors declare no competing interests.
Ethical responsibilities
The manuscript satisfy all ethical criteria.
Consent to publish
We have fully agreed to publish the manuscript analyzing sedimentation patterns in the Naumure Multipurpose Project (NMP) Reservoir using 1D HEC-RAS modeling after peer review on the Scientific Reports.
Footnotes
Publisher’s note
Springer Nature remains neutral with regard to jurisdictional claims in published maps and institutional affiliations.
References
- 1.Morris, G. L. & Fan, J. Reservoir Sedimentation Handbook: Design and Management of dams, Reservoirs, and Watersheds for Sustainable use (McGraw-Hill Book, 1997).
- 2.Simons, D. B. & Şentürk, Sediment Transport Technology: Water and Sediment Dynamics (Water Resources Publication, 1992).
- 3.Hoanh, C. T., Jirayoot, K., Lacombe, G. & Srinetr, V. Impacts of Climate Change and Development on Mekong flow Regimes: First assessment – 2009 (Mekong River Commission, 2011).
- 4.Piman, T., Lennaerts, T. & Southalack, P. Assessment of hydrological changes in the lower Mekong Basin from Basin-Wide development scenarios. Hydrol. Process., 27(15), 2115–2125 (2013).
- 5.Asthana, B. N. & Khare, D. Recent Advances in Dam Engineering (Springer, 2022).
- 6.Kondolf, G. M., Rubin, Z. K. & Minear, J. T. Dams on the Mekong: cumulative sediment starvation. Water Resour. Res., 50(6), 5158–5169 (2014).
- 7.Graf, W. H. The hydraulics of reservoir sedimentation. Int. Water Power dam Constr., 35(4), 45–52 (1983).
- 8.Braga, B., de Carvalho, T. R. A., Brosinsky, A., Medeiros, P. H. A. & Foerster, & From waste to resource: cost-benefit analysis of reservoir sediment reuse for soil fertilization in a semiarid catchment. Sci. Total Environ. 670, 158–169 (2019). [DOI] [PubMed] [Google Scholar]
- 9.Garg, A. A., Alemayehu, A. S. & Sumedha, C. Assessment of Sedimentation and Useful Life of Tehri Reservoir using Integrated approaches of Hydrodynamic Modelling, Satellite Remote sensing and empirical curves. Curr. Sci. 118(3), 411-420 (2020).
- 10.Chen, B. F. & Hung, T. Dynamic pressure of water and sediment on rigid dam. J. Eng. Mech. 119 (7), 1411–1433 (1993). [Google Scholar]
- 11.Stallard, R. F. Terrestrial sedimentation and the carbon cycle: coupling weathering and erosion to carbon burial. Glob. Biogeochem. Cycles. 12 (2), 231–257 (1998). [Google Scholar]
- 12.Mulholland, P. J. & Elwood, J. W. The role of lake and reservoir sediments as sinks in the perturbed global carbon cycle. Tellus A: Dynamic Meteorol. Oceanogr. 34 (5), 490–499 (1982). [Google Scholar]
- 13.Wang, J. et al. GeoDAR: georeferenced global dams and reservoirs dataset for bridging attributes and geolocations. Earth Syst. Sci. Data. 14 (4), 1869–1899 (2022). [Google Scholar]
- 14.Sumi, T. & Hirose, T. Accumulation of sediment in reserviors (2009).
- 15.Basson, G. R. Management of siltation in existing and new reservoirs., presented at Proceedings of the 23rd Congress ofthe International Commission on Large Dams ICOLD CIGB, Basilia, Brazil (2009).
- 16.Mahmood, K. Reservoir sedimentation: Impact, Extent and mitigation (1987).
- 17.Schleiss, A. & Cesare, D. Physical model experiments on Reservoir Sedimentation. J. Hydraul. Res. 48(4), 54–57 (2010). [Google Scholar]
- 18.Obialor, C. A., Okeke, O. C., Onunkwo, A. A., Fagorite, V. I. & Ehujuo, N. N. Reservoir sedimentation: causes, effects and mitigation. International Journal of Advanced Academic Research | Sciences, Technology and Engineering 5 (10) (2019).
- 19.Sankey, J. B. et al. Climate, wildfire, and erosion ensemble foretells more sediment in western USA watersheds. Geophys. Res. Lett. 44(17), 8884–8892 (2017). [Google Scholar]
- 20.Strand, R. I. & Pemberton, E. L. Reservoir Sedimentation, Technical Guidelines for Bureau of Reclamation (Engineering and Research Center, 1982).
- 21.Raji, B. M., Turabi, H. & Nasimi, M. N. Sedimentation Analysis of Kabul River by using HEC-RAS. J. Institution Eng. (India): Ser. A. 105(7), 229–238 (2024). [Google Scholar]
- 22.Shrestha, H. M. Cadastre of Potential Hydropower Resource in Nepal (PhD Thesis) (1996).
- 23.Regmi, R. K. Sedimentation Modeling of Karnali Chisapani Multipurpose Project Reservoir, Nepal. J. Institution Eng. (India): Ser. A. 102(3), 815–827 (2021). [Google Scholar]
- 24.NEA. Annual fiscal year report 2022/2023 (2023).
- 25.Sangroula, D. P. Sedimentation and sustainability of the Kulekhani Reservoir. A Himalayan Case, presented at International Conference on Small Hydropower - Hydro Sri Lanka (2007).
- 26.Pradhan, P., Joshi, P. N., Biswakarma, M. B. & Stole, H. Sediment and Thermodynamic Efficiency Measurement at Jhimruk Hydropower Plant, Nepal in Monsoon 2003, presented at roceedings Ninth International Symposium on River Sedimentation, Yichang, China (2004).
- 27.Mbajiorgu, C. C. Reservoir Sedimentation Modelling and Prediction of Project Lifetime. J. Nigerian Acad. Eng. 1(1), 28–41 (2018). [Google Scholar]
- 28.Campos, R. Three-Dimensional Reservior Sedimentation Model (PhD Thesis) (2001).
- 29.Elsersawy, H. Development of Decision Support System (DSS) for high aswan dam reservoir sedimentation, presented at International Congress on River Basin Management, Antalya, Turkey (2007).
- 30.Mamede, G. Reservoir sedimentation in dryland catchments : modelling and management (2008).
- 31.Ahn, J. Numerical Modeling of Reservoir Sedimentation and Flushing Processes (2011).
- 32.Issa, I., Al-Ansari, N., Sherwani, G. & Knutsson, S. Sedimentation processes and useful life of Mosul Dam Reservoir, Iraq. J. Sci. Eng. Res. 5, 779–784 (2013). [Google Scholar]
- 33.U.S. Army Corps of Engineers. HEC-RAS River Analysis System, Version 4.1: User’s Manual. Hydrologic Engineering Center, Davis, CA (2010). [Google Scholar]
- 34.Abdessamed, D., Bouanani, A. & Coupling, H. E. C. R. A. S. and HEC-HMS in rainfall–runoff modeling and evaluating floodplain inundation maps in arid environments: case study of Ain Sefra city, Ksour Mountain. SW of Algeria. Environ. Earth Sci., 78(19), 1–17 (2019).
- 35.Spasojevic, M. & Holly, F. M. Jr. in Sedimentation Engineering: Processes, Measurement, Modelling and Practices, edited by Garcia, M. HASCE,. pp. 683–781. (2008).
- 36.Horritt, M. S. & Bates, P. D. Evaluation of 1D and 2D numerical models for predicting river flow inundation. J. Hydrol. 268, 87–99 (2002). [Google Scholar]
- 37.Yang, C. T. Erosion and Sedimentation Manual (2006).
- 38.US Army Corps of Engineers. HECRAS: River Analysis System, version 6.2 (User’s Manual) (2020).
- 39.Shen & Diplas, P. Modeling unsteady Flow characteristics of Hydropeaking Operations and their implications on Fish Habitat. J. Hydraul. Eng. 136 (12), 1053–1066 (2010). [Google Scholar]
- 40.US Army Corps of Engineers. HEC-RAS River Analysis System (User’s Manual) (2010).
- 41.DOED. Feasibility and EIA study of Naumure Multipurpose Project (2021).
- 42.K.C., S., Adaptation Against Climate Change Impacts on Hydropower Generation and Irrigation Supply of Naumure Multipurpose Project, Nepal (Master Thesis) (2023).
- 43.NEA. Nationwide Master Plan Study on Storage-type Hydroelectric Power Development in Nepal: Final Report (2014).
- 44.MoWR Karnali (Chisapani) Multipurpose Project – Feasibility study (1989).
- 45.DOED, Hydrological and Sedimentation Studies of Karnali Chisapani Multipurpose Project (2020).
- 46.Vieux, B. E. Distributed Hydrologic Modeling Using GIS (Kluwer Academic, 2001).
- 47.Szymkiewicz, R. in Water Science and Technology Library (2010).
- 48.Tadesse The influence of dam construction on the Catchment Hydrologic Behavior and its effects on a Discharge Forecast in Hydrological models. Water Resour. Manage. 35 (6), 1–15 (2021). [Google Scholar]
- 49.Holmes, R. R. Measurement of Bedload Transport in Sand-Bed Rivers: A Look at Two Indirect Sampling Methods (U.S. Geological Survey Scientific Investigations Report) (2010).
- 50.Castillo, L. G., Carrillo, J. M. & Álvarez, M. A. Complementary methods for determining the Sedimentation and Flushing in a Reservoir. J. Hydraul. Eng. 141 (11), p. 0515004 (2015).
- 51.Nash, J. E. & Sutcliffe, J. V. River flow forecasting through conceptual models part I — a discussion of principles. J. Hydrol. 10(3), 282–290 (1970). [Google Scholar]
- 52.Gupta, H., Sorooshian, S. & Yapo, P. Status of automatic calibration for hydrologic models: comparison with Multilevel Expert Calibration. J. Hydrol. Eng. 4 (2), 135–143 (1999). [Google Scholar]
- 53.Campbell, F. B. & Bauder, H. A. A rating-curve method for determining silt-discharge of streams. Eos Trans. Am. Geophys. Union. 21 (2), 603–607 (1940). [Google Scholar]
- 54.Kafle, M. R. Sediment Transport Measurement in the Koshi River: comparison between historic and recent measurement results. Am. J. Water Sci. Eng. 5(3), 111–120 (2019). [Google Scholar]
- 55.Galay, V. J. & Okaji, T. Erosion from the Kulekhani Watershed Nepal During the July 1993, (1995).
- 56.Shrestha, B., Cochrane, T. A., Caruso, B. S., Arias, M. E. & Wild, T. B. Sediment management for Reservoir sustainability and cost implications under land Use/Land cover change uncertainty. Water Resour. Res. 57 (4) (2021).
- 57.Woźniak, P. O., Szalińska, E. & Wilk, P. Do Land Use Changes Balance out Sediment yields under climate change predictions on the Sub-basin Scale? The Carpathian Basin as an Example. Water 12(5), 1499 (2020).
Associated Data
This section collects any data citations, data availability statements, or supplementary materials included in this article.
Data Availability Statement
The datasets generated during and/or analyzed during the current study are available from the corresponding author on reasonable request.


