Abstract
This study aims to develop a theoretical model for predicting the permeability of concrete in underground structures using compressive elastic waves. This research is motivated by the necessity of monitoring the permeability of concrete used in critical underground infrastructure, such as tunnels and radioactive waste disposal sites, to ensure their long-term safety. Increased permeability owing to crack generation can lead to groundwater inflow, undermining the structural integrity of these facilities. Traditional methods for permeability monitoring face challenges at depths of 500 m–1 km owing to high temperatures, high pressures, and limited space conditions. To address these issues, Biot’s model, which correlates the P-wave characteristics with the properties of porous media, was applied in this study. The P-wave velocity and attenuation were studied according to the permeability of concrete based on Biot’s model. Subsequently, concrete specimens were prepared to measure the permeability, P-wave velocity, and attenuation. The permeability results from the experiment were compared with those obtained from the model for validation. The findings indicate that the modified Biot’s model can effectively monitor permeability through elastic wave characteristics, offering a non-destructive and reliable method for assessing the condition of concrete structures in underground environments. This approach is expected to enhance the safety of underground infrastructure through accurate permeability monitoring.
Keywords: Permeability, Concrete, Elastic wave, P-wave velocity, Attenuation, Biot’s model
Subject terms: Energy science and technology, Engineering
Introduction
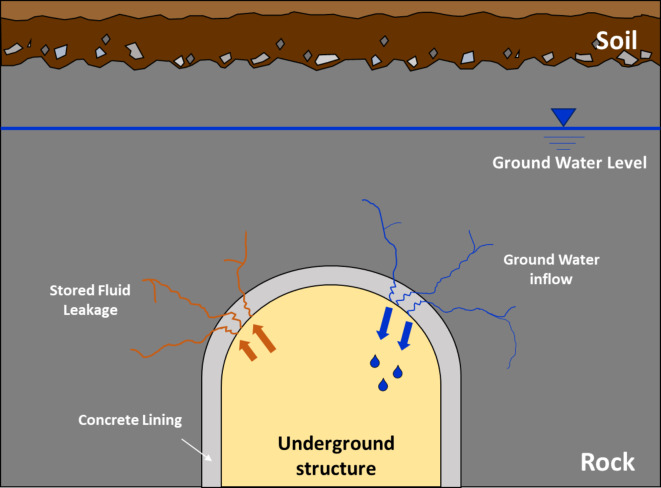
Crucial social infrastructure (such as deep geological repositories, underground liquefied natural gas storage, and tunnels) is located at considerable depths because constructing it in a rock bed provides it with the advantage of being isolated from human activities. Generally, these structures include cementitious materials such as concrete linings or concrete plugs in engineered barriers for mechanical stability and waterproofing1,2. To ensure the safety and long-term operation of a facility, it is necessary to monitor the permeability of concrete structures. The cracks generated by external forces in concrete media within rock bed increase their pore structures (i.e., permeability)3–5. Therefore, in concrete materials, changes in permeability should be monitored because cracks correspond to the fluid flow pathway (e.g., inflow of groundwater or leakage of stored fluid) (Fig. 1).
Fig. 1.
Example of ground water inflow and stored fluid leakage through the crack in concrete material in an underground structure.
The measurement methods for concrete permeability are primarily based on laboratory tests6. Two methods for measuring permeability are the fluid transport method, which uses water, and the chemical ion transport method, which uses chloride ions. The fluid transport method comprises a water absorption test7 and pressurized water permeability test8 based on Darcy’s law. The ion transport method, on the other hand, is employed to measure the permeability using mechanisms based on natural diffusion9–11, migration11,12, and electrical resistivity13,14. However, these test methods have several limitations, including slow and complicated measurement processes, difficulties in specimen preparation, and mechanical deformation of the medium in the field.
An elastic wave can be applied to indirectly evaluate permeability while minimizing damage to the concrete structure. The technique of using elastic waves is non-destructive, ensuring the mechanical stability of the target while yielding rapid and accurate evaluations15. Previous research has reported that permeability is related to the characteristics of the elastic wave velocity. With increasing permeability, the P-wave velocity decreases because its propagation distance increases under conditions of high porosity and large aperture size16,17. Similarly, attenuation, which refers to the energy loss of a propagated wave, increases in concrete media with higher permeability and porosity18,19.
Biot’s model20,21 was proposed to predict P-wave velocity and attenuation using the mechanical properties of the propagated medium (see the detailed properties in Table 1) under fully saturated conditions. On the basis of Biot’s model, several researchers have developed theoretical models using different properties of concrete materials to estimate P-wave characteristics22–24. These models were developed by simplifying Biot’s model to estimate the elastic wave characteristics. In addition, researchers suggested a modified version of Biot’s model based on the saturation level25. Under deep conditions, accounting for the groundwater flow that influences the evaluation of elastic wave characteristics is essential. According to previous studies, modified Biot’s models are insufficient for considering the properties of fluid flow, such as tortuosity and squirt flow length. Therefore, Biot’s model, which can incorporate the properties of the propagated media and saturated fluid, may be appropriate for predicting permeability using elastic wave characteristics. However, to predict the permeability of concrete materials using Biot’s model, developing a theoretical model that considers the saturation level and uses the P-wave velocity and attenuation in backward calculations is crucial.
Table 1.
Parameters in Biot’s model.
| Parameter | Unit | Definition | Note | |
|---|---|---|---|---|
| a | m | Pore size diameter | ||
| B a | Pa | (Air) | Bulk modulus | |
| B f | Pa | (Fluid) |

|
|
| B g | Pa | (Grain) | ||
| B sk | Pa | (Skeleton) |

|
|
| B w | Pa | (Water) | ||
| E | Pa | Young’s modulus | ||
| f | s− 1 | Resonant frequency | ||
| g | m/s2 | Gravitational acceleration | ||
| G sk | Pa | Shear modulus |

|
|
| k | m/s | Permeability | ||
| K | m2 | Absolute hydraulic conductivity |

|
|
| n | – | Porosity | ||
| S | – | Degree of saturation | ||
| T | – | Visco-dynamic operator |
 , ,  and and  are Bessel functions are Bessel functions |
|
| α | – | Tortuosity |

|
|
| ρ g | kg/m3 | (Grain) | Mass density | |
| ρ w | kg/m3 | (Water) | ||
| ρ f | kg/m3 | (Fluid) |

|
|
| ρ mix | kg/m3 | (Mixture) |

|
|
| η | Pa·s | Dynamic viscosity | ||
| ζ | – | Dimensionless factor |

|
|
| ν | – | Poisson’s ratio | ||
| ω | s− 1 | Angular frequency |

|
|
In this study, a prediction model was derived to predict the permeability of concrete materials using P-wave velocity and attenuation. For this purpose, Biot’s model was modified to predict the permeability (for the output) using the P-wave velocity and attenuation (as inputs). The sensitivities of the P-wave velocity and attenuation to the permeability of the concrete material were investigated using the modified model. To verify the modified model, laboratory tests were performed to determine the permeability and wave attenuation, and the test results were compared with those of the modified model. This study is expected to be useful for predicting concrete permeability in underground structures using P-wave characteristics.
Theoretical models based on elastic wave characteristics in porous media: Biot’s model
Biot’s model can be used to evaluate the dynamic wave properties (i.e., P-wave velocity and attenuation) of porous media such as rock or concrete20,21. It is a poroelasticity model that can be used to analyze the characteristics of fluid flow in porous media. The properties of the propagated media (e.g., bulk modulus, permeability, and Poisson’s ratio) and those of the saturated fluid (e.g., density and bulk modulus of water) are required in the formulation of Biot’s model, which is used for evaluating the dynamic properties.
The parameters of the Biot model are listed in Table 1. The parameters consist of 24 inputs; 14 inputs are basic properties of porous media, including the pore size diameter, air bulk modulus, and Young’s modulus, and the remaining 10 are properties calculated using these 14 basic properties, including the fluid bulk modulus and absolute hydraulic conductivity. In this study, Biot’s model, which incorporates the saturation level, was applied to concrete materials, considering groundwater flow under underground conditions. In Biot’s model, the P-wave velocity is calculated as follows25:
 |
1 |
where  is the P-wave velocity expressed as a complex number and the
  is the real part of
  . The parameters
  ,
,  ,
,  , and
, and  can be expressed as follows:
 |
2 |
 |
3 |
 |
4 |
 |
5 |
where, parameters  and
and  can be expressed by the Eqs. (6) and (7):
 |
6 |
 |
7 |
Attenuation (Q− 1) is defined as the ratio of the imaginary number to the real number  and can be expressed as follows:
 |
8 |
where  denotes the quality factor.
  and
and  denote the magnitudes of the imaginary and real parts of the complex number of
  . The attenuation of elastic wave energy is defined as the inverse quality factor (
 ), which is related to the damping ratio (
 ) of the elastic signal as follows:
 |
9 |
To evaluate permeability using the P-wave velocity and attenuation, Biot’s model must be expressed in reverse. Therefore, Eq. (1) can be rearranged and expressed for  as follows:
 |
10 |
By integrating Eq. (5) with Eq. (10) and utilizing the K–k relationship detailed in Table 1, the permeability can be derived as shown in Eq. (11):
 |
11 |
Because  is determined using the characteristics of
  and
and  , measuring the P-wave velocity and attenuation of concrete structures in the field enables the calculation of
  Following this approach, the permeability can be evaluated using Eq. (11) with the parameters of the porous media. This concept is considered an innovative approach for evaluating the permeability of underground structures using elastic wave measurement techniques, specifically for measuring the P-wave velocity and attenuation.
Sensitivity analysis
A sensitivity analysis was performed using Biot’s model to determine the effect of the properties of concrete on P-wave velocity and attenuation. The properties of the concrete were considered by referring to previous studies, and the ranges of the values and selected values are summarized in Table 2.
Table 2.
Values selected for this study.
| Parameter [unit] | Range of value | Values in use | References |
|---|---|---|---|
| a [nm] | 20–150 | 50 | 26 |
| E [GPa] | 10–40 | 10, 20, 30, 40 | 27 |
| k [m/s] | 10− 10–10− 5 | 10− 10, 10− 9, 10− 8, 10− 7, 10− 6, 10− 5 | 3,28,29 |
| n [%] | 5–33 | 5, 15, 25 | 26 |
| S [%] | 1–99 | 1, 50, 99 | 25 |
| α [-] | 1–275 | 30–32 | |
| ν [-] | 0.15–0.25 | 0.2 | 33 |
| ω [kHz] | 5–23 | 5, 10, 15, 23 | 25,34 |
| Ba [kHz] | – | 142 | 35 |
| Bg [GPa] | 50 | 35 | |
| Bw [GPa] | 2.18 | 35 | |
| g [m/s2] | 9.8 | – | |
| ρg [kg/m3] | 2,350 | – | |
| ρw [kg/m3] | 1,000 | – | |
| η [Pa·s] | 0.001 | – |
Effect of permeability on P-wave velocity
The changes in P-wave velocity were analyzed according to the permeability of the concrete material. For the sensitivity analysis, the Young’s modulus and angular frequency were considered to be 30 GPa and 23 kHz, respectively. In addition, the permeabilities were set in the range of 10− 10 m/s to 10− 5 m/s, with 5–25% of porosity (n) and 1–99% of saturation (S). This is because the saturation level cannot exceed 100% because of the presence of isolated and closed pores in the medium; therefore, 99% saturation was considered an apparently fully saturated level in this study.
The analysis of the relationship between permeability and P-wave velocity revealed that the P-wave velocity was insensitive to variations in permeability. The P-wave velocity did not change significantly with increasing permeability (10− 10 m/s to 10− 5 m/s) (Fig. 2). Although the permeability increased, the variation in P-wave velocity was insignificant at saturations below 1% (Fig. 2a). The P-wave velocities in this condition were determined to be 3,639 m/s (n = 5%), 3,846 m/s (n = 15%), and 4,093 m/s (n = 25%). Similarly, at 99% saturation, the P-wave velocities were observed to be 3,614 m/s (n = 5%), 3,737 m/s (n = 15%), and 3,874 m/s (n = 25%), showing no significant variation (Fig. 2c). This phenomenon is attributed to the elastic modulus. In the case of concrete, a brittle material, the elastic modulus is significantly higher than that of voids. Generally, waves propagate primarily through the solid parts of a medium that have a higher elastic modulus. Consequently, permeability, which is characterized by the properties of the voids, does not significantly affect the P-wave velocity.
Fig. 2.
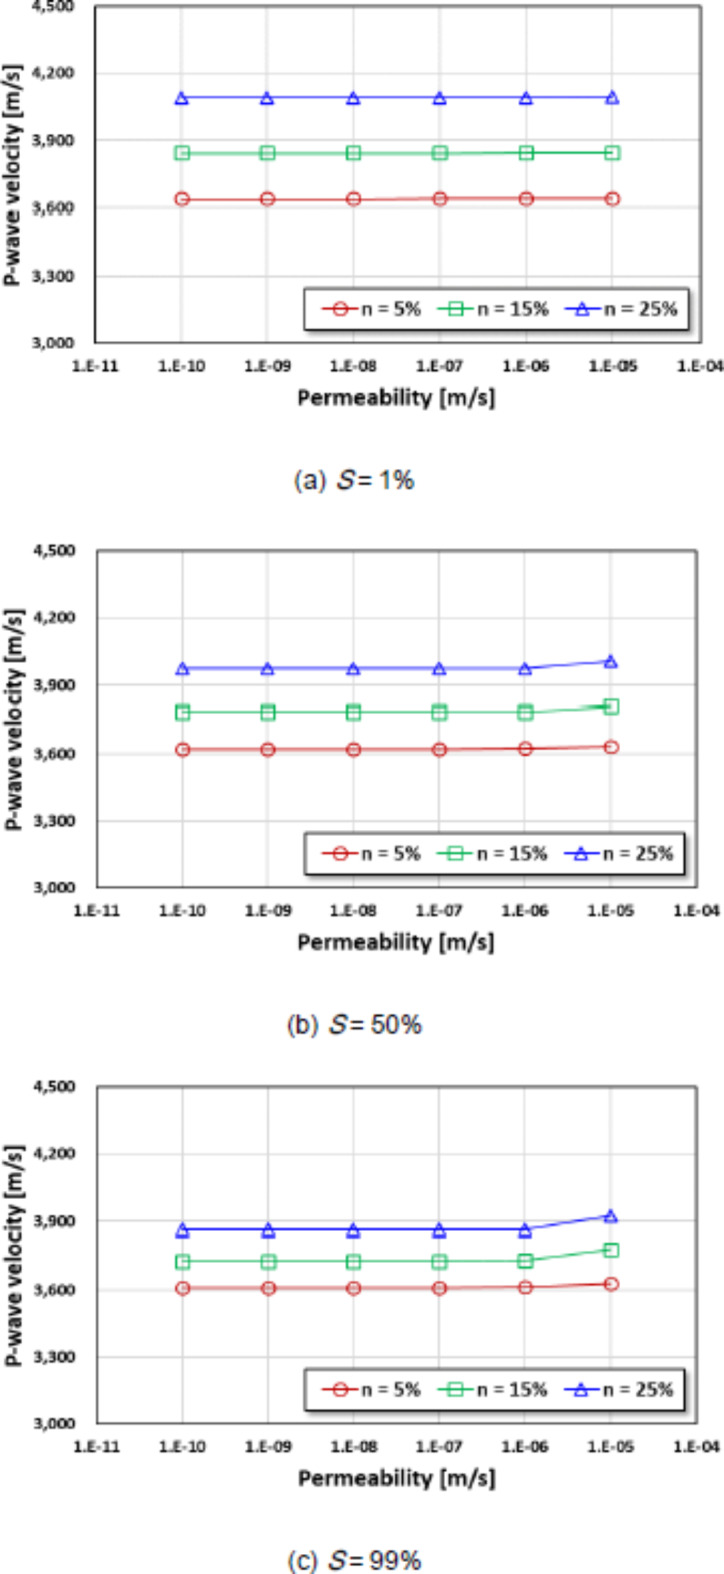
Relationship between permeability and P-wave velocity.
Given these results, it is expected that the P-wave velocity has limitations in evaluating variations in the permeability of concrete materials. Instead, the P-wave velocity can be considered a good index for estimating the stiffness characteristics of concrete materials. Figure 3 shows the variation in the P-wave velocity according to the stiffness at a permeability value of 10− 7 m/s. The P-wave velocity increased by 100.0% (Vp changed from 2,228 m/s to 4,456 m/s) when the Young’s modulus increased by 400% (from 10 GPa to 40 GPa) under 1% saturation condition (Fig. 3a). In addition, the P-wave velocity increased by 99.9% (S = 50%) and 99.1% (S = 99%) with an increase in Young’s modulus (Fig. 3b and c). Generally, a dense medium (e.g., concrete or rock) has a low porosity and high stiffness as compared to a coarse medium (e.g., soil). Therefore, the P-wave velocity is rarely affected by the saturation level of the materials.
Fig. 3.
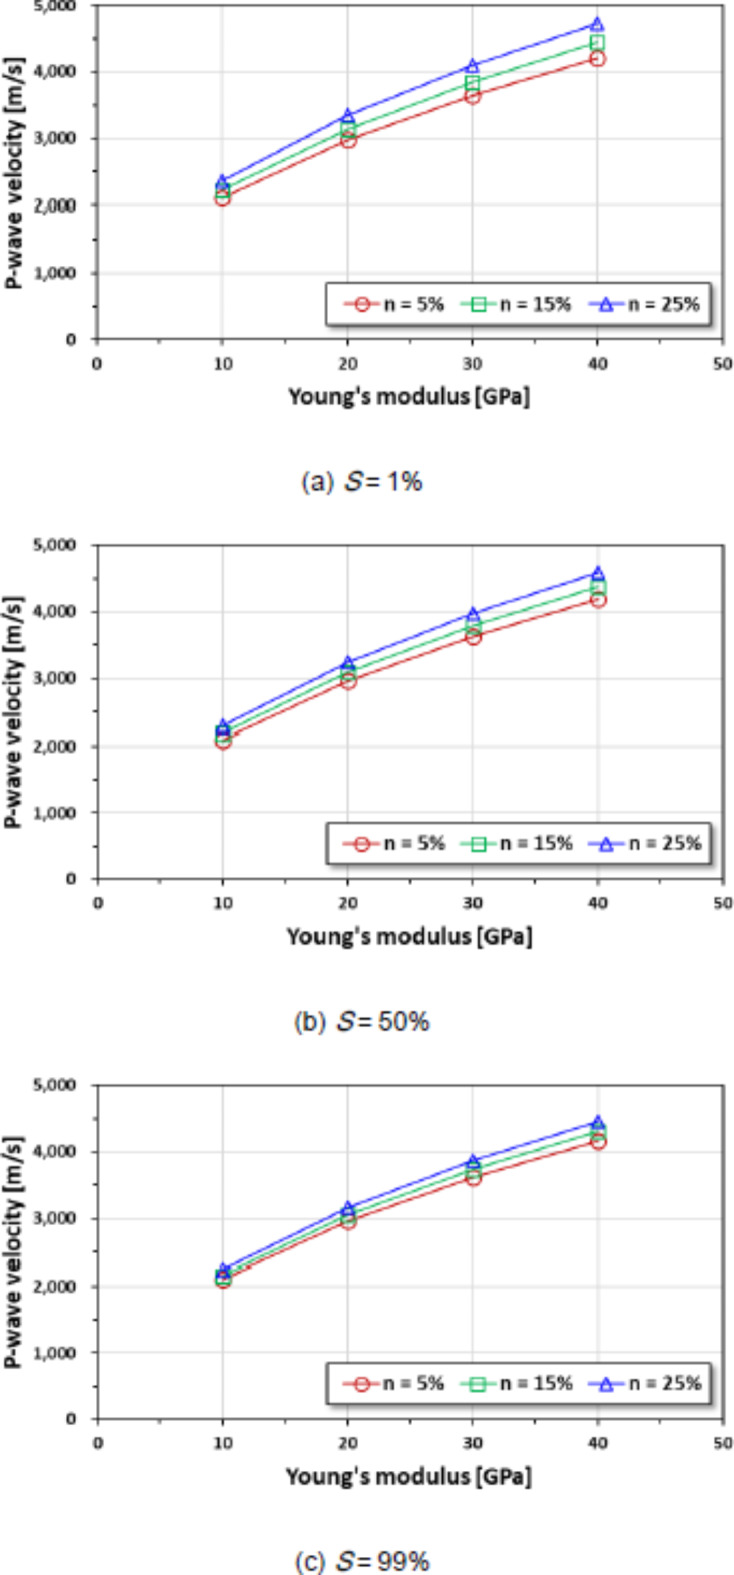
Relationship between Young’s modulus and p-wave velocity.
These results can be explained by the wave velocity being related to the Young’s modulus of the materials. The P-wave velocity is expressed as the relationship between Young’s modulus and Poisson’s ratio35. Additionally, the P-wave velocity increases when the stiffness of the material increases(for example, with an increase in concrete age during the curing process36 or a decrease in the porosity of the concrete material)18. Therefore, P-wave velocity is an inappropriate index for identifying the change in permeability in a concrete medium.
Effect of permeability on attenuation
The attenuation, which is the energy decay in the elastic wave signal, was analyzed based on permeability. The attenuation is expressed as the inverse of the quality factor, which has a relationship of twice the damping ratio (shown as Eq. (9)), which indicates the energy loss of the wave during its propagation through the medium. It is represented by the slope of the frequency–amplitude curve35. It can also be obtained from the frequency–amplitude curve of a Free-Free Resonant Column (FFRC) test in the laboratory25. This study analyzed the effect of permeability on attenuation, assuming Young’s modulus and angular frequency to be 30 GPa and 5 kHz, respectively.
In this study, the attenuation tended to increase with increasing permeability (Figs. 4 and 5). In particular, the attenuation increased with an increase in porosity (n = 5% → 35%) at the same permeability in the range of 10− 10 m/s to 10− 5 m/s under all saturation conditions (S = 1%, 50%, and 99%). In the condition with 5% porosity, the values of attenuation [-] were obtained to be 1.22 × 10− 8 (S = 1%), 6.38 × 10− 7 (S = 50%), and 1.20 × 10− 6 (S = 99%) at a low permeability of 10− 10 m/s (Fig. 4). Meanwhile, at a high permeability of 10− 5 m/s, the values of attenuation were obtained to be 5.44 × 10− 5 (S = 1%), 2.78 × 10− 3 (S = 50%), and 5.32 × 10− 3 (S = 99%). These attenuation values are 4,459 times (S = 1%), 4,357 times (S = 50%), and 4,433 times (S = 99%) greater than those obtained for 10− 10 m/s permeability under the same saturation conditions.
Fig. 4.
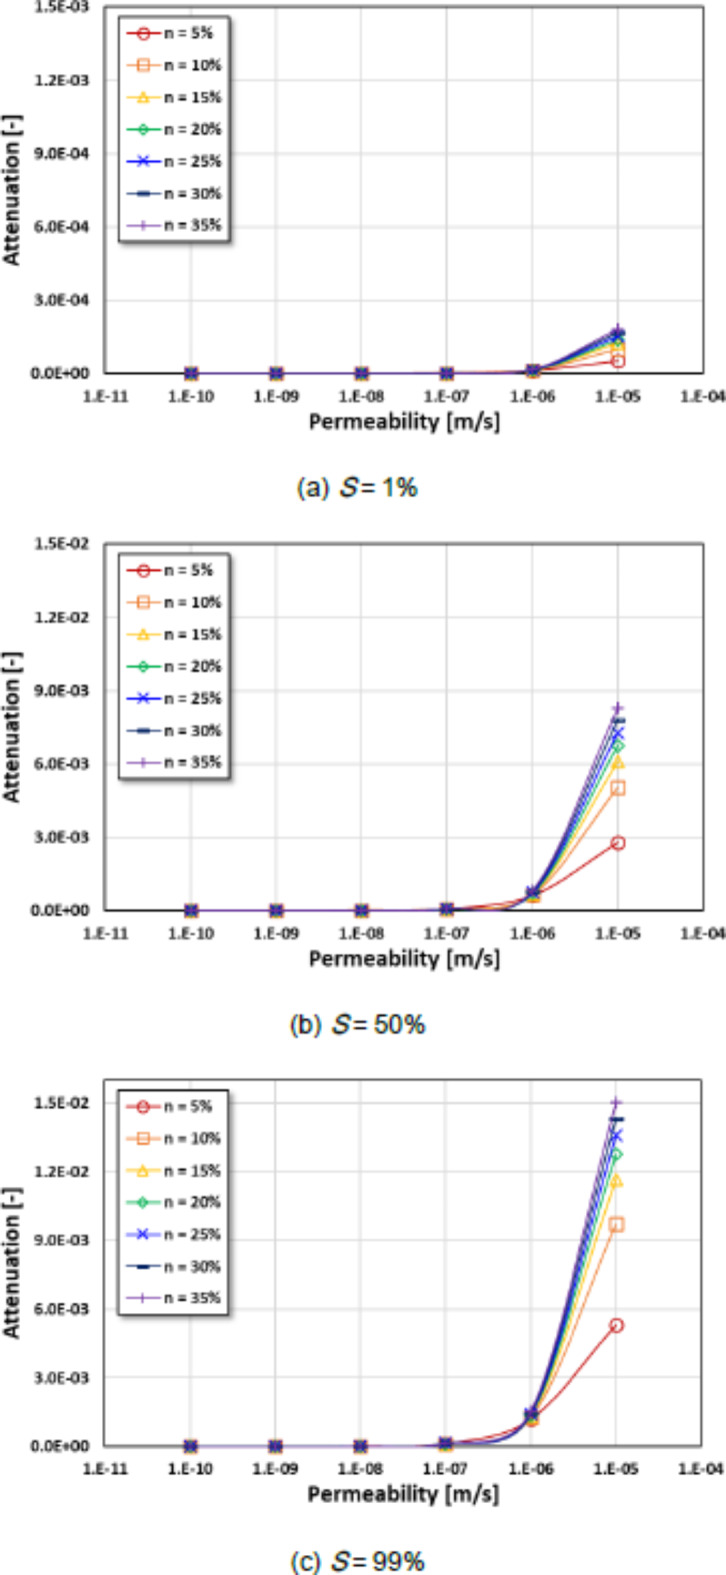
Relationship between permeability and attenuation according to porosity.
Fig. 5.
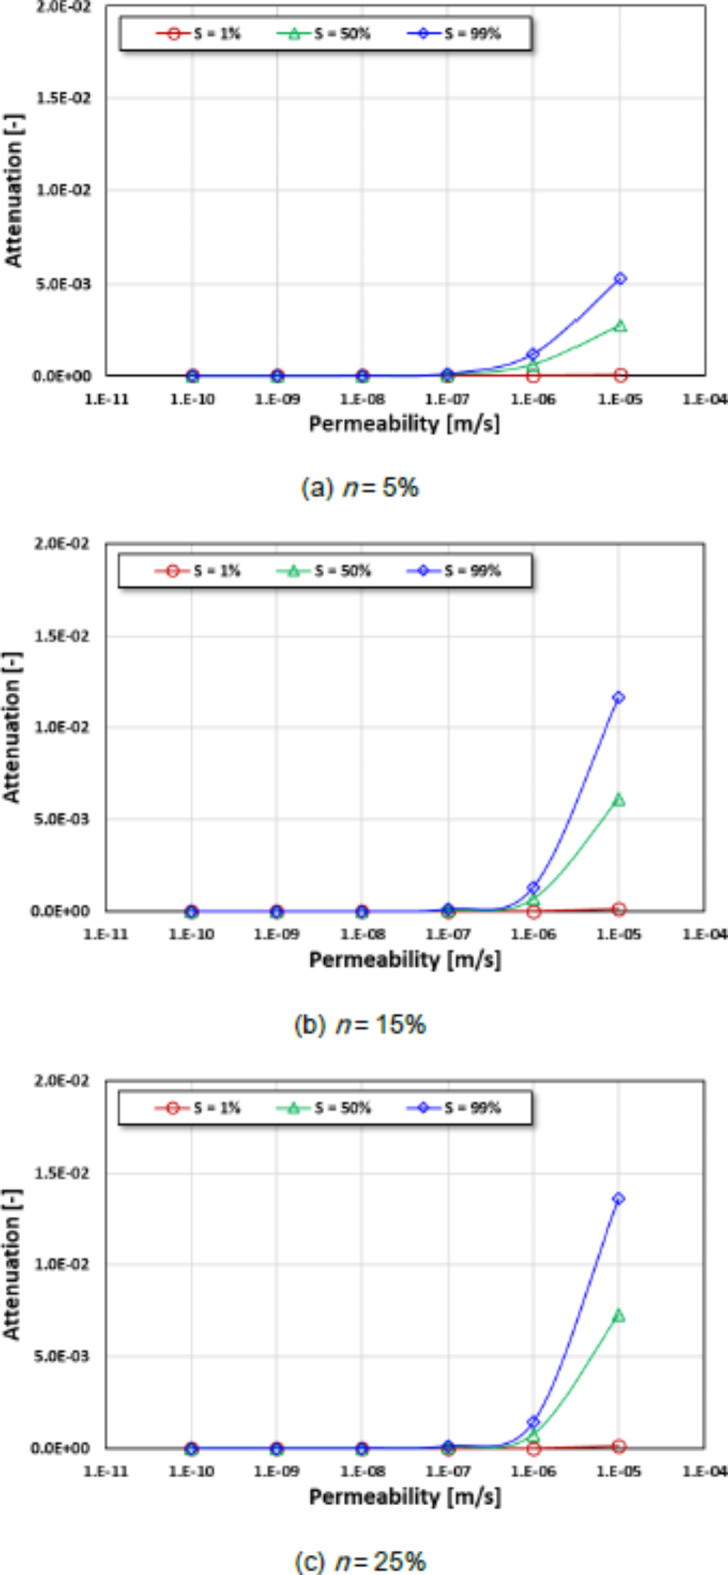
Relationship between permeability and attenuation according to saturation.
To verify the attenuation characteristics at high porosity, attenuation values were evaluated at a porosity of 35%,; the values of attenuation were determined to be 2.26 × 10− 8 (S = 1%), 6.65 × 10− 7 (S = 50%), and 1.54 × 10− 6 (S = 99%) at high permeability of 10− 10 m/s. At a permeability of 10− 5 m/s, the values of attenuation were obtained as 1.82 × 10− 4 (S = 1%), 8.30 × 10− 3 (S = 50%), and 1.50 × 10− 2 (S = 99%). These attenuation values were 8,185 times (S = 1%), 12,481 times (S = 50%), and 9,740 times (S = 99%) greater than those obtained at 10− 10 m/s permeability under the same saturation conditions. In addition, the attenuation increases by 3.4, 3.0, and 2.8 times when the porosity is increased from 5 to 35% in the case of 10− 5 m/s permeability.
The attenuation tended to be higher at a higher degree of saturation with greater permeability. At the same permeability, the values of attenuation were higher under high saturation conditions (S = 99%) than under low saturation conditions (S = 1%), regardless of porosity (Fig. 5). As the degree of saturation approached 1%, the attenuation converged to zero under all conditions of permeability and porosity. When the permeability increased from 10− 10 m/s to 10− 5 m/s, the attenuation was increased from 1.25 × 10− 7 to 5.32 × 10− 3 (n = 5%), 1.09 × 10− 7 to 1.17 × 10− 2 (n = 15%), and 1.30 × 10− 7 to 1.36 × 10− 2 (n = 25%)under 99% saturation.
These test results indicate that attenuation tends to increase with an increase in permeability and porosity. These results can be explained by the fact that the change in attenuation is related to the change in the microstructure, which is caused by a change in the permeability of the concrete materials19. For heterogeneous materials such as concrete, the pore structure is determined by factors such as mix design and curing conditions37. These pore structure characteristics (e.g., pore size, distribution, and connectivity) ultimately determine the permeability of the structure38,39. Subsequently, the propagation path is increased by increasing the pore size because the wave propagates through the contact zone in the medium in permeable concrete materials with a high porosity40. Therefore, the elastic wave diffuses in concrete materials at high permeability, and wave attenuation (i.e., propagated energy loss) is increased.
In addition, the relationship between permeability and attenuation can be applied to highly permeable concrete (k > 10− 7 m/s). In this study, it was observed that the attenuation changed dramatically when the permeability was higher than 10− 7 m/s (Figs. 4 and 5). Therefore, it is expected that permeability can be effectively evaluated using the attenuation characteristics.
Verification of prediction model for permeability
Specimen preparation
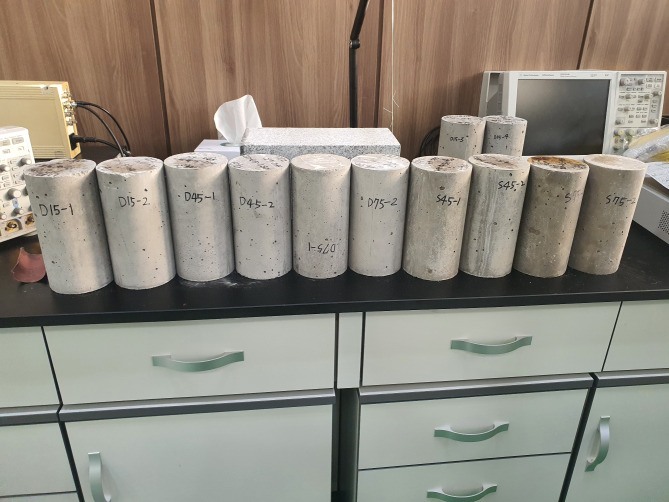
Cylindrical concrete specimens were prepared to measure the attenuation of the concrete material in the laboratory (Fig. 6). Twelve concrete specimens corresponding to a diameter-to-length ratio of 1:2 (100 mm in diameter and 200 mm in length) were prepared to obtain the wave velocity and attenuation by performing FFRC tests.
Fig. 6.
Concrete specimens for verification.
The concrete specimens were cured under fully saturated and dry conditions to prepare specimens with various permeabilities in accordance with ASTM C642. Firstly, the fully saturated specimens were cured in a water chamber at 20 °C ± 2 °C for 28 days. Additionally, the dry samples were air-cured under the same temperature conditions. To produce specimens with varying permeabilities, an additional curing process was performed for 32 days under three different temperature conditions (15, 45, and 75 °C) using a temperature chamber. Permeability was measured using the standard test method (KS F 2322) to verify the permeability prediction model. The properties of the concrete specimens (i.e., specific gravity, porosity, absorption, and permeability) were obtained from laboratory tests. The values are 2.24–2.36 for specific gravity, 5.61–13.19% for porosity, and 2.38–5.90% for absorption, respectively (Table 3).
Table 3.
Properties of concrete specimens.
| Specimen | Specific gravity [-] | Porosity [%] | Absorption [%] | Permeability [×10− 9 m/s] | Curing temperature [°C] | Curing condition [-] |
|---|---|---|---|---|---|---|
| #S1 | 2.27 | 8.39 | 3.69 | 10.00 | 15 | *FS |
| #S2 | 2.31 | 7.63 | 3.31 | 2.67 | ||
| #D1 | 2.24 | 10.79 | 4.81 | 7.74 | **D | |
| #D2 | 2.25 | 11.47 | 5.11 | 2.09 | ||
| #S3 | 2.33 | 7.51 | 3.23 | 10.07 | 45 | FS |
| #S4 | 2.36 | 5.61 | 2.38 | 4.63 | ||
| #D3 | 2.26 | 11.78 | 5.21 | 3.47 | D | |
| #D4 | 2.25 | 11.66 | 5.19 | 3.75 | ||
| #S5 | 2.27 | 6.94 | 3.06 | 4.07 | 75 | FS |
| #S6 | 2.31 | 6.11 | 2.65 | 7.09 | ||
| #D5 | 2.28 | 11.80 | 5.18 | 3.20 | D | |
| #D6 | 2.24 | 13.19 | 5.90 | 1.62 |
*FS: Fully saturated, **D: Dried.
Test setup and procedures
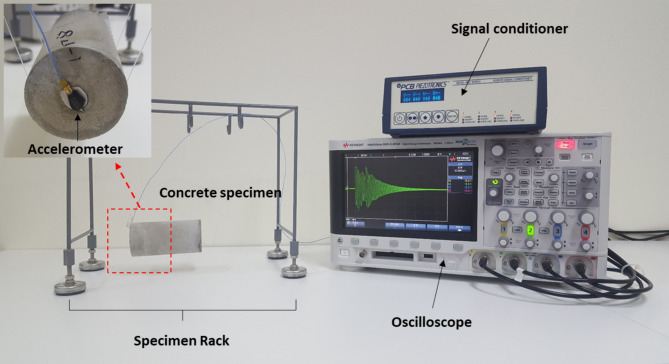
Figure 7 shows the FFRC test system used to measure the compressive wave velocity and attenuation of the concrete specimens. The system comprised a specimen rack, an accelerometer, a signal conditioner, and an oscilloscope. In the test system, the concrete specimens were set to generate a free face at both ends of the specimen rack. An accelerometer with a frequency range of 1.0 Hz to 20 kHz was used to gather the elastic wave. A signal conditioner was used to amplify the measured signal from the accelerometer. On the oscilloscope, the measured signals were displayed and stored to analyze the P-wave velocity and attenuation of the concrete specimens.
Fig. 7.
Test setup to evaluate the compressive wave velocity and attenuation of specimens (after34).
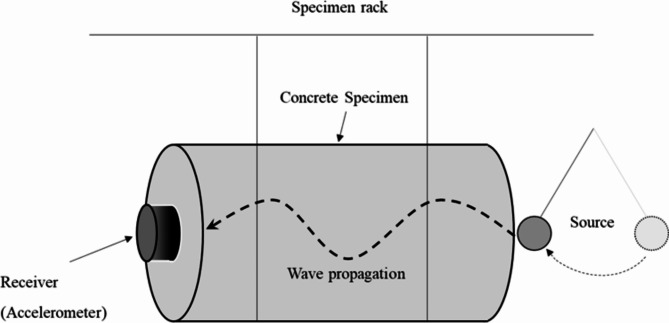
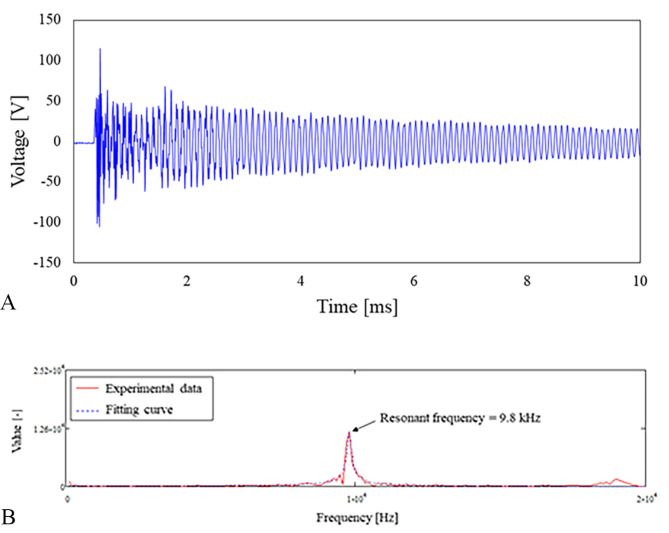
The concrete specimen was set in the specimen rack, and an accelerometer was attached to the center at the end of the specimen (one side) using vacuum grease (Fig. 8). Artificial vibrations were generated on the other side of the specimen using a bar with a steel ball, and the signals were measured using an accelerometer. The signals were amplified up to 40 times using a signal conditioner, and the data were stored using an oscilloscope. The FFRC test was performed three times for each specimen. After each test, the compressive wave velocity and attenuation of the concrete specimens were converted using a fast Fourier transform (FFT), and the compressive wave velocity and attenuation were obtained from the resonant frequency and curve-fitting plot by applying the least squares method in the frequency-voltage domain (Fig. 9).
Fig. 8.
Concept of FFRC test for measuring the characteristics of compressive waves.
Fig. 9.
Example of measured signals in (a) time and (b) frequency domains.
Permeability comparison between results of test and prediction model
The elastic wave characteristics, namely the wave velocity, attenuation, and resonant frequency, were analyzed using the FFRC test. For the test results, the values obtained from the elastic wave signals using an accelerometer were averaged, and the measurements were performed three times after artificial vibration. Table 4 lists the FFRC test results for the concrete specimens. Based on these test results, we observed that the compressive wave velocity was in a range of 3,775 m/s to 4,290 m/s, and the values of attenuation and resonant frequency were in ranges of 0.021 to 0.031 and 9.6 kHz to 11.0 kHz, respectively.
Table 4.
Results of FFRC test using concrete specimens.
| Specimen | Compressive wave velocity [m/s] | Attenuation, Q− 1 [-] | Resonant frequency, Fr [kHz] |
|---|---|---|---|
| #S1 | 4290 *(0.0) | 0.023 (0.002) | 11.0 (0.0) |
| #S2 | 4290 (0.0) | 0.025 (0.002) | 11.0 (0.0) |
| #D1 | 4030 (0.0) | 0.023 (0.001) | 10.3 (0.0) |
| #D2 | 4073 (0.0) | 0.026 (0.004) | 10.4 (0.0) |
| #S3 | 4290 (0.0) | 0.021 (0.001) | 11.0 (0.0) |
| #S4 | 4290 (0.0) | 0.029 (0.011) | 10.9 (0.0) |
| #D3 | 4273 (376.2) | 0.025 (0.004) | 10.2 (0.1) |
| #D4 | 3996 (0.0) | 0.025 (0.002) | 10.2 (0.0) |
| #S5 | 4211 (0.0) | 0.023 (0.002) | 10.9 (0.1) |
| #S6 | 4203 (0.0) | 0.023 (0.002) | 10.8 (0.0) |
| #D5 | 3775 (20.3) | 0.031 (0.004) | 9.6 (0.1) |
| #D6 | 3794 (0.0) | 0.026 (0.002) | 9.8 (0.0) |
*( ): standard deviation of measured values.
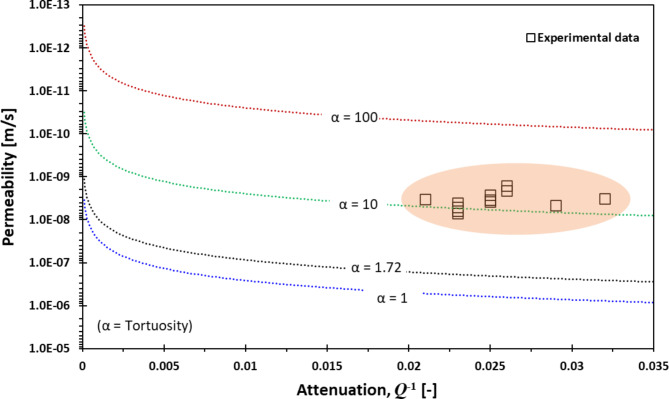
To investigate the permeability using the prediction model based on attenuation, experimental results and referred values of concrete materials were used (Tables 2 and 3, and 4), namely, P-wave velocity (Vp) of 4,000 m/s, angular frequency (ω) of 10 kHz, porosity (n) of 10%, Young’s modulus (E) of 30 GPa, Poisson’s ratio (ν) of 0.2, pore size diameter (a) of 50 nm, and saturation (S) of 1%. In addition, the tortuosity (α) in concrete materials with high density and strength for underground structures, such as engineered barriers in deep geological storage, falls within the range of 1 to 10030,32. Therefore, in this study, the relationship between attenuation and permeability was analyzed by considering tortuosity values in the 1–100 range.
The experimental attenuation and permeability data for the concrete specimens were compared with the attenuation–permeability curves obtained from the prediction model. In Fig. 10, the laboratory test results (hollow squares in the scatter plot) match well with the curve for the predicted permeability based on attenuation when the tortuosity is 10 (green curve). For impermeable concrete materials, the value of tortuosity is in the range of 10–25 when the porosity is in the range of 6–10%31. The difference between the measured and predicted permeabilities was calculated to be less than 2.58 × 10− 9 m/s with a standard deviation of 1.42 × 10− 9 m/s.
Fig. 10.
Permeability comparison of experimental results and prediction model based on attenuation.
Through verification, it was concluded that the permeability can be estimated by analyzing attenuation in conjunction with the properties of concrete materials. In this study, the validation of the modified Biot’s model was conducted on limited specimens and conditions, so the accuracy and reliability of the validation need to be improved in future studies. However, the modified Biot’s model from this study represents an innovative approach to evaluating the permeability of concrete structures in the field using elastic wave characteristics. Therefore, it is expected that the proposed model can be utilized as a simple, quick, and accurate permeability monitoring approach to prevent disturbances to structures in the field.
Conclusion
Concrete materials have been widely used in important infrastructure under underground conditions, such as engineered barriers for deep geological storage and tunnel linings. Monitoring the permeability variation in concrete materials is crucial because it is related to the pathway of groundwater inflow and leakage of stored fluid. In this study, Biot’s model, which is based on the characteristics of compressive elastic waves, was used to estimate the permeability of concrete materials for nondestructive monitoring. A sensitivity analysis was performed to evaluate the P-wave velocity and attenuation according to the permeability of the concrete materials. In addition, the characteristics of the elastic waves were investigated by performing laboratory tests to validate the prediction model. The following results were obtained:
A permeability prediction model for porous media, based on the characteristics of elastic waves, was derived using Biot’s model. The permeability of a concrete material can be calculated using the prediction model employing the P-wave characteristics of velocity and attenuation, along with the concrete properties.
During the sensitivity analysis of P-wave velocity and attenuation with respect to permeability, the change in P-wave velocity was determined to be insignificant with an increase in permeability. Instead, our analysis showed that the P-wave velocity values changed dramatically with the variation in Young’s modulus. Therefore, P-wave velocity is unsuitable for evaluating permeability characteristics.
The attenuation was found to vary significantly with the variation in permeability. In particular, the increase in attenuation was higher in cases of high porosity and saturation when the permeability was increased. It was inferred that attenuation is related to the pore structure (i.e., permeability, porosity, saturation, and pore size). In addition, the wave propagation path and energy loss of the waves increase. Therefore, attenuation increases in concrete materials with high porosity and permeability.
An experimental test was performed to verify the prediction model for permeability based on attenuation. Through a comparison between the modified Biot’s model and the experimental test results, it was verified that the attenuation–permeability curve can be used to estimate the permeability using attenuation. In this study, the limited properties of concrete were considered to derive a prediction model for permeability. Nevertheless, the results of this study can be utilized for the non-destructive estimation of the permeability of concrete using the characteristics of elastic waves in underground structures.
Acknowledgements
This work was supported by the Institute for Korea Spent Nuclear Fuel (iKSNF) and National Research Foundation of Korea (NRF) grant funded by the Korea government (Ministry of Science and ICT, MSIT) (2021M2E1A1085193) and by the Brain Korea 21 FOUR Project in the Education & Research Center for Infrastructure of Smart Ocean City (i-SOC Center) (Grant No. 4120240614905).
Author contributions
Lee, J.W.: Methodology, Formal analysis, Investigation, Writing original draft; Kim, J.S.: Methodology, Conceptualization, Funding acquisition; Hong, C.H.: Investigation, Methodology; Oh, T.M.: Conceptualization, Writing original draft, Supervision, Funding acquisition.
Data availability
The datasets used and/or analyzed during the current study available from the corresponding author on reasonable request.
Declarations
Competing interests
The authors declare no competing interests.
Footnotes
Publisher’s note
Springer Nature remains neutral with regard to jurisdictional claims in published maps and institutional affiliations.
References
- 1.Alexander, W. R., Reijonen, H. M. & McKinley, I. G. Natural analogues: Studies of geological processes relevant to radioactive waste disposal in deep geological repositories. Swiss J. Geosci.108(1), 75–100 (2015). [Google Scholar]
- 2.Holter, K. G. Loads on sprayed waterproof tunnel linings in jointed hard rock: A study based on Norwegian cases. Rock. Mech. Rock. Eng.47 (3), 1003–1020 (2014). [Google Scholar]
- 3.Hou, S., Li, K., Wu, Z., Li, F. & Shi, C. Quantitative evaluation on self-healing capacity of cracked concrete by water permeability test–A review. Cem. Concr Compos.127, 104404 (2022). [Google Scholar]
- 4.Shi, H. et al. Dynamic strength characteristics of fractured rock mass. Eng. Frac Mech.292, 109678 (2023). [Google Scholar]
- 5.Shi, H., Chen, W., Zhang, H. & Song, L. A novel obtaining method and mesoscopic mechanism of pseudo-shear strength parameter evolution of sandstone. Environ. Earth Sci.82(2), 60 (2023). [Google Scholar]
- 6.Milla, J. et al. Methods of test for concrete permeability: A critical review. Adv. Civ. Eng. Mater.10(1), 172–209 (2021). [Google Scholar]
- 7.BS 1881 – 208. Testing concrete – Recommendation for the Determination of the Initial Surface Absorption of Concrete. (British Standards Institute, 1996).
- 8.Andrzej, M. & Marta, M. WT–new testing system for in-situ measurements of concrete water permeability. Procedia Eng.153, 483–489 (2016). [Google Scholar]
- 9.AASHTO T 259. Standard Method of test for Resistance of Concrete to Chloride ion Penetration. (American Association of State Highway and Transportation Officials, 2021).
- 10.ASTM C1543. Standard test Method for Determining the Penetration of Chloride ion into Concrete by Ponding. (ASTM International, 2010).
- 11.AASHTO T 277. Standard Method of test for Electrical Indication of Concrete’s Ability to Resist Chloride ion Penetration. (American Association of State Highway and Transportation Officials, 2022).
- 12.ASTM C1202. Standard test method for electrical indication of concrete’s ability to resist chloride ion penetration. ASTM International. (2019).
- 13.AASHTO T 358. Standard Method of test for Surface Resistivity Indication of Concrete’s Ability to Resist Chloride Ion Penetration (American Association of State Highway and Transportation Officials, 2022).
- 14.ASTM C1760. Standard test Method for bulk Electrical Conductivity of Hardened Concrete. (ASTM International, 2012).
- 15.Maierhofer, C., Reinhardt, H. W. & Dobmann, G. Non-destructive Evaluation of Reinforced Concrete Structures: Non-destructive Testing Methods. (Woodhead publishing, 2010).
- 16.Gomez, C. T., Dvorkin, J. & Vanorio, T. Laboratory measurements of porosity, permeability, resistivity, and velocity on Fontainebleau sandstones. Geophyssics75 (6), E191–E204 (2010). [Google Scholar]
- 17.Sawayama, K. et al. Elastic wave velocity changes due to the fracture aperture and density, and direct correlation with permeability: an energetic approach to mated rock fractures. J. Geophys. Res. Solid Earth 127(2), eJB022639 (2022). (2021).
- 18.Ridengaoqier, E., Hatanaka, S., Palamy, P. & Kurita, S. Experimental study on the porosity evaluation of pervious concrete by using ultrasonic wave testing on surfaces. Constr. Build. Mater.300, 123959 (2021). [Google Scholar]
- 19.Mehamdia, A. & Benouis, A. H. Influence of the size and frequency of contact transducers on the determination of concrete permeability by ultrasonic velocity and attenuation. J. Mater. Environ. Sci.9(3), 730–740 (2018). [Google Scholar]
- 20.Biot, M. A. Theory of propagation of elastic waves in a fluid-saturated porous solid. I. Low-frequency range. J. Acoust. Soc. Am.28(2), 168–178 (1956a). [Google Scholar]
- 21.Biot, M. A. Theory of propagation of elastic waves in a fluid-saturated porous solid. II. Higher frequency range. J. Acoust. Soc. Am.28(2), 179–191 (1956b). [Google Scholar]
- 22.Carcione, J. M. & Gurevich, B. Differential form and numerical implementation of Biot’s poroelasticity equations with squirt dissipation. Geophysics76(6), N55–N64 (2011). [Google Scholar]
- 23.Jian-Xin, N., Ding-Hui, Y. & Viscoelastic BISQ model for low-permeability sandstone with clay. Chin. Phys. Lett.25(8), 3079 (2008). [Google Scholar]
- 24.Yang, J., Yang, D., Han, H., Qiu, L. & Cheng, Y. A wave propagation model with the Biot and the fractional viscoelastic mechanisms. Sci. Chin. Earth Sci.64(3), 364–376 (2021). [Google Scholar]
- 25.Oh, T. M., Kwon, T. H. & Cho, G. C. Effect of partial water saturation on attenuation characteristics of low porosity rocks. Rock. Mech. Rock. Eng.44(2), 245–251 (2011). [Google Scholar]
- 26.Kumar, R. & Bhattacharjee, B. Porosity, pore size distribution and in situ strength of concrete. Cem. Concr Res.33(1), 155–164 (2003). [Google Scholar]
- 27.Jurowski, K. & Grzeszczyk, S. The influence of concrete composition on Young’s modulus. Procedia Eng.108, 584–591 (2015). [Google Scholar]
- 28.Aldea, C. M., Shah, S. P. & Karr, A. Permeability of cracked concrete. Mat. Struct.32(5), 370–376 (1999). [Google Scholar]
- 29.Banthia, N., Biparva, A. & Mindess, S. Permeability of concrete under stress. Cem. Concr Res.35(9), 1651–1655 (2005). [Google Scholar]
- 30.Ahmad, S., Azad, A. K. & Loughlin, K. F. A study of permeability and tortuosity of concrete. In: 30th conference on our world in concrete and structures. 45, 23–30 (2005).
- 31.Boukhatem, B., Rebouh, R., Zidol, A., Chekired, M. & Tagnit-Hamou, A. An intelligent hybrid system for predicting the tortuosity of the pore system of fly ash concrete. Constr. Build. Mater.205, 274–284 (2019). [Google Scholar]
- 32.Zhong, R., Xu, M., Netto, R. V. & Wille, K. Influence of pore tortuosity on hydraulic conductivity of pervious concrete: characterization and modeling. Constr. Build. Mater.125, 1158–1168 (2016). [Google Scholar]
- 33.Lee, J. W., Kim, H. & Oh, T. M. Acoustic emission characteristics during uniaxial compressive loading for concrete specimens according to sand content ratio. KSCE J. Civ. Eng.24(9), 2808–2823 (2020). [Google Scholar]
- 34.Lee, J. W., Oh, T. M., Kim, H. & Kim, M. K. Coupling material characteristics with water–cement ratio for elastic wave based monitoring of underground structure. Tunn. Undergr. Space Technol.84, 129–141 (2019). [Google Scholar]
- 35.Santamarina, J. C., Klein, K. A., Fam, M. A. & Soils and waves (J. Wiley & Sons, (2001).
- 36.Robeyst, N., Gruyaert, E. & Grosse, C. U. De Belie, N. Monitoring the setting of concrete containing blast-furnace slag by measuring the ultrasonic p-wave velocity. Cem. Concr Res.38(10), 1169–1176 (2008). [Google Scholar]
- 37.Zhang, J. et al. Effect of pore structures on gas permeability and chloride diffusivity of concrete. Constr. Build. Mat.163, 402–413 (2018). [Google Scholar]
- 38.Atahan, H. N., Oktar, O. N. & Taşdemir, M. A. Effects of water–cement ratio and curing time on the critical pore width of hardened cement paste. Constr. Build. Mat.23(3), 1196–1200 (2009). [Google Scholar]
- 39.Poon, C. S., Kou, S. C. & Lam, L. Compressive strength, chloride diffusivity and pore structure of high performance metakaolin and silica fume concrete. Constr. Build. Mat.20(10), 858–865 (2006). [Google Scholar]
- 40.Wu, J. et al. Improvement of cemented rockfill by premixing low-alkalinity activator and fly ash for recycling gangue and partially replacing cement. Cem. Concr. Compos.145, 105345 (2024). [Google Scholar]
Associated Data
This section collects any data citations, data availability statements, or supplementary materials included in this article.
Data Availability Statement
The datasets used and/or analyzed during the current study available from the corresponding author on reasonable request.


