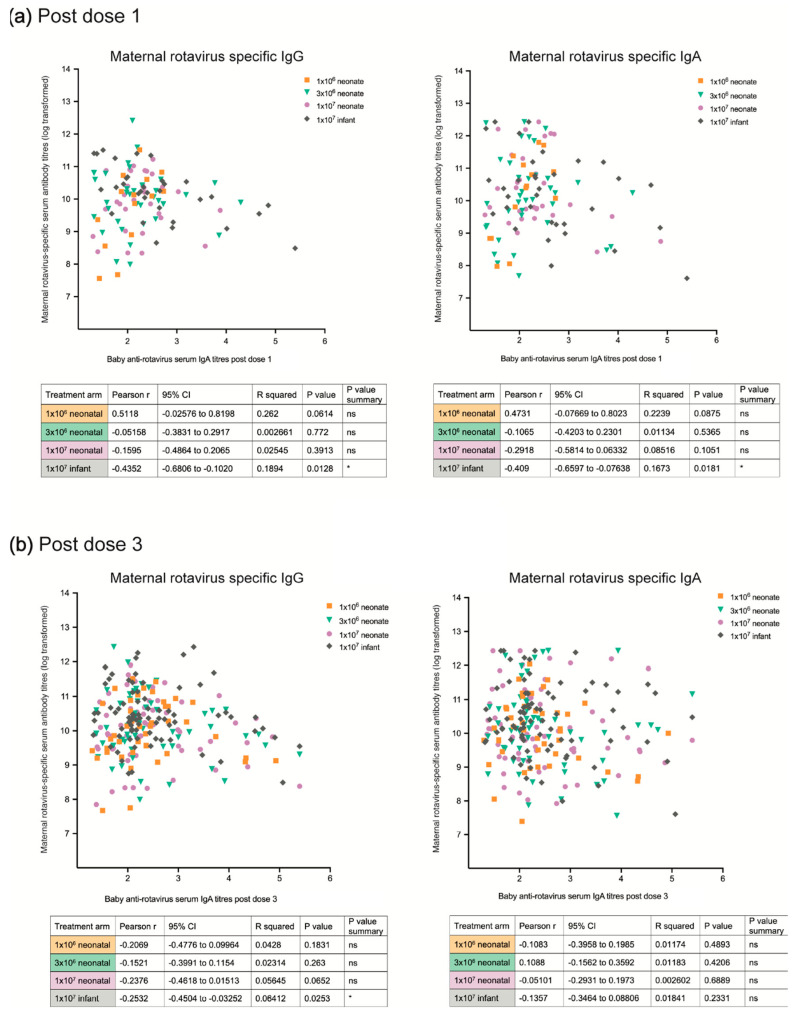
Figure 5.
Maternal rotavirus-specific serum IgA and IgG antibody titres are plotted against the anti-rotavirus serum IgA antibody titres of their infant after (a) the first dose (post vaccine dose 1) and (b) the full three-dose course (post vaccine dose 3) in each of the four treatment allocation groups. Separate linear regression models were used to explore the relationship between maternal rotavirus-specific serum IgA and IgG antibody titres (log transformed) against infant anti-rotavirus serum IgA antibody titre after vaccine dose 1 and dose 3. Statistical analyses were performed with Prism (GraphPad Software, Inc., version 10.0.1) by use of the unpaired Mann–Whitney test due to data not fitting the normal distribution. A p value of less than 0.05 was considered to be significant. 95% CI = 95% confidence interval. * = significant p < 0.05. ns = not significant p > 0.05. 1.0 × 10⁶ neonate = low-titre neonatal vaccine schedule group. 3.0 × 10⁶ neonate = mid-titre neonatal vaccine schedule group. 1.0 × 10⁷ neonate = high-titre neonatal vaccine schedule group. 1.0 × 10⁷ infant = infant vaccine schedule group.

