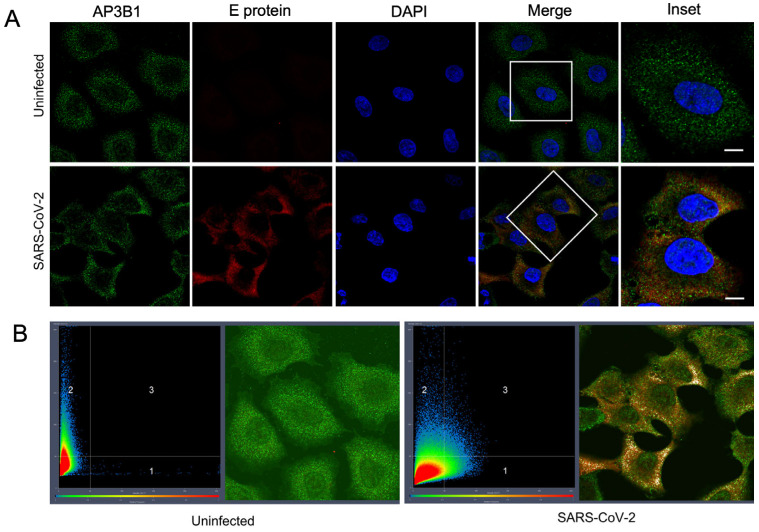
Figure 1.
AP3B1 interacts with SARS-CoV-2 E. (A) A549 (ACE2) cells were infected with SARS-CoV-2 (MOI 1) and stained for endogenous AP3B1 (green) and SARS-CoV-2-E (red), revealing colocalization (yellow) of the two proteins. Scale bar represents 10 μM. Representative image shown from two independent experiments. White box depicts area shown in Inset. (B) Colocalization analysis of endogenous AP3B1 in uninfected A549 cells (green; Quadrant 2 of left panel) or cells infected with SARS-CoV-2 counterstained for the viral Envelope (E) protein (red; Quadrant 1 of right panel). Pixels where colocalization is apparent in Quadrant 3 are pseudo-colored white.

